

Base Year Value ()
x.x %
x.x %
CAGR ()
x.x %
x.x %
Forecast Year Value ()
x.x %
x.x %
Historical Data Period
Largest Region
Forecast Period
Mercato della fratturazione idraulica per tipo di pozzo (pozzo orizzontale, pozzo verticale), per tecnologia (Plug and Perf, Sliding Sleeve), per applicazione (Shale Gas, Tight Oil, Tight Gas) e regione, tendenze globali e previsioni dal 2023 al 2030.
Instant access to hundreds of data points and trends
- Market estimates from 2014-2029
- Competitive analysis, industry segmentation, financial benchmarks
- Incorporates SWOT, Porter's Five Forces and risk management frameworks
- PDF report or online database with Word, Excel and PowerPoint export options
- 100% money back guarantee
Panoramica del mercato della fratturazione idraulica
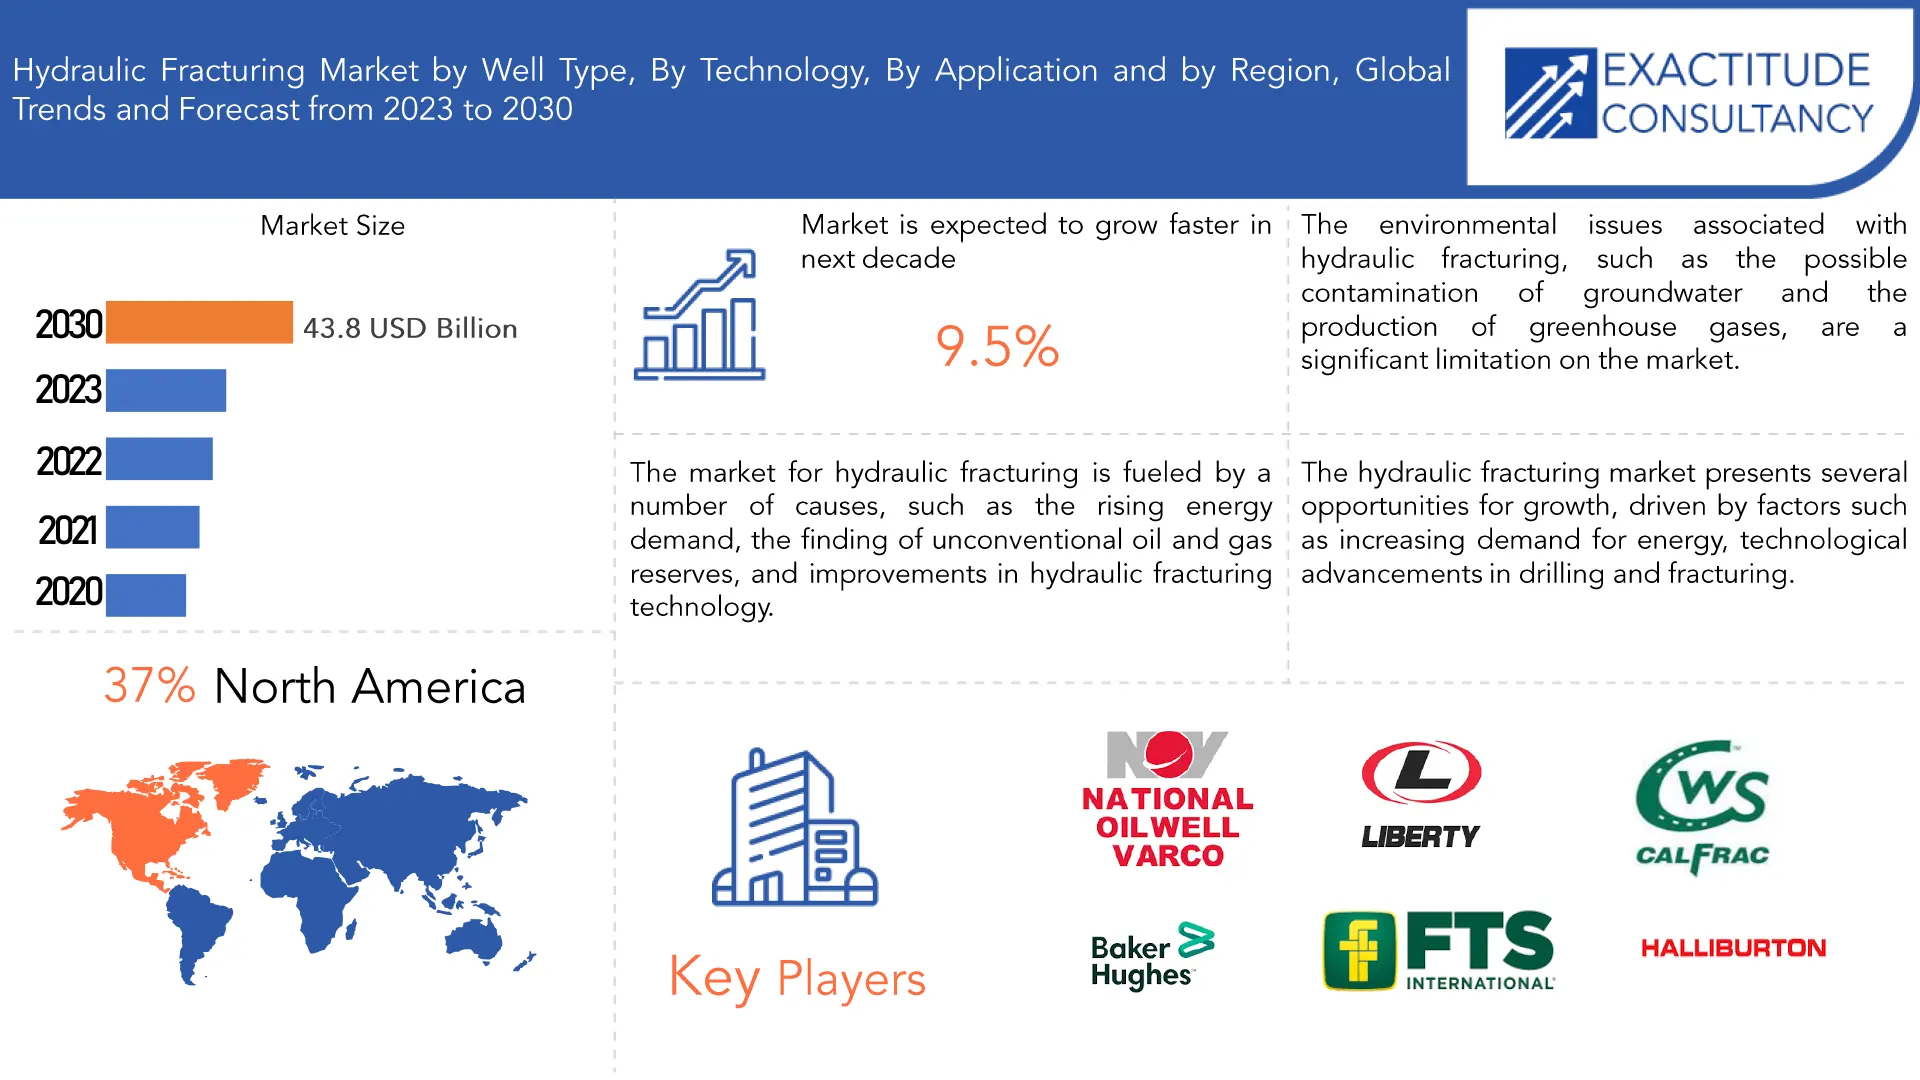
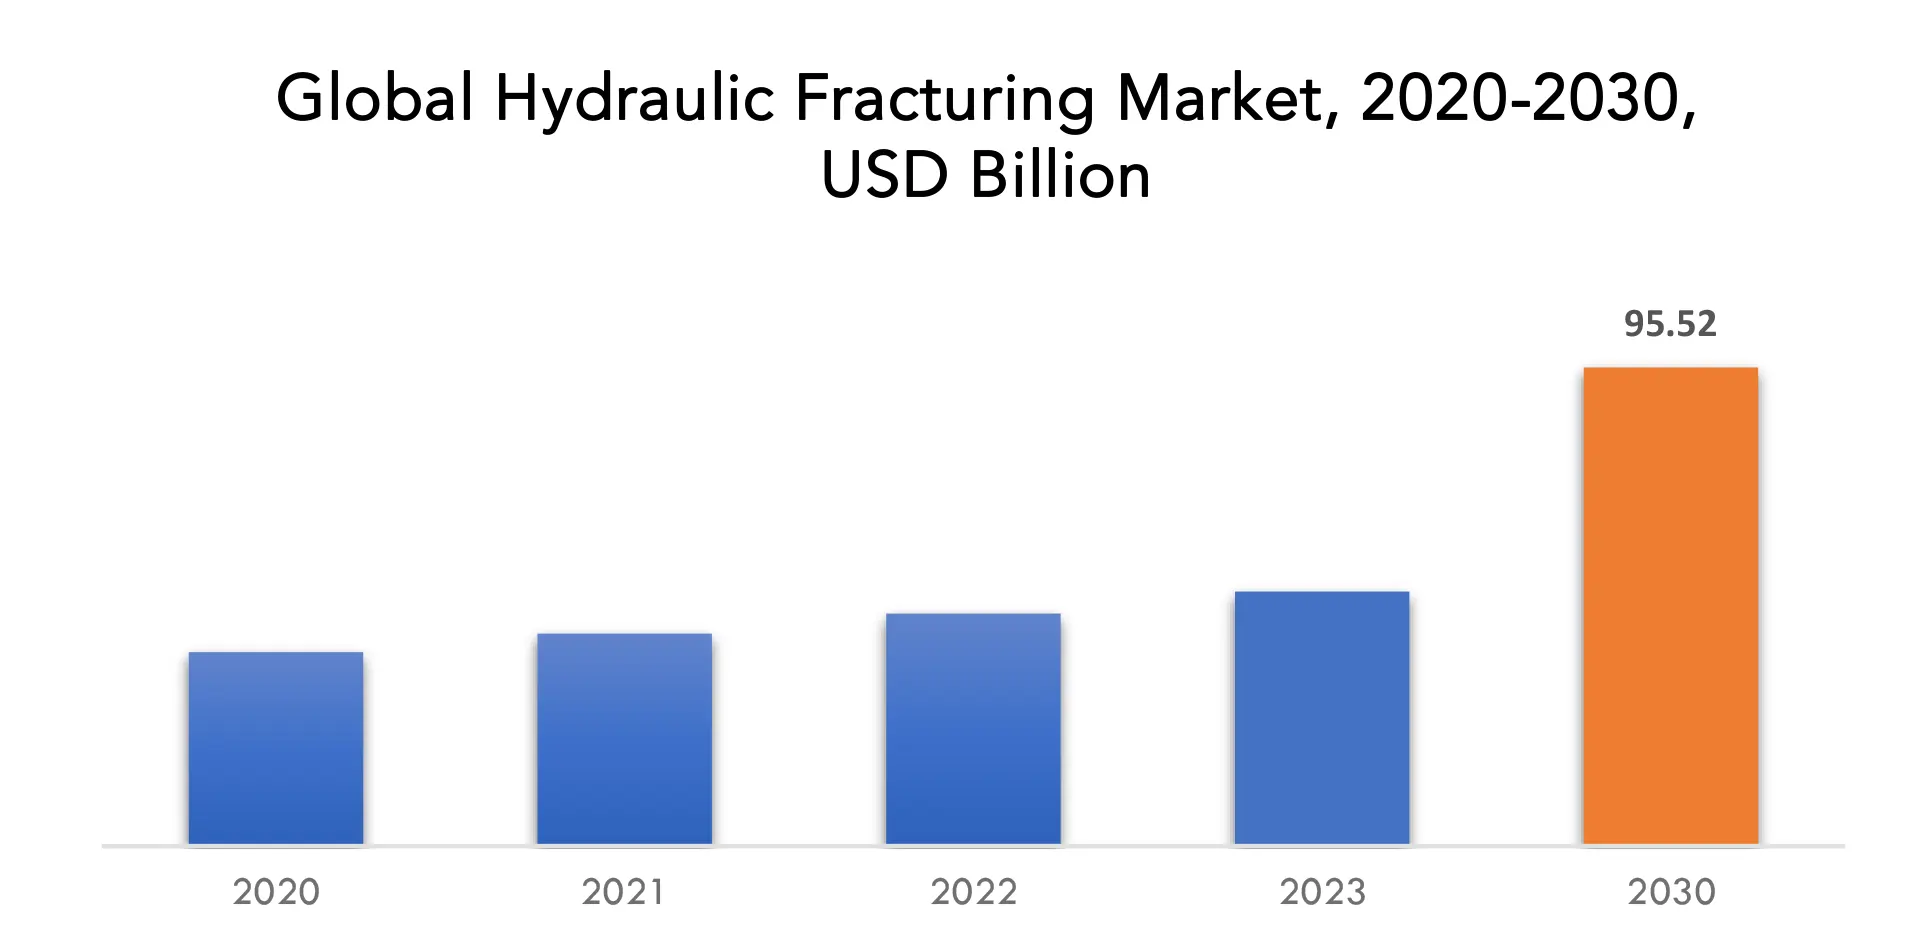
Si prevede che il mercato della fratturazione idraulica crescerà al 9,5% di CAGR dal 2023 al 2030. Si prevede che raggiungerà oltre 95,52 miliardi di USD entro il 2030 dai 50,08 miliardi di USD del 2023. La fratturazione idraulica, comunemente nota come fratturazione idraulica, è un metodo per rimuovere petrolio e gas naturale da formazioni rocciose sotterranee. Per fratturare la roccia, viene perforato un pozzo nella formazione e viene iniettata una soluzione di acqua, sabbia e sostanze chimiche ad alta pressione. Il petrolio o il gas possono fluire più liberamente attraverso queste fessure e nel pozzo, dove possono essere recuperati. Rendendo possibile raggiungere depositi di petrolio e gas che prima erano inaccessibili, la fratturazione idraulica ha cambiato completamente il settore petrolifero e del gas. La procedura è, tuttavia, anche controversa a causa delle preoccupazioni su come potrebbe influire sull'ambiente e sulla salute pubblica. I critici sostengono che la fratturazione idraulica può contaminare le falde acquifere, causare inquinamento atmosferico e rappresentare un rischio per la salute umana a causa delle sostanze chimiche utilizzate. D'altro canto, i sostenitori sostengono che la fratturazione idraulica ha contribuito a ridurre la dipendenza da petrolio e gas stranieri, creando posti di lavoro e stimolando la crescita economica perché è sicura se eseguita correttamente. Il mercato della fratturazione idraulica è alimentato da una serie di cause, come la crescente domanda di energia, la scoperta di riserve di petrolio e gas non convenzionali e i miglioramenti nella tecnologia della fratturazione idraulica. La necessità di energia è in continua crescita a causa della crescita della popolazione e dell'industrializzazione e la fratturazione idraulica è diventata un metodo di successo per ottenere petrolio e gas dalle formazioni rocciose di scisto. [caption id="attachment_30321" align="aligncenter" width="1920"]
| ATTRIBUTO | DETTAGLI |
| Periodo di studio | 2020-2030 |
| Anno base | 2022 |
| Anno stimato | 2023 |
| Anno previsto | 2023-2030 |
| Periodo storico | 2019-2021 |
| Unità | Valore (miliardi di USD) |
| Segmentazione | Per tipo di pozzo, per tecnologia, per applicazione, per regione |
| Per tipo di pozzo |
|
| Per tecnologia |
|
| Per applicazione |
|
| Per regione |
|
Frequently Asked Questions
What is the worth of hydraulic fracturing market?
The hydraulic fracturing market is expected to grow at 9.5% CAGR from 2023 to 2030. It is expected to reach above USD 87.6 billion by 2030 from USD 38.7 billion in 2023.
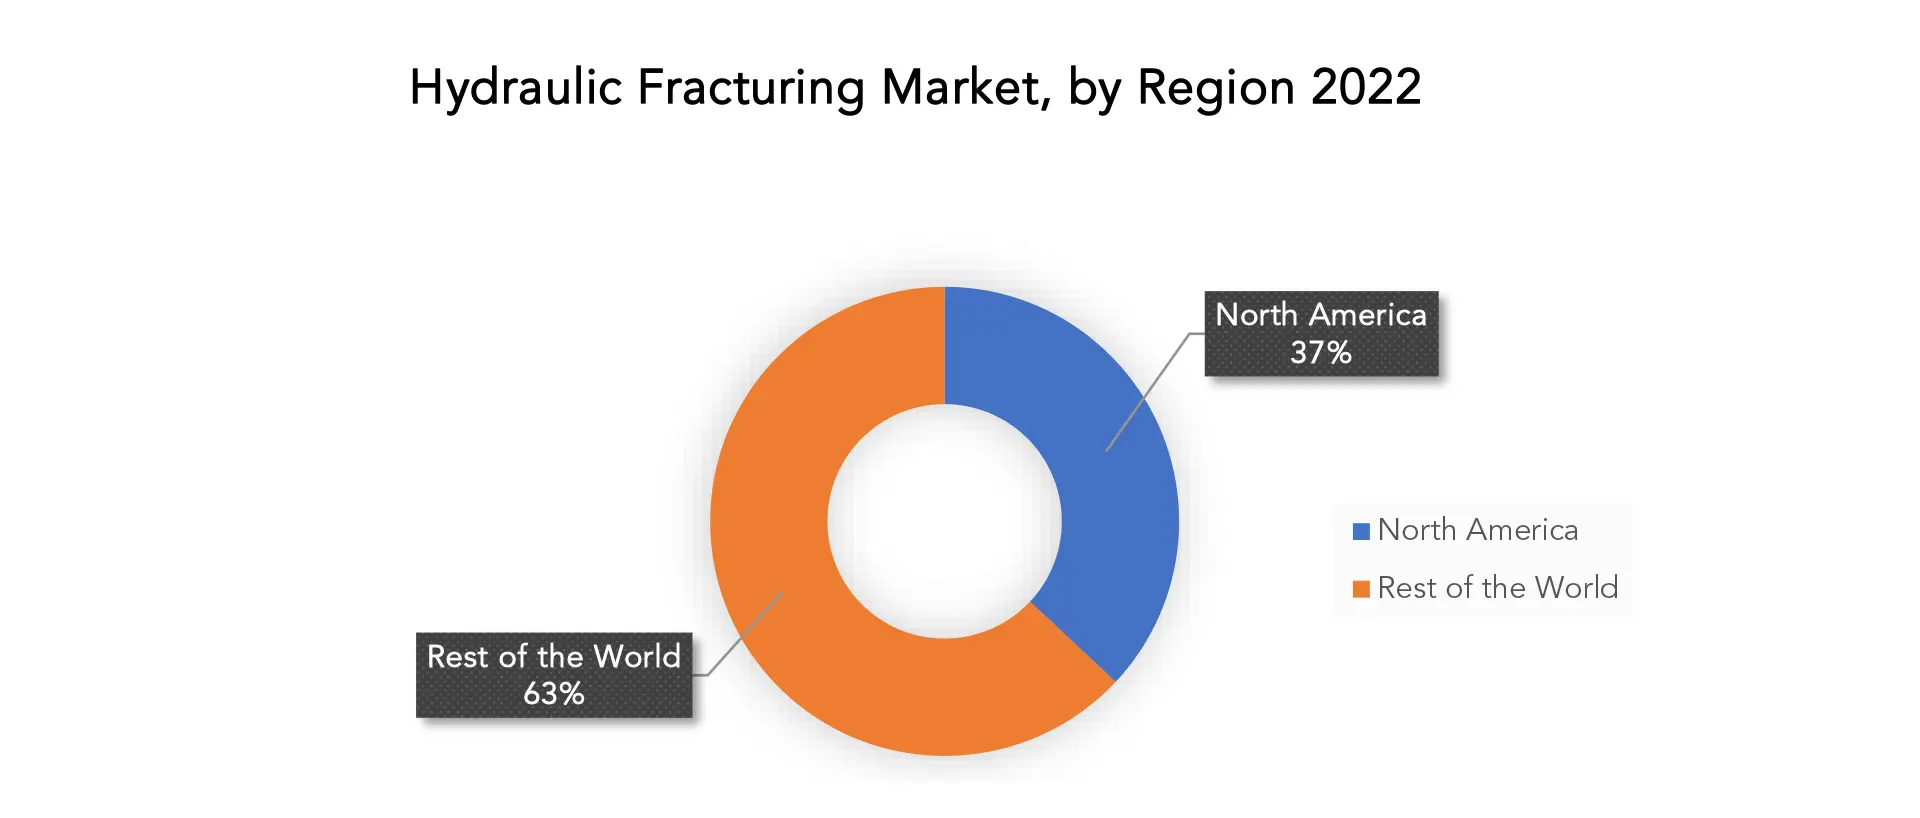
What is the size of the North America hydraulic fracturing industry?
North America held more than 37% of the hydraulic fracturing market revenue share in 2022 and will witness expansion in the forecast period.
What are some of the market's driving forces?
The market for hydraulic fracturing is fueled by a number of causes, such as the rising energy demand, the finding of unconventional oil and gas reserves, and improvements in hydraulic fracturing technology. The need for energy is always growing due to population growth and industrialization, and hydraulic fracturing has become a successful method of obtaining oil and gas from shale rock formations.
Which are the top companies to hold the market share in hydraulic fracturing market?
The articulated robot market key Halliburton, Baker Hughes, National Oilwell Varco, FTS International, Calfrac Well Services, Liberty Oilfield Services, Keane Group, Nabors Industries, RPC Inc, Pioneer Energy Services, Patterson UTI Energy.
What is the leading well type of hydraulic fracturing market?
By well type, the hydraulic fracturing market can be divided into horizontal and vertical wells. Due to their higher production rates, improved oil and gas recovery, and capacity to access more resources, horizontal wells are more frequently used. Vertical wells are frequently employed for projects with reduced costs or shallow formations.
Which is the largest regional market for hydraulic fracturing market?
The North America region dominated the hydraulic fracturing market by accounting for over 37% of the market share. The North American hydraulic fracturing market has been driven by technological advancements in drilling and extraction techniques, coupled with the discovery of vast shale gas reserves.
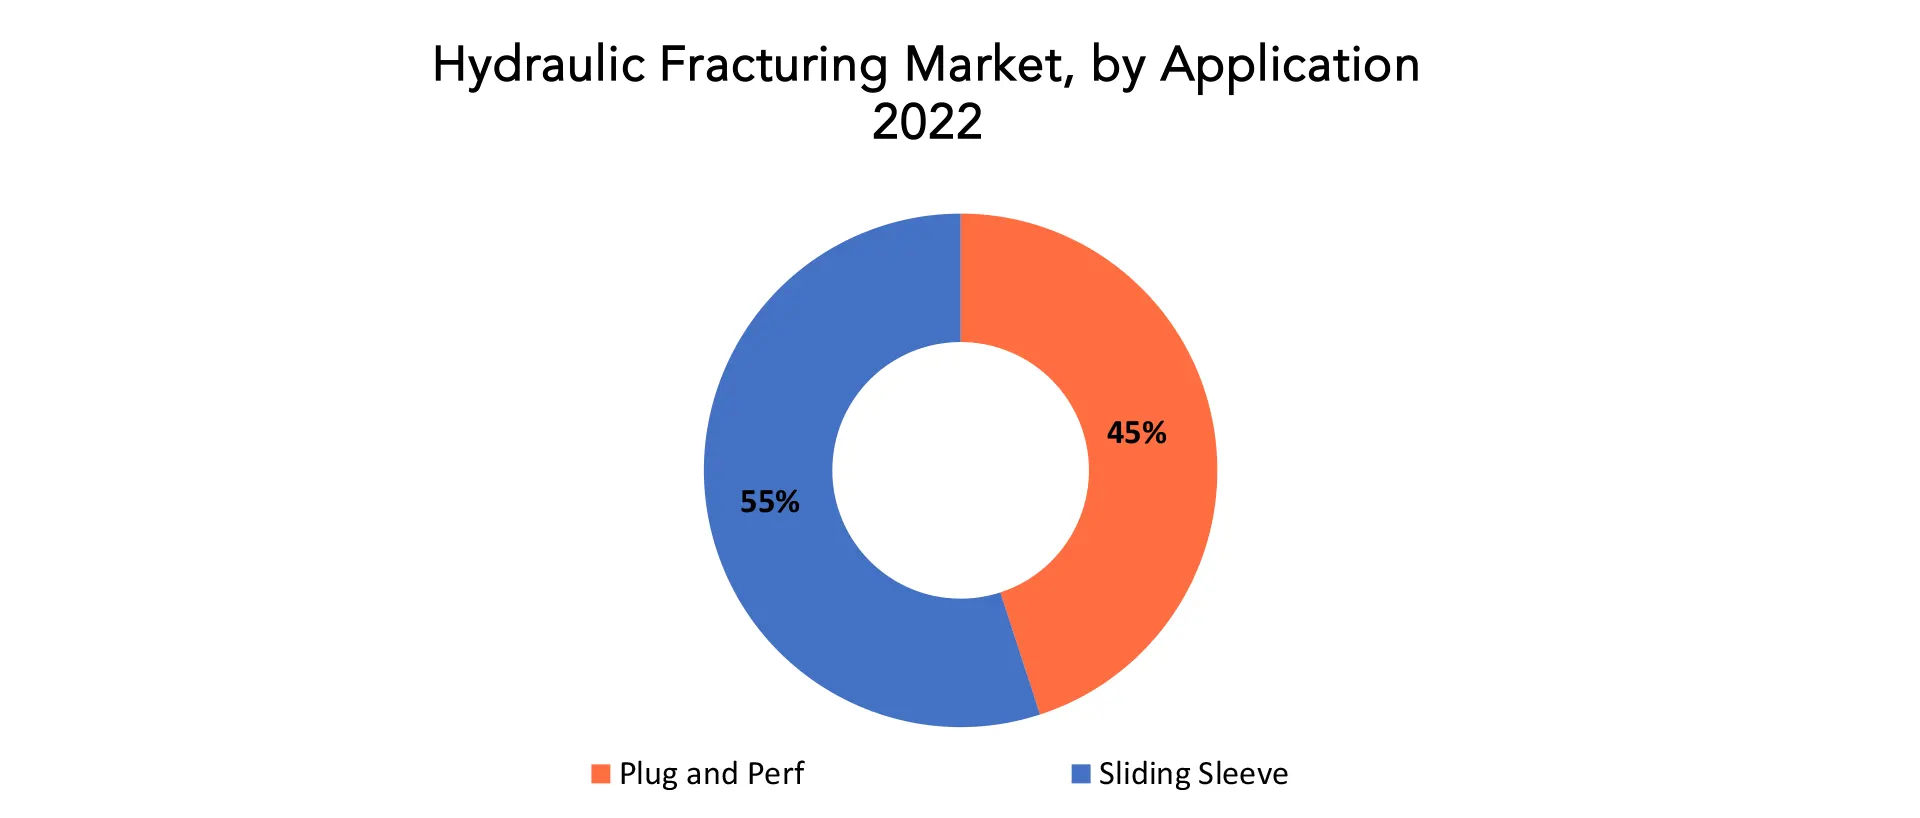
Hydraulic Fracturing Market Segment Analysis
The hydraulic fracturing market is segmented based on well type, technology, application and region. By well type, the hydraulic fracturing market can be divided into horizontal and vertical wells. Due to their higher production rates, improved oil and gas recovery, and capacity to access more resources, horizontal wells are more frequently used. Vertical wells are frequently employed for projects with reduced costs or shallow formations. [caption id="attachment_30342" align="aligncenter" width="1920"]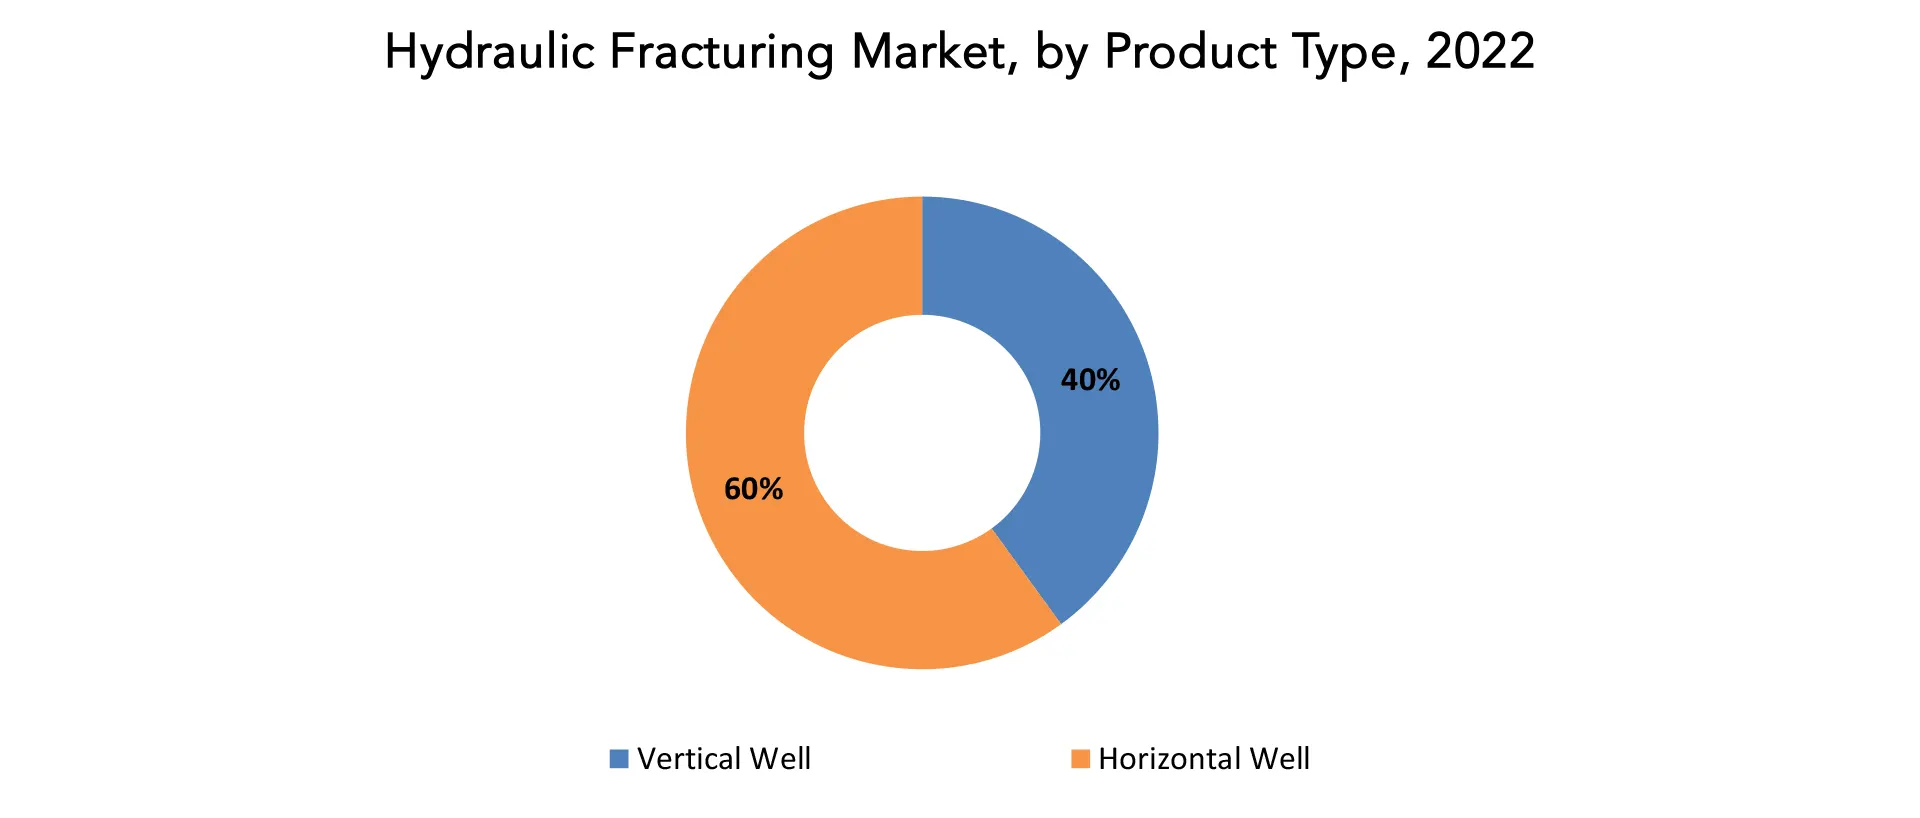
Hydraulic Fracturing Market Players
The articulated robot market key Halliburton, Baker Hughes, National Oilwell Varco, FTS International, Calfrac Well Services, Liberty Oilfield Services, Keane Group, Nabors Industries, RPC Inc, Pioneer Energy Services, Patterson UTI Energy.Recent News:
19-04-2023: - Baker Hughes, an energy technology company, announced on Wednesday that it had been awarded an order to be booked in the first quarter of 2023 by Black & Veatch, a subcontractor to the JGC and Samsung Heavy Industries consortium, to deliver two LM9000-driven compressor trains for the PETRONAS nearshore liquefied natural gas facility in Sabah, Malaysia. 03-04-2023: - The Baker Hughes Foundation announced on Monday that it had awarded a total of $270,000 in grants to nonprofit organizations (NPOs) that promote diversity, equity, and inclusion (DEI). The recipient NPOs were nominated by Baker Hughes global employee resource groups (ERGs), who had joined together based on shared interests, characteristics, or life experiences.Who Should Buy? Or Key stakeholders
- Energy Companies
- Oil and Gas Investors
- Government and drilling Engineers
- Media outlets
- Investors
- Environmental Groups
- Others
Hydraulic Fracturing Market Regional Analysis
The Hydraulic Fracturing market by region includes North America, Asia-Pacific (APAC), Europe, South America, and Middle East & Africa (MEA).- North America: includes the US, Canada, Mexico
- Asia Pacific: includes China, Japan, South Korea, India, Australia, ASEAN and Rest of APAC
- Europe: includes UK, Germany, France, Italy, Spain, Russia, and Rest of Europe
- South America: includes Brazil, Argentina and Rest of South America
- Middle East & Africa: includes Turkey, UAE, Saudi Arabia, South Africa, and Rest of MEA
Key Market Segments: Hydraulic Fracturing Market
Hydraulic Fracturing Market by Well Type, 2020-2030, (USD Billion)- Horizontal Well
- Vertical Well
- Plug and Perf
- Sliding Sleeve
- Shale Gas
- Tight Oil
- Tight Gas
- North America
- Asia Pacific
- Europe
- South America
- Middle East and Africa
Exactitude Consultancy Services Key Objectives:
- Increasing sales and market share
- Developing new technology
- Improving profitability
- Entering new markets
- Enhancing brand reputation
Key Question Answered
- What is the expected growth rate of the hydraulic fracturing market over the next 7 years?
- Who are the major players in the hydraulic fracturing market and what is their market share?
- What are the types of industries driving demand for market and what is their outlook?
- What are the opportunities for growth in emerging markets such as Asia-Pacific, Middle East, And Africa?
- How is the economic environment affecting the hydraulic fracturing market, including factors such as interest rates, inflation, and exchange rates?
- What is the expected impact of government policies and regulations on the hydraulic fracturing market?
- What is the current and forecasted size and growth rate of the global hydraulic fracturing market?
- What are the key drivers of growth in the hydraulic fracturing market?
- Who are the major players in the market and what is their market share?
- What are the distribution channels and supply chain dynamics in the hydraulic fracturing market?
- What are the technological advancements and innovations in the hydraulic fracturing market and their impact on well type development and growth?
- What are the regulatory considerations and their impact on the market?
- What are the challenges faced by players in the hydraulic fracturing market and how are they addressing these challenges?
- What are the opportunities for growth and expansion in the hydraulic fracturing market?
- What are the service offerings and specifications of leading players in the market?
- What is the pricing trend of hydraulic fracturing in the market and what is the impact of raw process prices on the price trend?
- INTRODUZIONE
- DEFINIZIONE DI MERCATO
- SEGMENTAZIONE DEL MERCATO
- TEMPI DI RICERCA
- ASSUNZIONI E LIMITAZIONI
- METODOLOGIA DI RICERCA
- ESTRAZIONE DATI
- RICERCA SECONDARIA
- RICERCA PRIMARIA
- PARERI DEGLI ESPERTI IN MATERIA
- CONTROLLI DI QUALITÀ
- RECENSIONE FINALE
- TRIANGOLAZIONE DEI DATI
- BOTTOM-UP APPROACH
- TOP-DOWN APPROACH
- RESEARCH FLOW
- DATA SOURCES
- ESTRAZIONE DATI
- EXECUTIVE SUMMARY
- MARKET OVERVIEW
- GLOBAL HYDRAULIC FRACTURING OUTLOOK
- MARKET DRIVERS
- MARKET RESTRAINTS
- MARKET OPPORTUNITIES
- IMPACT OF COVID-19 ON HYDRAULIC FRACTURING MARKET
- PORTER’S FIVE FORCES MODEL
- THREAT FROM NEW ENTRANTS
- THREAT FROM SUBSTITUTES
- BARGAINING POWER OF SUPPLIERS
- BARGAINING POWER OF CUSTOMERS
- DEGREE OF COMPETITION
- INDUSTRY VALUE CHAIN ANALYSIS
- GLOBAL HYDRAULIC FRACTURING OUTLOOK
- GLOBAL HYDRAULIC FRACTURING MARKET BY WELL TYPE (USD BILLION) 2020-2029
- HORIONTAL WELL
- VERTICAL WELL
- GLOBAL HYDRAULIC FRACTURING MARKET BY TECHNOLOGY (USD BILLION) 2020-2029
- PLUG AND PERF
- SLIDING SLEEVE
- GLOBAL HYDRAULIC FRACTURING MARKET BY APPLICATION (USD BILLION) 2020-2030
- SHALE GAS
- TIGHT OIL
- TIGHT GAS
- GLOBAL HYDRAULIC FRACTURING MARKET BY REGION (USD BILLION) 2020-2030
- NORTH AMERICA
- US
- CANADA
- MEXICO
- SOUTH AMERICA
- BRAZIL
- ARGENTINA
- COLOMBIA
- REST OF SOUTH AMERICA
- EUROPE
- GERMANY
- UK
- FRANCE
- ITALY
- SPAIN
- RUSSIA
- REST OF EUROPE
- ASIA PACIFIC
- INDIA
- CHINA
- JAPAN
- SOUTH KOREA
- AUSTRALIA
- SOUTH-EAST ASIA
- REST OF ASIA PACIFIC
- MIDDLE EAST AND AFRICA
- UAE
- SAUDI ARABIA
- SOUTH AFRICA
- REST OF MIDDLE EAST AND AFRICA
- NORTH AMERICA
- COMPANY PROFILES*
(BUSINESS OVERVIEW, COMPANY SNAPSHOT, PRODUCTS OFFERED, RECENT DEVELOPMENTS)
- HALLIBURTON
- BAKER HUGHES
- NATIONAL OILWELL VACRO
- FTS INTERNATIONAL
- CALFRAC WELL SERVICES
- LIBERTY OILFIELD SERVICES
- KEANE GROUP
- NABROS INDUSTROES
- RPC INC
- PIONEER ENERGY SERIVECES
- PATTERSON UTI ENERGY
*THE COMPANY LIST IS INDICATIVE
LIST OF TABLES
TABLE 1 GLOBAL HYDRAULIC FRACTURING MARKET BY WELL TYPE (USD BILLION) 2020-2030
TABLE 2 GLOBAL HYDRAULIC FRACTURING MARKET BY APPLICATION (USD BILLION) 2020-2030
TABLE 3 GLOBAL HYDRAULIC FRACTURING MARKET BY TECHNOLOGY (USD BILLION) 2020-2030
TABLE 4 GLOBAL HYDRAULIC FRACTURING MARKET BY REGION (USD BILLION) 2020-2030
TABLE 5 NORTH AMERICA HYDRAULIC FRACTURING MARKET BY COUNTRY (USD BILLION) 2020-2030
TABLE 6 NORTH AMERICA HYDRAULIC FRACTURING MARKET BY WELL TYPE (USD BILLION) 2020-2030
TABLE 7 NORTH AMERICA HYDRAULIC FRACTURING MARKET BY APPLICATION (USD BILLION) 2020-2030
TABLE 8 NORTH AMERICA HYDRAULIC FRACTURING MARKET BY TECHNOLOGY (USD BILLION) 2020-2030
TABLE 9 US HYDRAULIC FRACTURING MARKET BY WELL TYPE (USD BILLION) 2020-2030
TABLE 10 US HYDRAULIC FRACTURING MARKET BY APPLICATION (USD BILLION) 2020-2030
TABLE 11 US HYDRAULIC FRACTURING MARKET BY TECHNOLOGY (USD BILLION) 2020-2030
TABLE 12 CANADA HYDRAULIC FRACTURING MARKET BY WELL TYPE (USD BILLION) 2020-2030
TABLE 13 CANADA HYDRAULIC FRACTURING MARKET BY APPLICATION (USD BILLION) 2020-2030
TABLE 14 CANADA HYDRAULIC FRACTURING MARKET BY TECHNOLOGY (USD BILLION) 2020-2030
TABLE 15 MEXICO HYDRAULIC FRACTURING MARKET BY WELL TYPE (USD BILLION) 2020-2030
TABLE 16 MEXICO HYDRAULIC FRACTURING MARKET BY APPLICATION (USD BILLION) 2020-2030
TABLE 17 MEXICO HYDRAULIC FRACTURING MARKET BY TECHNOLOGY (USD BILLION) 2020-2030
TABLE 18 SOUTH AMERICA HYDRAULIC FRACTURING MARKET BY COUNTRY (USD BILLION) 2020-2030
TABLE 19 SOUTH AMERICA HYDRAULIC FRACTURING MARKET BY WELL TYPE (USD BILLION) 2020-2030
TABLE 20 SOUTH AMERICA HYDRAULIC FRACTURING MARKET BY APPLICATION (USD BILLION) 2020-2030
TABLE 21 SOUTH AMERICA HYDRAULIC FRACTURING MARKET BY TECHNOLOGY (USD BILLION) 2020-2030
TABLE 22 BRAZIL HYDRAULIC FRACTURING MARKET BY WELL TYPE (USD BILLION) 2020-2030
TABLE 23 BRAZIL HYDRAULIC FRACTURING MARKET BY APPLICATION (USD BILLION) 2020-2030
TABLE 24 BRAZIL HYDRAULIC FRACTURING MARKET BY TECHNOLOGY (USD BILLION) 2020-2030
TABLE 25 ARGENTINA HYDRAULIC FRACTURING MARKET BY WELL TYPE (USD BILLION) 2020-2030
TABLE 26 ARGENTINA HYDRAULIC FRACTURING MARKET BY APPLICATION (USD BILLION) 2020-2030
TABLE 27 ARGENTINA HYDRAULIC FRACTURING MARKET BY TECHNOLOGY (USD BILLION) 2020-2030
TABLE 28 COLOMBIA HYDRAULIC FRACTURING MARKET BY WELL TYPE (USD BILLION) 2020-2030
TABLE 29 COLOMBIA HYDRAULIC FRACTURING MARKET BY APPLICATION (USD BILLION) 2020-2030
TABLE 30 COLOMBIA HYDRAULIC FRACTURING MARKET BY TECHNOLOGY (USD BILLION) 2020-2030
TABLE 31 REST OF SOUTH AMERICA HYDRAULIC FRACTURING MARKET BY WELL TYPE (USD BILLION) 2020-2030
TABLE 32 REST OF SOUTH AMERICA HYDRAULIC FRACTURING MARKET BY APPLICATION (USD BILLION) 2020-2030
TABLE 33 REST OF SOUTH AMERICA HYDRAULIC FRACTURING MARKET BY TECHNOLOGY (USD BILLION) 2020-2030
TABLE 34 ASIA-PACIFIC HYDRAULIC FRACTURING MARKET BY COUNTRY (USD BILLION) 2020-2030
TABLE 35 ASIA-PACIFIC HYDRAULIC FRACTURING MARKET BY WELL TYPE (USD BILLION) 2020-2030
TABLE 36 ASIA-PACIFIC HYDRAULIC FRACTURING MARKET BY APPLICATION (USD BILLION) 2020-2030
TABLE 37 ASIA-PACIFIC HYDRAULIC FRACTURING MARKET BY TECHNOLOGY (USD BILLION) 2020-2030
TABLE 38 INDIA HYDRAULIC FRACTURING MARKET BY WELL TYPE (USD BILLION) 2020-2030
TABLE 39 INDIA HYDRAULIC FRACTURING MARKET BY APPLICATION (USD BILLION) 2020-2030
TABLE 40 INDIA HYDRAULIC FRACTURING MARKET BY TECHNOLOGY (USD BILLION) 2020-2030
TABLE 41 CHINA HYDRAULIC FRACTURING MARKET BY WELL TYPE (USD BILLION) 2020-2030
TABLE 42 CHINA HYDRAULIC FRACTURING MARKET BY APPLICATION (USD BILLION) 2020-2030
TABLE 43 CHINA HYDRAULIC FRACTURING MARKET BY TECHNOLOGY (USD BILLION) 2020-2030
TABLE 44 JAPAN HYDRAULIC FRACTURING MARKET BY WELL TYPE (USD BILLION) 2020-2030
TABLE 45 JAPAN HYDRAULIC FRACTURING MARKET BY APPLICATION (USD BILLION) 2020-2030
TABLE 46 JAPAN HYDRAULIC FRACTURING MARKET BY TECHNOLOGY (USD BILLION) 2020-2030
TABLE 47 SOUTH KOREA HYDRAULIC FRACTURING MARKET BY WELL TYPE (USD BILLION) 2020-2030
TABLE 48 SOUTH KOREA HYDRAULIC FRACTURING MARKET BY APPLICATION (USD BILLION) 2020-2030
TABLE 49 SOUTH KOREA HYDRAULIC FRACTURING MARKET BY TECHNOLOGY (USD BILLION) 2020-2030
TABLE 50 AUSTRALIA HYDRAULIC FRACTURING MARKET BY WELL TYPE (USD BILLION) 2020-2030
TABLE 51 AUSTRALIA HYDRAULIC FRACTURING MARKET BY APPLICATION (USD BILLION) 2020-2030
TABLE 52 AUSTRALIA HYDRAULIC FRACTURING MARKET BY TECHNOLOGY (USD BILLION) 2020-2030
TABLE 53 SOUTH-EAST ASIA HYDRAULIC FRACTURING MARKET BY WELL TYPE (USD BILLION) 2020-2030
TABLE 54 SOUTH-EAST ASIA HYDRAULIC FRACTURING MARKET BY APPLICATION (USD BILLION) 2020-2030
TABLE 55 SOUTH-EAST ASIA HYDRAULIC FRACTURING MARKET BY TECHNOLOGY (USD BILLION) 2020-2030
TABLE 56 REST OF ASIA PACIFIC HYDRAULIC FRACTURING MARKET BY WELL TYPE (USD BILLION) 2020-2030
TABLE 57 REST OF ASIA PACIFIC HYDRAULIC FRACTURING MARKET BY APPLICATION (USD BILLION) 2020-2030
TABLE 58 REST OF ASIA PACIFIC HYDRAULIC FRACTURING MARKET BY TECHNOLOGY (USD BILLION) 2020-2030
TABLE 59 EUROPE HYDRAULIC FRACTURING MARKET BY COUNTRY (USD BILLION) 2020-2030
TABLE 60 EUROPE HYDRAULIC FRACTURING MARKET BY WELL TYPE (USD BILLION) 2020-2030
TABLE 61 EUROPE HYDRAULIC FRACTURING MARKET BY APPLICATION (USD BILLION) 2020-2030
TABLE 62 EUROPE HYDRAULIC FRACTURING MARKET BY TECHNOLOGY (USD BILLION) 2020-2030
TABLE 63 GERMANY HYDRAULIC FRACTURING MARKET BY WELL TYPE (USD BILLION) 2020-2030
TABLE 64 GERMANY HYDRAULIC FRACTURING MARKET BY APPLICATION (USD BILLION) 2020-2030
TABLE 65 GERMANY HYDRAULIC FRACTURING MARKET BY TECHNOLOGY (USD BILLION) 2020-2030
TABLE 66 UK HYDRAULIC FRACTURING MARKET BY WELL TYPE (USD BILLION) 2020-2030
TABLE 67 UK HYDRAULIC FRACTURING MARKET BY APPLICATION (USD BILLION) 2020-2030
TABLE 68 UK HYDRAULIC FRACTURING MARKET BY TECHNOLOGY (USD BILLION) 2020-2030
TABLE 69 FRANCE HYDRAULIC FRACTURING MARKET BY WELL TYPE (USD BILLION) 2020-2030
TABLE 70 FRANCE HYDRAULIC FRACTURING MARKET BY APPLICATION (USD BILLION) 2020-2030
TABLE 71 FRANCE HYDRAULIC FRACTURING MARKET BY TECHNOLOGY (USD BILLION) 2020-2030
TABLE 72 ITALY HYDRAULIC FRACTURING MARKET BY WELL TYPE (USD BILLION) 2020-2030
TABLE 73 ITALY HYDRAULIC FRACTURING MARKET BY APPLICATION (USD BILLION) 2020-2030
TABLE 74 ITALY HYDRAULIC FRACTURING MARKET BY TECHNOLOGY (USD BILLION) 2020-2030
TABLE 75 SPAIN HYDRAULIC FRACTURING MARKET BY WELL TYPE (USD BILLION) 2020-2030
TABLE 76 SPAIN HYDRAULIC FRACTURING MARKET BY APPLICATION (USD BILLION) 2020-2030
TABLE 77 SPAIN HYDRAULIC FRACTURING MARKET BY TECHNOLOGY (USD BILLION) 2020-2030
TABLE 78 RUSSIA HYDRAULIC FRACTURING MARKET BY WELL TYPE (USD BILLION) 2020-2030
TABLE 79 RUSSIA HYDRAULIC FRACTURING MARKET BY APPLICATION (USD BILLION) 2020-2030
TABLE 80 RUSSIA HYDRAULIC FRACTURING MARKET BY TECHNOLOGY (USD BILLION) 2020-2030
TABLE 81 REST OF EUROPE HYDRAULIC FRACTURING MARKET BY WELL TYPE (USD BILLION) 2020-2030
TABLE 82 REST OF EUROPE HYDRAULIC FRACTURING MARKET BY APPLICATION (USD BILLION) 2020-2030
TABLE 83 REST OF EUROPE HYDRAULIC FRACTURING MARKET BY TECHNOLOGY (USD BILLION) 2020-2030
TABLE 84 MIDDLE EAST AND AFRICA HYDRAULIC FRACTURING MARKET BY COUNTRY (USD BILLION) 2020-2030
TABLE 85 MIDDLE EAST AND AFRICA HYDRAULIC FRACTURING MARKET BY WELL TYPE (USD BILLION) 2020-2030
TABLE 86 MIDDLE EAST AND AFRICA HYDRAULIC FRACTURING MARKET BY APPLICATION (USD BILLION) 2020-2030
TABLE 87 MIDDLE EAST AND AFRICA HYDRAULIC FRACTURING MARKET BY TECHNOLOGY (USD BILLION) 2020-2030
TABLE 88 UAE HYDRAULIC FRACTURING MARKET BY WELL TYPE (USD BILLION) 2020-2030
TABLE 89 UAE HYDRAULIC FRACTURING MARKET BY APPLICATION (USD BILLION) 2020-2030
TABLE 90 UAE HYDRAULIC FRACTURING MARKET BY TECHNOLOGY (USD BILLION) 2020-2030
TABLE 91 SAUDI ARABIA HYDRAULIC FRACTURING MARKET BY WELL TYPE (USD BILLION) 2020-2030
TABLE 92 SAUDI ARABIA HYDRAULIC FRACTURING MARKET BY APPLICATION (USD BILLION) 2020-2030
TABLE 93 SAUDI ARABIA HYDRAULIC FRACTURING MARKET BY TECHNOLOGY (USD BILLION) 2020-2030
TABLE 94 SOUTH AFRICA HYDRAULIC FRACTURING MARKET BY WELL TYPE (USD BILLION) 2020-2030
TABLE 95 SOUTH AFRICA HYDRAULIC FRACTURING MARKET BY APPLICATION (USD BILLION) 2020-2030
TABLE 96 SOUTH AFRICA HYDRAULIC FRACTURING MARKET BY TECHNOLOGY (USD BILLION) 2020-2030
TABLE 97 REST OF MIDDLE EAST AND AFRICA HYDRAULIC FRACTURING MARKET BY WELL TYPE (USD BILLION) 2020-2030
TABLE 98 REST OF MIDDLE EAST AND AFRICA HYDRAULIC FRACTURING MARKET BY APPLICATION (USD BILLION) 2020-2030
TABLE 99 REST OF MIDDLE EAST AND AFRICA HYDRAULIC FRACTURING MARKET BY TECHNOLOGY (USD BILLION) 2020-2030
LIST OF FIGURES
FIGURE 1 MARKET DYNAMICS
FIGURE 2 MARKET SEGMENTATION
FIGURE 3 REPORT TIMELINES: YEARS CONSIDERED
FIGURE 4 DATA TRIANGULATION
FIGURE 5 BOTTOM-UP APPROACH
FIGURE 6 TOP-DOWN APPROACH
FIGURE 7 RESEARCH FLOW
FIGURE 8 GLOBAL HYDRAULIC FRACTURING MARKET BY WELL TYPE, USD BILLION, 2020-2030
FIGURE 9 GLOBAL HYDRAULIC FRACTURING MARKET BY TECHNOLOGY, USD BILLION, 2020-2030
FIGURE 10 GLOBAL HYDRAULIC FRACTURING MARKET BY APPLICATION, USD BILLION, 2020-2030
FIGURE 11 GLOBAL HYDRAULIC FRACTURING MARKET BY REGION, USD BILLION, 2020-2030
FIGURE 12 GLOBAL HYDRAULIC FRACTURING MARKET BY WELL TYPE, USD BILLION, 2022
FIGURE 13 GLOBAL HYDRAULIC FRACTURING MARKET BY TECHNOLOGY, USD BILLION, 2022
FIGURE 14 GLOBAL HYDRAULIC FRACTURING MARKET BY APPLICATION, USD BILLION, 2022
FIGURE 15 GLOBAL HYDRAULIC FRACTURING MARKET BY REGION, USD BILLION, 2022
FIGURE 16 PORTER’S FIVE FORCES MODEL
FIGURE 17 MARKET SHARE ANALYSIS
FIGURE 18 HALLIBURTON: COMPANY SNAPSHOT
FIGURE 19 BAKER HUGHES: COMPANY SNAPSHOT
FIGURE 20 NATIONAL OILWELL VARCO: COMPANY SNAPSHOT
FIGURE 21 FTS INTERNATIONAL: COMPANY SNAPSHOT
FIGURE 22 CALFRAC WELL SERVICES: COMPANY SNAPSHOT
FIGURE 23 LIBERTY OILFIELD SERVICES: COMPANY SNAPSHOT
FIGURE 24 KEANE GORUP: COMPANY SNAPSHOT
FIGURE 25 NABROS INDUSTRIES: COMPANY SNAPSHOT
FIGURE 26 RPC INC: COMPANY SNAPSHOT
FIGURE 27 PIONEER ENERGY SERVICES: COMPANY SNAPSHOT
FIGURE 28 PATTERSON UTI ENERGY: COMPANY SNAPSHOT
DOWNLOAD FREE SAMPLE REPORT
License Type
SPEAK WITH OUR ANALYST
Want to know more about the report or any specific requirement?
WANT TO CUSTOMIZE THE REPORT?
Our Clients Speak
We asked them to research ‘ Equipment market’ all over the world, and their whole arrangement was helpful to us. thehealthanalytics.com insightful analysis and reports contributed to our current analysis and in creating a future strategy. Besides, the te
Yosuke Mitsui
Senior Associate Construction Equipment Sales & Marketing
We asked them to research ‘Equipment market’ all over the world, and their whole arrangement was helpful to us. thehealthanalytics.com insightful analysis and reports contributed to our current analysis and in creating a future strategy. Besides, the te


