

Base Year Value ()
x.x %
x.x %
CAGR ()
x.x %
x.x %
Forecast Year Value ()
x.x %
x.x %
Historical Data Period
Largest Region
Forecast Period
Mercato dell'acido ialuronico marino per fonte (pesce, alghe, molluschi) per tipo (cosmetici e cura della persona, integratori alimentari) e regione, tendenze globali e previsioni dal 2023 al 2030
Instant access to hundreds of data points and trends
- Market estimates from 2014-2029
- Competitive analysis, industry segmentation, financial benchmarks
- Incorporates SWOT, Porter's Five Forces and risk management frameworks
- PDF report or online database with Word, Excel and PowerPoint export options
- 100% money back guarantee
Panoramica del mercato dell'acido ialuronico marino
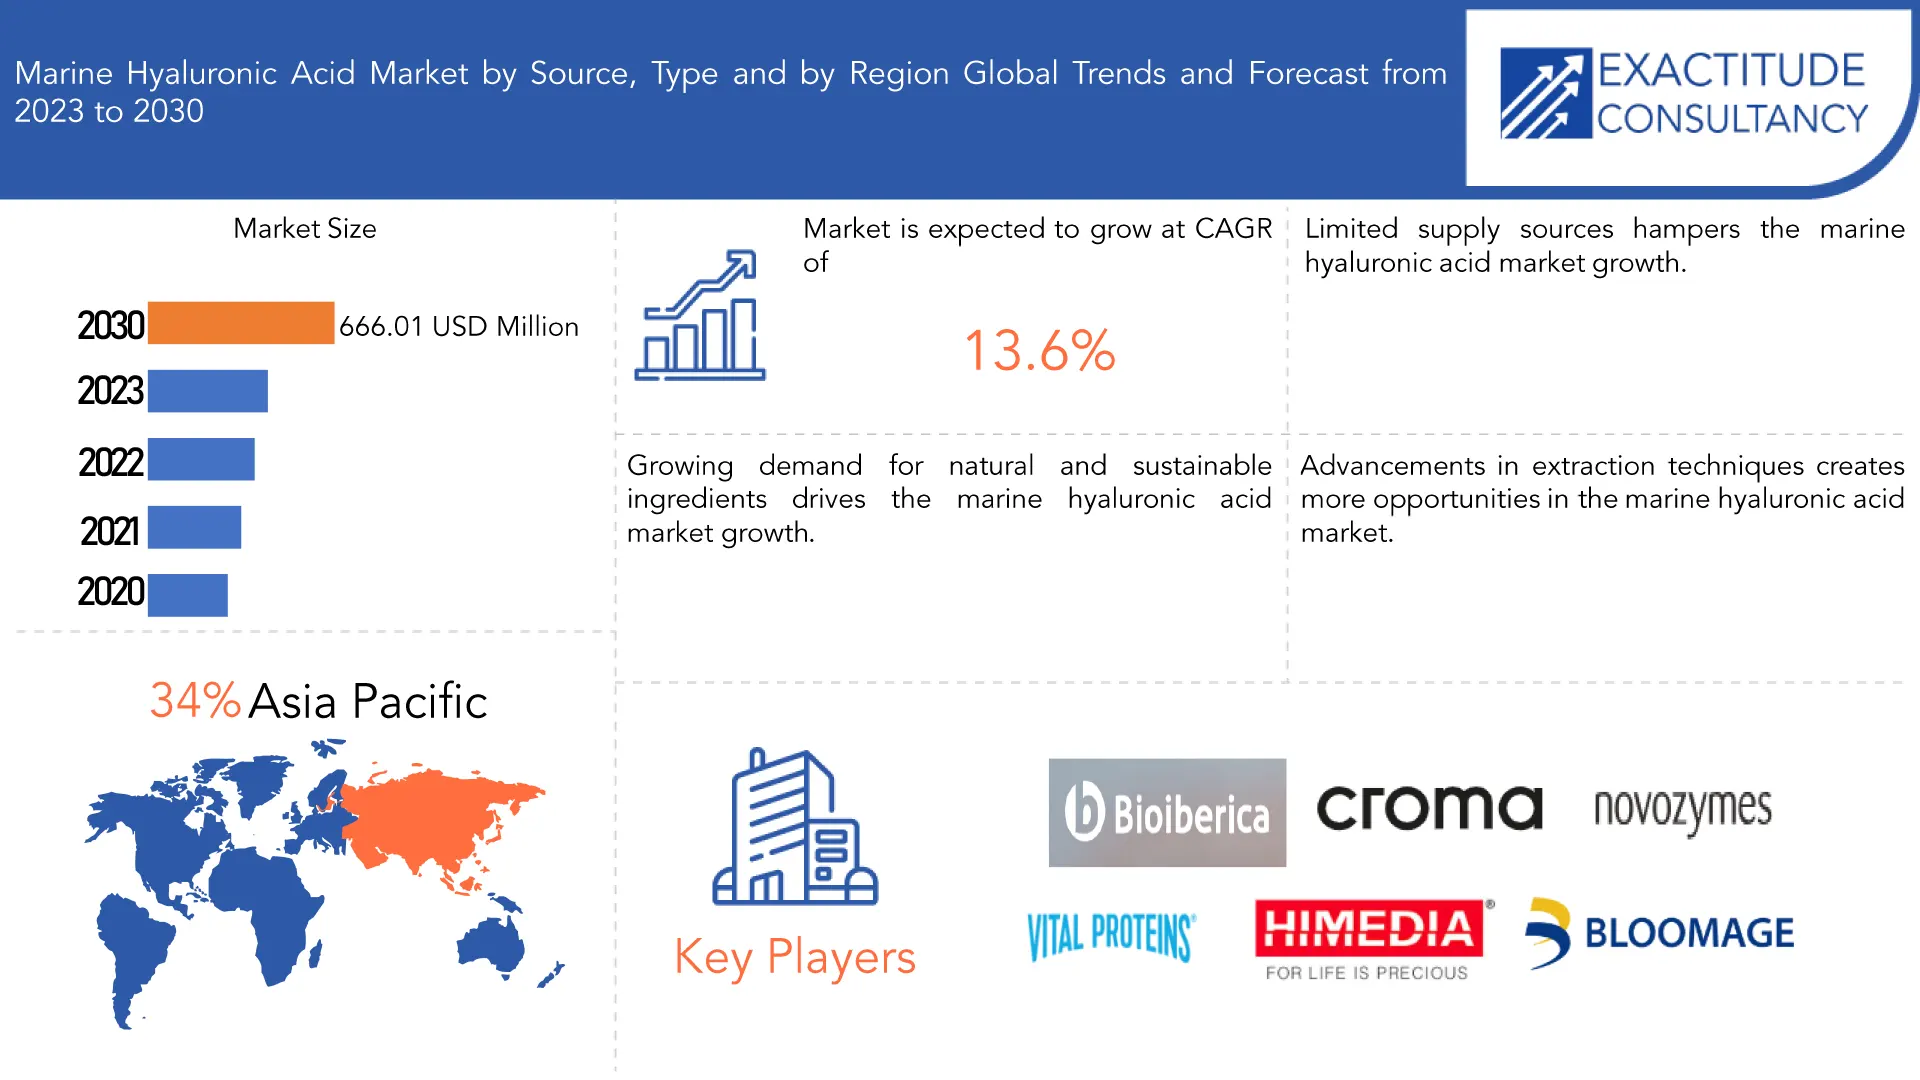
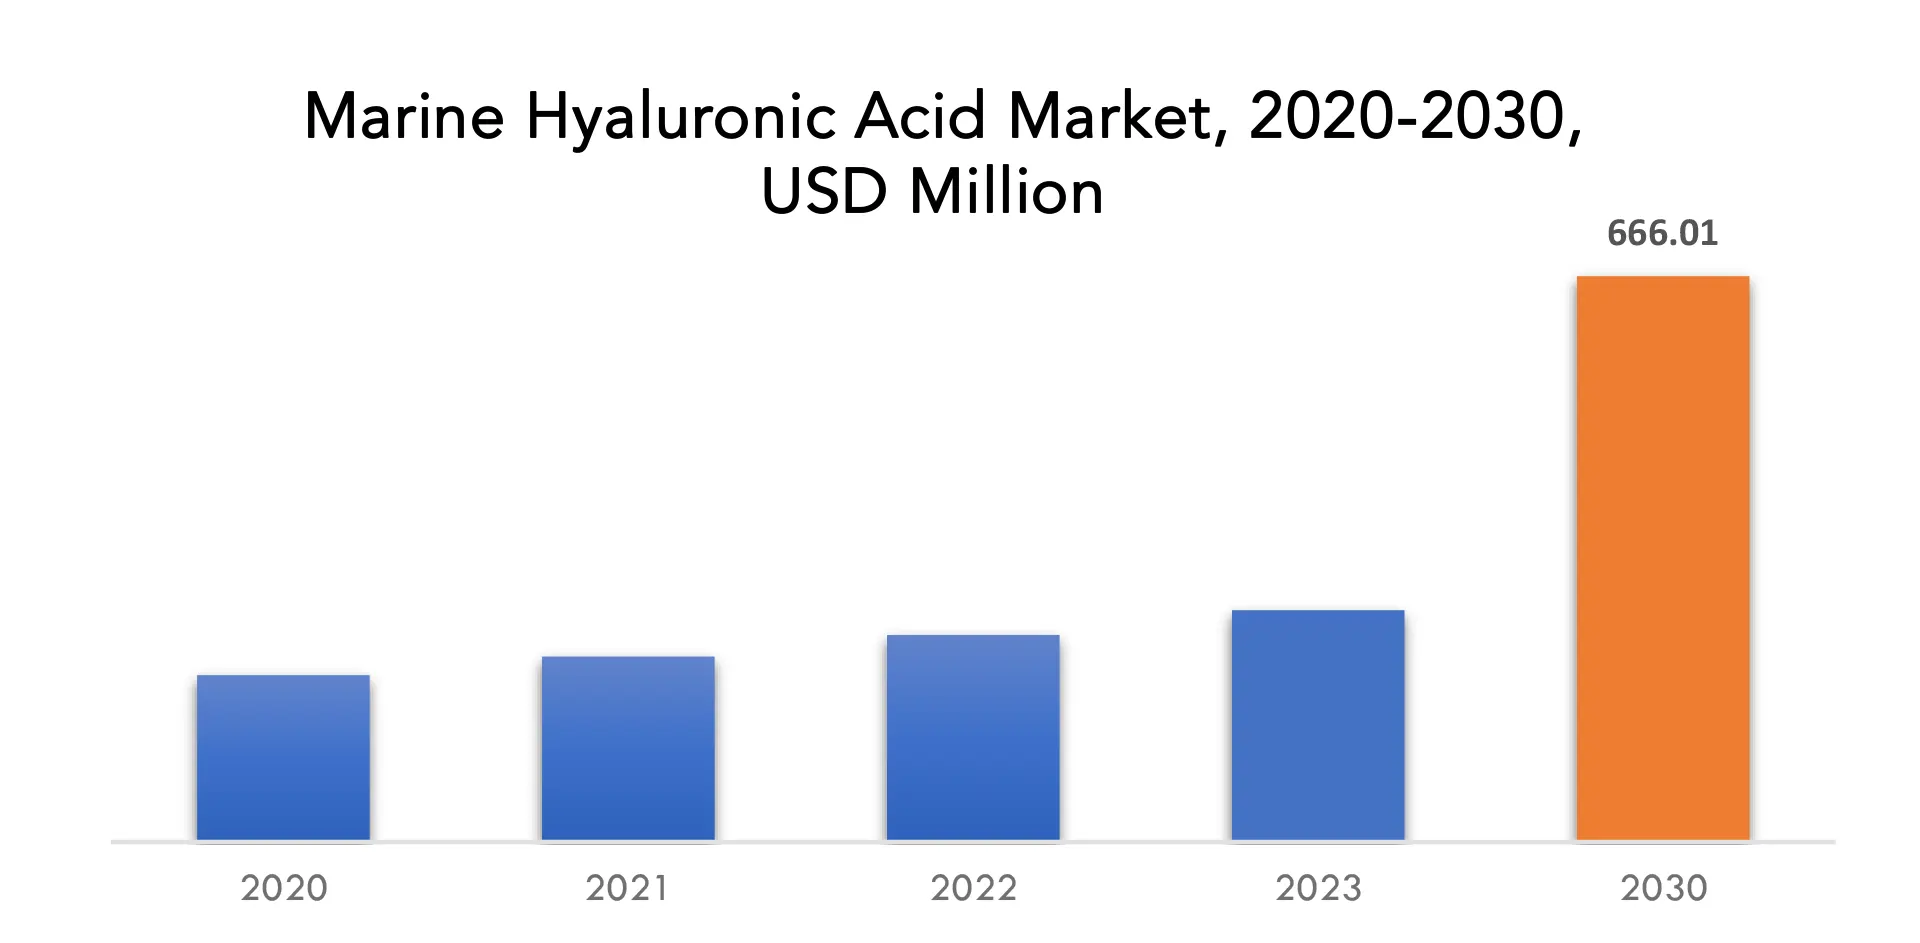
Si prevede che il mercato globale dell'acido ialuronico marino crescerà da 272,84 milioni di USD nel 2023 a 666,01 milioni di USD entro il 2030, con un CAGR del 13,6% durante il periodo di previsione.
L'acido ialuronico marino è un tipo di acido ialuronico (HA) derivato da fonti marine, principalmente da microrganismi e alghe presenti nell'oceano. L'acido ialuronico è una sostanza naturale presente nel corpo umano, in particolare nella pelle, nei tessuti connettivi e negli occhi. È noto per la sua capacità di trattenere l'idratazione, che aiuta a mantenere la pelle idratata e rimpolpata. La straordinaria capacità dell'acido ialuronico di trattenere l'idratazione. Può contenere 1.000 volte più acqua. È un ingrediente eccellente per i prodotti per la cura della pelle perché aiuta a rimpolpare e idratare la pelle, il che riduce al minimo la comparsa di linee sottili e rughe. L'uso regolare di prodotti contenenti acido ialuronico marino può portare a una pelle più liscia e morbida. Quando la pelle è ben idratata, è meno probabile che mostri segni di secchezza, desquamazione e ruvidità. L'acido ialuronico migliora l'elasticità e la flessibilità della pelle. La pelle può apparire e sentirsi più tesa, soprattutto quando invecchia e perde il suo naturale contenuto di idratazione. L'acido ialuronico marino è spesso considerato più ecologico e sostenibile rispetto ad altre fonti di acido ialuronico, poiché può essere raccolto dalle piante marine senza danneggiare la vita animale o gli ecosistemi. [caption id="attachment_32594" align="aligncenter" width="1174"]
| ATTRIBUTO | DETTAGLI |
| Periodo di studio | 2020-2030 |
| Anno base | 2022 |
| Anno stimato | 2023 |
| Anno previsto | 2023-2030 |
| Periodo storico | 2019-2021 |
| Unità | Valore (milioni di USD), (chilotoni) |
| Segmentazione | Per fonte, per tipo e regione |
| Per fonte |
|
| Per tipo |
|
| Per regione |
|
Frequently Asked Questions
• What is the market size for the Marine Hyaluronic Acid market?
The global marine hyaluronic acid market is anticipated to grow from USD 272.84 Million in 2023 to USD 666.01 Million by 2030, at a CAGR of 13.6 % during the forecast period.
• Which region is dominating in the Marine Hyaluronic Acid market?
Asia Pacific accounted for the largest market in the marine hyaluronic acid market. Asia-Pacific accounted for 38 % market share of the global market value.
• Who are the major key players in the Marine Hyaluronic Acid market?
Bloomage Biotechnology Corporation Limited, Novozymes, Croma-Pharma, HiMedia Laboratories, Bioibérica S.A., Vital Proteins LLC, Scope Fluidics S.A., LifeinForce Biotech, Shandong Runke Chemical Co., Ltd..
• What are the key trends in the Marine Hyaluronic Acid market?
There was a significant increase in consumer demand for natural and sustainable skincare and cosmetic products. Marine hyaluronic acid, sourced from algae and other marine microorganisms, was considered a more sustainable and eco-friendly alternative to traditional sources. The clean beauty trend, which emphasizes products with transparent and natural ingredient lists, was influencing the marine hyaluronic acid market. Brands were formulating products with cleaner and more environmentally conscious ingredients.
Marine Hyaluronic Acid Market Segmentation Analysis
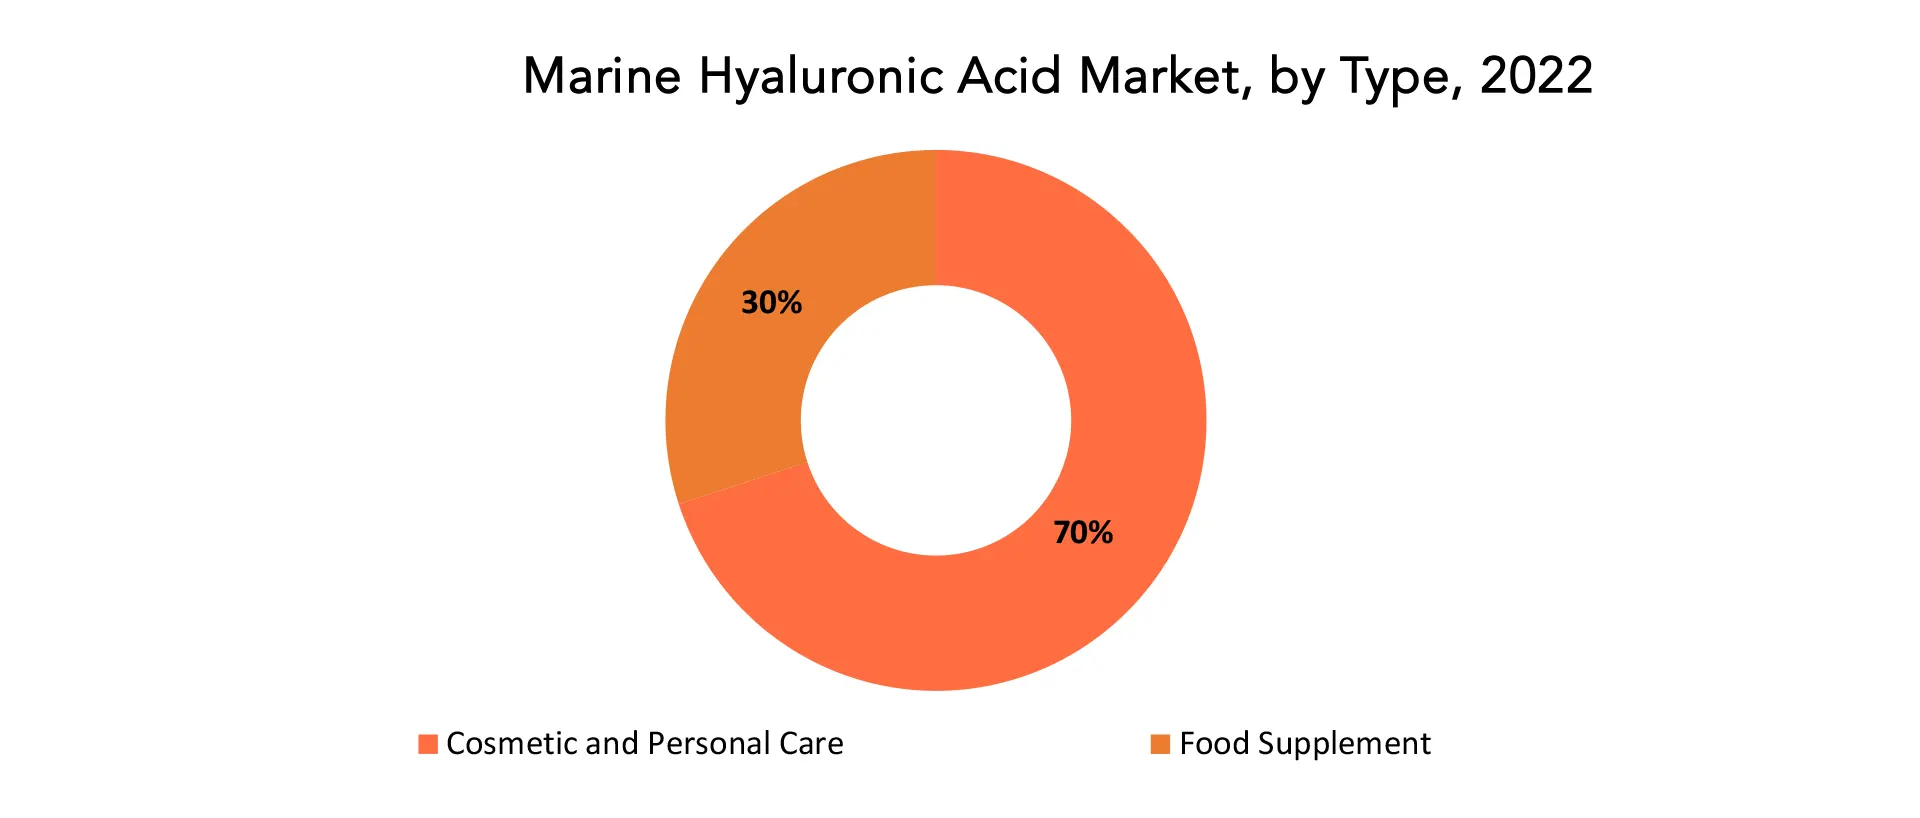
The global marine hyaluronic acid market is divided into 3 segments Source, type and region. by source the market is bifurcated into Fish, Algae, Mollusks. By type the market is bifurcated into Cosmetic and Personal Care, Food Supplement. [caption id="attachment_32621" align="aligncenter" width="1920"]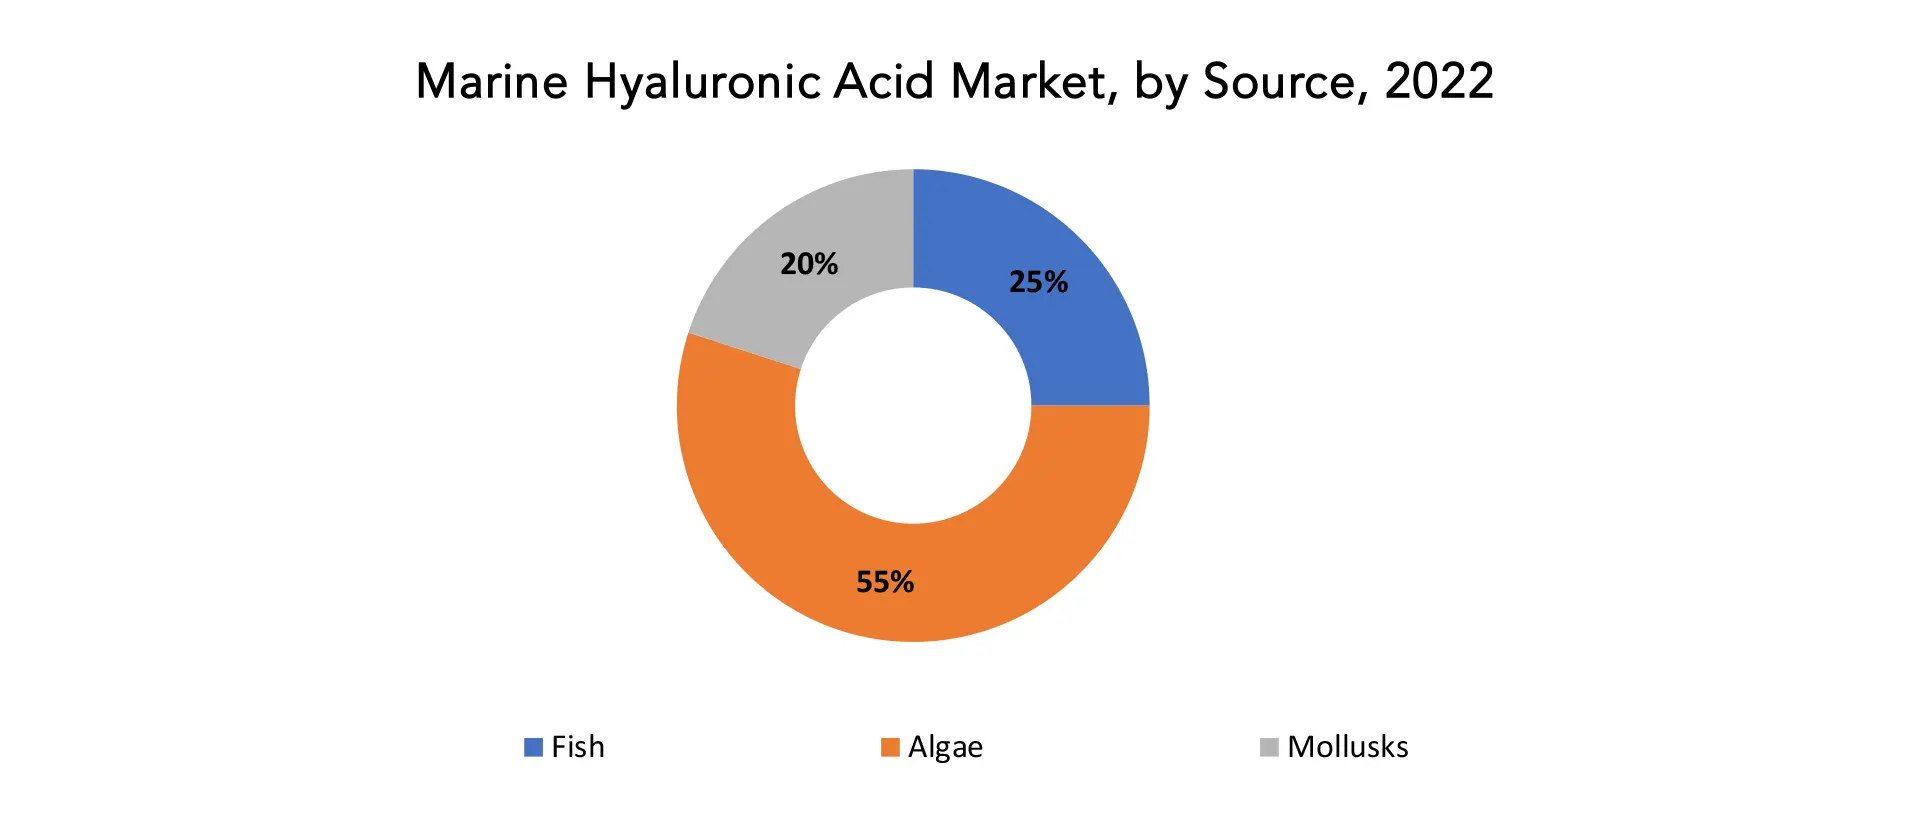
Marine Hyaluronic Acid Market Trends
- Natural and eco-friendly skincare and makeup products were becoming more and more popular. Hyaluronic acid from marine sources, especially algae and other marine microorganisms, was thought to be a more environmentally friendly and sustainable option than hyaluronic acid from conventional sources.
- The clean beauty movement, which focuses on products with simple and natural ingredients, was influencing the marine hyaluronic acid market. Brands were formulating products with cleaner and more transparent ingredient lists to meet consumer demand.
- Marine hyaluronic acid generated from algae was in line with the increasing demand for cruelty-free and vegan skincare and cosmetics. Hyaluronic acid extracted from marine sources was used by brands to market their products as being animal-friendly in an effort to appeal to this market.
- Skincare companies were progressively offering personalized products, and marine hyaluronic acid was being incorporated into customized skincare formulations to address individual skin concerns.
- In addition to the ingredient itself, packaging and sustainability in the marine hyaluronic acid market were also trending. Brands were exploring eco-friendly packaging options to reduce environmental impact.
Competitive Landscape
The competitive landscape in the marine hyaluronic acid market is dynamic, with both established and emerging players exploring innovative ways to meet consumer demands for natural, sustainable, and effective skincare and cosmetic products. Companies are also investing in research and development to create new formulations and expand into other applications beyond cosmetics, such as pharmaceuticals and nutraceuticals.- Bloomage Biotechnology Corporation Limited
- Novozymes
- Croma-Pharma
- HiMedia Laboratories
- Bioibérica S.A.
- Vital Proteins LLC
- Scope Fluidics S.A.
- LifeinForce Biotech
- Shandong Runke Chemical Co., Ltd.
- New York Biology
- Givaudan Active Beauty
- Provital Group
- Marinova
- Nouryon
- Conagen Inc.
- Italgelatine S.p.A.
- Blue California
- Symrise AG
- Kewpie Corporation
- Koninklijke DSM N.V.
Regional Analysis
Asia pacific accounted for the largest market in the marine hyaluronic acid market. Asia pacific accounted for the 38 % market share of the global market value. The Asia-Pacific region, including countries like China, Japan, South Korea, and India, has a huge population. With a increasing middle class and increasing disposable income, there is a significant demand for skincare and cosmetics, leading to a substantial market for marine hyaluronic acid-based products. The APAC region has a well-established and booming beauty and cosmetics industry. Asian consumers are known for their skincare and beauty-consciousness, and they often seek high-quality, innovative, and natural ingredients, such as marine hyaluronic acid, in their skincare products. There is a strong consumer partiality for natural and sustainable beauty products in the APAC region. Marine hyaluronic acid, derived from algae and other marine sources, aligns well with this preference, as it is considered a more eco-friendly and sustainable alternative to traditional hyaluronic acid sources. Some countries in the APAC region have access to a variety of marine resources. For example, Japan has a long history of using marine ingredients in beauty products. Local sourcing and production of marine hyaluronic acid can be cost-effective and advantageous for regional companies. [caption id="attachment_32627" align="aligncenter" width="1920"]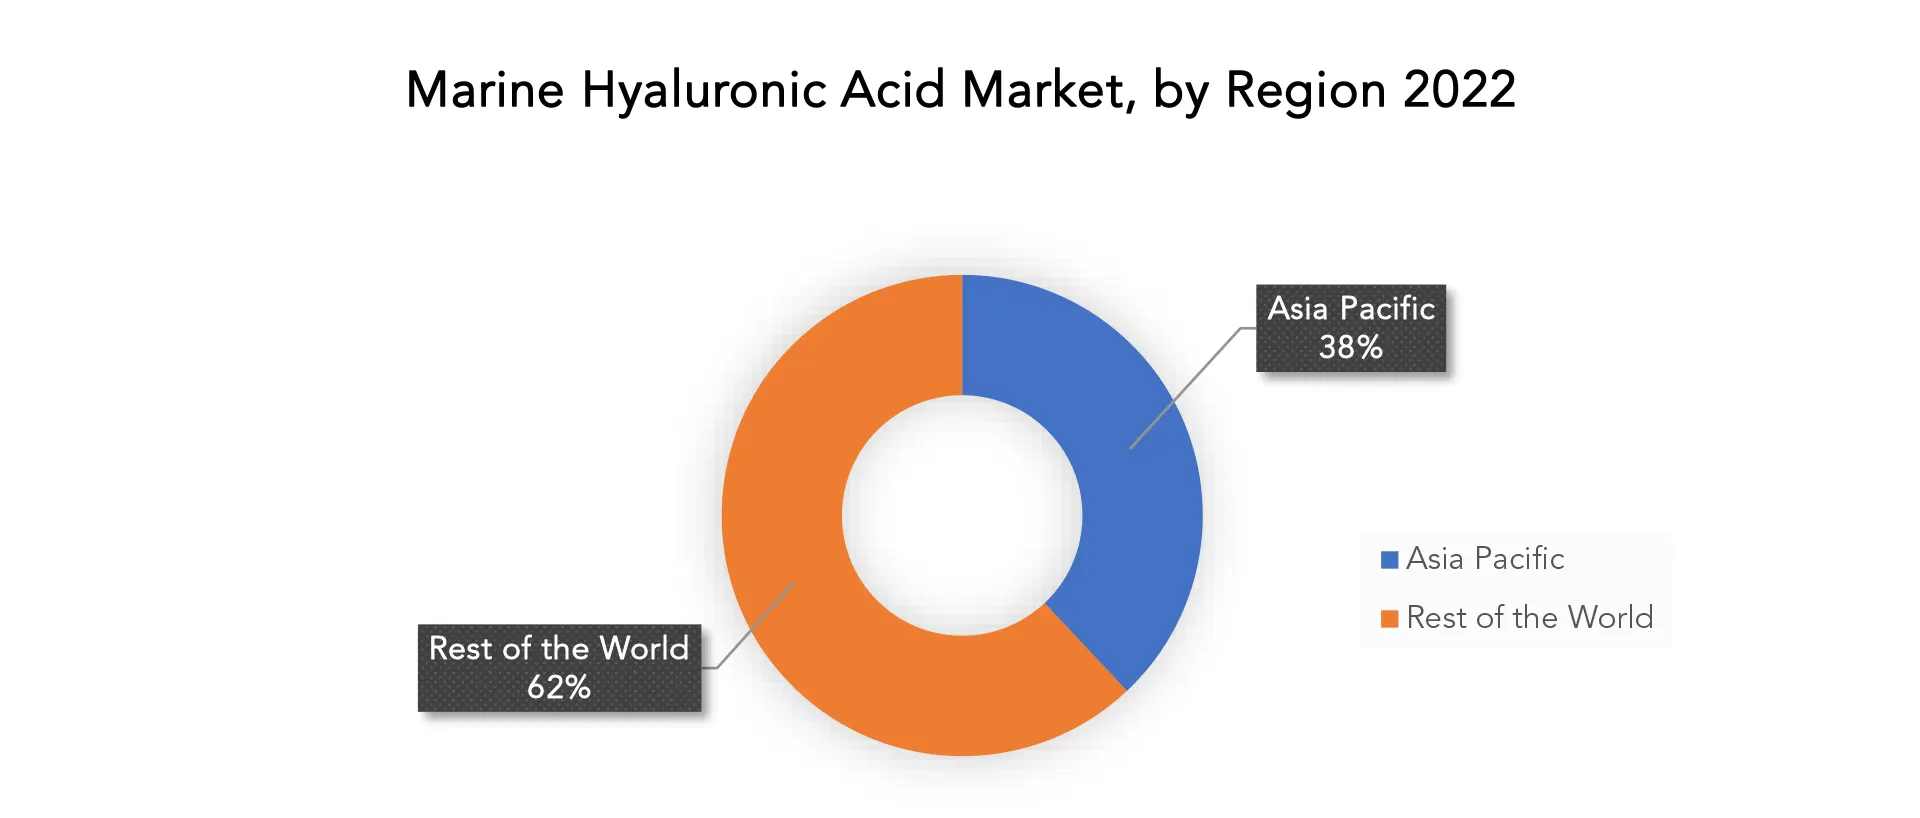
Target Audience for Marine Hyaluronic Acid Market
- K-12 Students
- Higher Education Students
- Adult Learners
- Parents and Guardians
- Online Teachers and Instructors
- Educational Developers
- Administrators (School and Program)
- Public School Districts
- Charter Schools
- Universities and Colleges
- For-Profit and Non-Profit Marine Hyaluronic Acid
- Government Agencies (Regulators)
- Legislators
- Educational Technology Providers
- Content Providers
- EdTech Startups
- Employers and Corporations
- Non-Governmental Organizations (NGOs)
- International Students
- Researchers and Analysts
Import & Export Data for Marine Hyaluronic Acid Market
Exactitude consultancy provides import and export data for the recent years. It also offers insights on production and consumption volume of the product. Understanding the import and export data is pivotal for any player in the Marine Hyaluronic Acid market. This knowledge equips businesses with strategic advantages, such as:- Identifying emerging markets with untapped potential.
- Adapting supply chain strategies to optimize cost-efficiency and market responsiveness.
- Navigating competition by assessing major players' trade dynamics.
Key insights
- Trade volume trends: our report dissects import and export data spanning the last five years to reveal crucial trends and growth patterns within the global Marine Hyaluronic Acid Market. This data-driven exploration empowers readers with a deep understanding of the market's trajectory.
- Market players: gain insights into the leading players driving the Marine Hyaluronic Acid trade. From established giants to emerging contenders, our analysis highlights the key contributors to the import and export landscape.
- Geographical dynamics: delve into the geographical distribution of trade activities. Uncover which regions dominate exports and which ones hold the reins on imports, painting a comprehensive picture of the industry's global footprint.
- Product breakdown: by segmenting data based on Marine Hyaluronic Acid types –– we provide a granular view of trade preferences and shifts, enabling businesses to align strategies with the evolving technological landscape.
Segments Covered in the Marine Hyaluronic Acid Market Report
Marine Hyaluronic Acid Market by Source 2020-2030, USD Million, (Kilotons)- Fish
- Algae
- Mollusks
- Cosmetic and Personal Care
- Food Supplement
- North America
- Europe
- Asia Pacific
- South America
- Middle East and Africa
Key Question Answered
- What is the expected growth rate of the marine hyaluronic acid market over the next 7 years?
- Who are the major players in the marine hyaluronic acid market and what is their market share?
- What are the end-user industries driving market demand and what is their outlook?
- What are the opportunities for growth in emerging markets such as aria-pacific, the middle east, and africa?
- How is the economic environment affecting the marine hyaluronic Acid market, including factors such as interest rates, inflation, and exchange rates?
- What is the expected impact of government policies and regulations on the marine hyaluronic acid market?
- What is the current and forecasted size and growth rate of the global marine hyaluronic acid market?
- What are the key drivers of growth in the marine hyaluronic acid market?
- Who are the major players in the market and what is their market share?
- What are the distribution channels and supply chain dynamics in the marine hyaluronic acid market?
- What are the technological advancements and innovations in the marine hyaluronic acid market and their impact on product development and growth?
- What are the regulatory considerations and their impact on the market?
- What are the challenges faced by players in the marine hyaluronic acid market and how are they addressing these challenges?
- What are the opportunities for growth and expansion in the marine hyaluronic acid market?
- What are the product offerings and specifications of leading players in the market?
- INTRODUZIONE
- DEFINIZIONE DI MERCATO
- SEGMENTAZIONE DEL MERCATO
- TEMPI DI RICERCA
- ASSUNZIONI E LIMITAZIONI
- METODOLOGIA DI RICERCA
- ESTRAZIONE DATI
- RICERCA SECONDARIA
- RICERCA PRIMARIA
- PARERI DEGLI ESPERTI IN MATERIA
- CONTROLLI DI QUALITÀ
- RECENSIONE FINALE
- TRIANGOLAZIONE DEI DATI
- APPROCCIO DAL BASSO VERSO L'ALTO
- APPROCCIO TOP-DOWN
- FLUSSO DI RICERCA
- FONTI DEI DATI
- ESTRAZIONE DATI
- SINTESI
- PANORAMICA DEL MERCATO
- PROSPETTIVE DEL MERCATO GLOBALE DELL'ACIDO IALURONICO MARINO
- FATTORI DI MERCATO
- LIMITAZIONI DI MERCATO
- OPPORTUNITÀ DI MERCATO
- IMPATTO DEL COVID-19 SUL MERCATO DELL'ACIDO IALURONICO MARINO
- MODELLO DELLE CINQUE FORZE DI PORTER
- MINACCIA DAI NUOVI ENTRANSI
- MINACCIA DA SOSTITUTI
- POTERE CONTRATTUALE DEI FORNITORI
- POTERE CONTRATTUALE DEI CLIENTI
- GRADO DI COMPETIZIONE
- ANALISI DELLA CATENA DEL VALORE DEL SETTORE
- PROSPETTIVE DEL MERCATO GLOBALE DELL'ACIDO IALURONICO MARINO
- MERCATO GLOBALE DELL'ACIDO IALURONICO MARINO PER FONTE, 2020-2030, (MILIONI DI USD)
- PESCARE
- ALGHE
- MOLLUSCHI
- MERCATO GLOBALE DELL'ACIDO IALURONICO MARINO PER TIPO , 2020-2030, (MILIONI DI USD)
- COSMETICA E CURA DELLA PERSONA
- INTEGRATORE ALIMENTARE
- MERCATO GLOBALE DELL'ACIDO IALURONICO MARINO PER REGIONE, 2020-2030, (MILIONI DI USD)
- AMERICA DEL NORD
- NOI
- CANADA
- MESSICO
- SUD AMERICA
- BRASILE
- ARGENTINA
- COLOMBIA
- RESTO DEL SUD AMERICA
- EUROPA
- GERMANIA
- Regno Unito
- FRANCIA
- ITALIA
- SPAGNA
- RUSSIA
- RESTO D'EUROPA
- ASIA PACIFICO
- INDIA
- CINA
- GIAPPONE
- COREA DEL SUD
- AUSTRALIA
- ASIA SUD-ORIENTALE
- RESTO DELL'ASIA PACIFICO
- MEDIO ORIENTE E AFRICA
- Emirati Arabi Uniti
- ARABIA SAUDITA
- SUDAFRICA
- RESTO DEL MEDIO ORIENTE E AFRICA
- AMERICA DEL NORD
- PROFILI AZIENDALI* (PANORAMICA AZIENDALE, PANORAMICA AZIENDALE, PRODOTTI OFFERTI, SVILUPPI RECENTI)
- Società a responsabilità limitata di biotecnologia dell'età di Bloom
- NOVOZIMI
- CROMA-FARMA
- LABORATORI HIMEDIA
- BIOIBÉRICA SA
- PROTEINE VITALI LLC
- FLUIDICA DI AMBITO SA
- BIOTECNOLOGIA DI LIFEFORCE
- SHANDONG RUNKE CHEMICAL CO., LTD.
- BIOLOGIA DI NEW YORK
- GIVAUDAN BELLEZZA ATTIVA
- GRUPPO PROVITALE
- MARINOVA
- NOURYON
- CONAGEN INC.
- ITALGELATINE SPA
- CALIFORNIA BLU
- Azienda agricola SYMRISE
- KEWPIE CORPORATION
- KONINKLIJKE DSM N.V. *THE COMPANY LIST IS INDICATIVE
LIST OF TABLES
TABLE 1 GLOBAL MARINE HYALURONIC ACID MARKET BY TYPE (USD MILLION) 2020-2030
TABLE 2 GLOBAL MARINE HYALURONIC ACID MARKET BY TYPE (KILOTONS) 2020-2030
TABLE 3 GLOBAL MARINE HYALURONIC ACID MARKET BY SOURCE (USD MILLION) 2020-2030
TABLE 4 GLOBAL MARINE HYALURONIC ACID MARKET BY SOURCE (KILOTONS) 2020-2030
TABLE 5 GLOBAL MARINE HYALURONIC ACID MARKET BY REGION (USD MILLION) 2020-2030
TABLE 6 GLOBAL MARINE HYALURONIC ACID MARKET BY REGION (KILOTONS) 2020-2030
TABLE 7 NORTH AMERICA MARINE HYALURONIC ACID MARKET BY COUNTRY (USD MILLION) 2020-2030
TABLE 8 NORTH AMERICA MARINE HYALURONIC ACID MARKET BY COUNTRY (KILOTONS) 2020-2030
TABLE 9 NORTH AMERICA MARINE HYALURONIC ACID MARKET BY TYPE (USD MILLION) 2020-2030
TABLE 10 NORTH AMERICA MARINE HYALURONIC ACID MARKET BY TYPE (KILOTONS) 2020-2030
TABLE 11 NORTH AMERICA MARINE HYALURONIC ACID MARKET BY SOURCE (USD MILLION) 2020-2030
TABLE 12 NORTH AMERICA MARINE HYALURONIC ACID MARKET BY SOURCE (KILOTONS) 2020-2030
TABLE 13 US MARINE HYALURONIC ACID MARKET BY TYPE (USD MILLION) 2020-2030
TABLE 14 US MARINE HYALURONIC ACID MARKET BY TYPE (KILOTONS) 2020-2030
TABLE 15 US MARINE HYALURONIC ACID MARKET BY SOURCE (USD MILLION) 2020-2030
TABLE 16 US MARINE HYALURONIC ACID MARKET BY SOURCE (KILOTONS) 2020-2030
TABLE 17 CANADA MARINE HYALURONIC ACID MARKET BY TYPE (USD MILLION) 2020-2030
TABLE 18 CANADA MARINE HYALURONIC ACID MARKET BY TYPE (KILOTONS) 2020-2030
TABLE 19 CANADA MARINE HYALURONIC ACID MARKET BY SOURCE (USD MILLION) 2020-2030
TABLE 20 CANADA MARINE HYALURONIC ACID MARKET BY SOURCE (KILOTONS) 2020-2030
TABLE 21 MEXICO MARINE HYALURONIC ACID MARKET BY TYPE (USD MILLION) 2020-2030
TABLE 22 MEXICO MARINE HYALURONIC ACID MARKET BY TYPE (KILOTONS) 2020-2030
TABLE 23 MEXICO MARINE HYALURONIC ACID MARKET BY SOURCE (USD MILLION) 2020-2030
TABLE 24 MEXICO MARINE HYALURONIC ACID MARKET BY SOURCE (KILOTONS) 2020-2030
TABLE 25 SOUTH AMERICA MARINE HYALURONIC ACID MARKET BY COUNTRY (USD MILLION) 2020-2030
TABLE 26 SOUTH AMERICA MARINE HYALURONIC ACID MARKET BY COUNTRY (KILOTONS) 2020-2030
TABLE 27 SOUTH AMERICA MARINE HYALURONIC ACID MARKET BY TYPE (USD MILLION) 2020-2030
TABLE 28 SOUTH AMERICA MARINE HYALURONIC ACID MARKET BY TYPE (KILOTONS) 2020-2030
TABLE 29 SOUTH AMERICA MARINE HYALURONIC ACID MARKET BY SOURCE (USD MILLION) 2020-2030
TABLE 30 SOUTH AMERICA MARINE HYALURONIC ACID MARKET BY SOURCE (KILOTONS) 2020-2030
TABLE 31 BRAZIL MARINE HYALURONIC ACID MARKET BY TYPE (USD MILLION) 2020-2030
TABLE 32 BRAZIL MARINE HYALURONIC ACID MARKET BY TYPE (KILOTONS) 2020-2030
TABLE 33 BRAZIL MARINE HYALURONIC ACID MARKET BY SOURCE (USD MILLION) 2020-2030
TABLE 34 BRAZIL MARINE HYALURONIC ACID MARKET BY SOURCE (KILOTONS) 2020-2030
TABLE 35 ARGENTINA MARINE HYALURONIC ACID MARKET BY TYPE (USD MILLION) 2020-2030
TABLE 36 ARGENTINA MARINE HYALURONIC ACID MARKET BY TYPE (KILOTONS) 2020-2030
TABLE 37 ARGENTINA MARINE HYALURONIC ACID MARKET BY SOURCE (USD MILLION) 2020-2030
TABLE 38 ARGENTINA MARINE HYALURONIC ACID MARKET BY SOURCE (KILOTONS) 2020-2030
TABLE 39 COLOMBIA MARINE HYALURONIC ACID MARKET BY TYPE (USD MILLION) 2020-2030
TABLE 40 COLOMBIA MARINE HYALURONIC ACID MARKET BY TYPE (KILOTONS) 2020-2030
TABLE 41 COLOMBIA MARINE HYALURONIC ACID MARKET BY SOURCE (USD MILLION) 2020-2030
TABLE 42 COLOMBIA MARINE HYALURONIC ACID MARKET BY SOURCE (KILOTONS) 2020-2030
TABLE 43 REST OF SOUTH AMERICA MARINE HYALURONIC ACID MARKET BY TYPE (USD MILLION) 2020-2030
TABLE 44 REST OF SOUTH AMERICA MARINE HYALURONIC ACID MARKET BY TYPE (KILOTONS) 2020-2030
TABLE 45 REST OF SOUTH AMERICA MARINE HYALURONIC ACID MARKET BY SOURCE (USD MILLION) 2020-2030
TABLE 46 REST OF SOUTH AMERICA MARINE HYALURONIC ACID MARKET BY SOURCE (KILOTONS) 2020-2030
TABLE 47 ASIA-PACIFIC MARINE HYALURONIC ACID MARKET BY COUNTRY (USD MILLION) 2020-2030
TABLE 48 ASIA-PACIFIC MARINE HYALURONIC ACID MARKET BY COUNTRY (KILOTONS) 2020-2030
TABLE 49 ASIA-PACIFIC MARINE HYALURONIC ACID MARKET BY TYPE (USD MILLION) 2020-2030
TABLE 50 ASIA-PACIFIC MARINE HYALURONIC ACID MARKET BY TYPE (KILOTONS) 2020-2030
TABLE 51 ASIA-PACIFIC MARINE HYALURONIC ACID MARKET BY SOURCE (USD MILLION) 2020-2030
TABLE 52 ASIA-PACIFIC MARINE HYALURONIC ACID MARKET BY SOURCE (KILOTONS) 2020-2030
TABLE 53 INDIA MARINE HYALURONIC ACID MARKET BY TYPE (USD MILLION) 2020-2030
TABLE 54 INDIA MARINE HYALURONIC ACID MARKET BY TYPE (KILOTONS) 2020-2030
TABLE 55 INDIA MARINE HYALURONIC ACID MARKET BY SOURCE (USD MILLION) 2020-2030
TABLE 56 INDIA MARINE HYALURONIC ACID MARKET BY SOURCE (KILOTONS) 2020-2030
TABLE 57 CHINA MARINE HYALURONIC ACID MARKET BY TYPE (USD MILLION) 2020-2030
TABLE 58 CHINA MARINE HYALURONIC ACID MARKET BY TYPE (KILOTONS) 2020-2030
TABLE 59 CHINA MARINE HYALURONIC ACID MARKET BY SOURCE (USD MILLION) 2020-2030
TABLE 60 CHINA MARINE HYALURONIC ACID MARKET BY SOURCE (KILOTONS) 2020-2030
TABLE 61 JAPAN MARINE HYALURONIC ACID MARKET BY TYPE (USD MILLION) 2020-2030
TABLE 62 JAPAN MARINE HYALURONIC ACID MARKET BY TYPE (KILOTONS) 2020-2030
TABLE 63 JAPAN MARINE HYALURONIC ACID MARKET BY SOURCE (USD MILLION) 2020-2030
TABLE 64 JAPAN MARINE HYALURONIC ACID MARKET BY SOURCE (KILOTONS) 2020-2030
TABLE 65 SOUTH KOREA MARINE HYALURONIC ACID MARKET BY TYPE (USD MILLION) 2020-2030
TABLE 66 SOUTH KOREA MARINE HYALURONIC ACID MARKET BY TYPE (KILOTONS) 2020-2030
TABLE 67 SOUTH KOREA MARINE HYALURONIC ACID MARKET BY SOURCE (USD MILLION) 2020-2030
TABLE 68 SOUTH KOREA MARINE HYALURONIC ACID MARKET BY SOURCE (KILOTONS) 2020-2030
TABLE 69 AUSTRALIA MARINE HYALURONIC ACID MARKET BY TYPE (USD MILLION) 2020-2030
TABLE 70 AUSTRALIA MARINE HYALURONIC ACID MARKET BY TYPE (KILOTONS) 2020-2030
TABLE 71 AUSTRALIA MARINE HYALURONIC ACID MARKET BY SOURCE (USD MILLION) 2020-2030
TABLE 72 AUSTRALIA MARINE HYALURONIC ACID MARKET BY SOURCE (KILOTONS) 2020-2030
TABLE 73 SOUTH-EAST ASIA MARINE HYALURONIC ACID MARKET BY TYPE (USD MILLION) 2020-2030
TABLE 74 SOUTH-EAST ASIA MARINE HYALURONIC ACID MARKET BY TYPE (KILOTONS) 2020-2030
TABLE 75 SOUTH-EAST ASIA MARINE HYALURONIC ACID MARKET BY SOURCE (USD MILLION) 2020-2030
TABLE 76 SOUTH-EAST ASIA MARINE HYALURONIC ACID MARKET BY SOURCE (KILOTONS) 2020-2030
TABLE 77 REST OF ASIA PACIFIC MARINE HYALURONIC ACID MARKET BY TYPE (USD MILLION) 2020-2030
TABLE 78 REST OF ASIA PACIFIC MARINE HYALURONIC ACID MARKET BY TYPE (KILOTONS) 2020-2030
TABLE 79 REST OF ASIA PACIFIC MARINE HYALURONIC ACID MARKET BY SOURCE (USD MILLION) 2020-2030
TABLE 80 REST OF ASIA PACIFIC MARINE HYALURONIC ACID MARKET BY SOURCE (KILOTONS) 2020-2030
TABLE 81 EUROPE MARINE HYALURONIC ACID MARKET BY COUNTRY (USD MILLION) 2020-2030
TABLE 82 EUROPE MARINE HYALURONIC ACID MARKET BY COUNTRY (KILOTONS) 2020-2030
TABLE 83 EUROPE MARINE HYALURONIC ACID MARKET BY TYPE (USD MILLION) 2020-2030
TABLE 84 EUROPE MARINE HYALURONIC ACID MARKET BY TYPE (KILOTONS) 2020-2030
TABLE 85 EUROPE MARINE HYALURONIC ACID MARKET BY SOURCE (USD MILLION) 2020-2030
TABLE 86 EUROPE MARINE HYALURONIC ACID MARKET BY SOURCE (KILOTONS) 2020-2030
TABLE 87 GERMANY MARINE HYALURONIC ACID MARKET BY TYPE (USD MILLION) 2020-2030
TABLE 88 GERMANY MARINE HYALURONIC ACID MARKET BY TYPE (KILOTONS) 2020-2030
TABLE 89 GERMANY MARINE HYALURONIC ACID MARKET BY SOURCE (USD MILLION) 2020-2030
TABLE 90 GERMANY MARINE HYALURONIC ACID MARKET BY SOURCE (KILOTONS) 2020-2030
TABLE 91 UK MARINE HYALURONIC ACID MARKET BY TYPE (USD MILLION) 2020-2030
TABLE 92 UK MARINE HYALURONIC ACID MARKET BY TYPE (KILOTONS) 2020-2030
TABLE 93 UK MARINE HYALURONIC ACID MARKET BY SOURCE (USD MILLION) 2020-2030
TABLE 94 UK MARINE HYALURONIC ACID MARKET BY SOURCE (KILOTONS) 2020-2030
TABLE 95 FRANCE MARINE HYALURONIC ACID MARKET BY TYPE (USD MILLION) 2020-2030
TABLE 96 FRANCE MARINE HYALURONIC ACID MARKET BY TYPE (KILOTONS) 2020-2030
TABLE 97 FRANCE MARINE HYALURONIC ACID MARKET BY SOURCE (USD MILLION) 2020-2030
TABLE 98 FRANCE MARINE HYALURONIC ACID MARKET BY SOURCE (KILOTONS) 2020-2030
TABLE 99 ITALY MARINE HYALURONIC ACID MARKET BY TYPE (USD MILLION) 2020-2030
TABLE 100 ITALY MARINE HYALURONIC ACID MARKET BY TYPE (KILOTONS) 2020-2030
TABLE 101 ITALY MARINE HYALURONIC ACID MARKET BY SOURCE (USD MILLION) 2020-2030
TABLE 102 ITALY MARINE HYALURONIC ACID MARKET BY SOURCE (KILOTONS) 2020-2030
TABLE 103 SPAIN MARINE HYALURONIC ACID MARKET BY TYPE (USD MILLION) 2020-2030
TABLE 104 SPAIN MARINE HYALURONIC ACID MARKET BY TYPE (KILOTONS) 2020-2030
TABLE 105 SPAIN MARINE HYALURONIC ACID MARKET BY SOURCE (USD MILLION) 2020-2030
TABLE 106 SPAIN MARINE HYALURONIC ACID MARKET BY SOURCE (KILOTONS) 2020-2030
TABLE 107 RUSSIA MARINE HYALURONIC ACID MARKET BY TYPE (USD MILLION) 2020-2030
TABLE 108 RUSSIA MARINE HYALURONIC ACID MARKET BY TYPE (KILOTONS) 2020-2030
TABLE 109 RUSSIA MARINE HYALURONIC ACID MARKET BY SOURCE (USD MILLION) 2020-2030
TABLE 110 RUSSIA MARINE HYALURONIC ACID MARKET BY SOURCE (KILOTONS) 2020-2030
TABLE 111 REST OF EUROPE MARINE HYALURONIC ACID MARKET BY TYPE (USD MILLION) 2020-2030
TABLE 112 REST OF EUROPE MARINE HYALURONIC ACID MARKET BY TYPE (KILOTONS) 2020-2030
TABLE 113 REST OF EUROPE MARINE HYALURONIC ACID MARKET BY SOURCE (USD MILLION) 2020-2030
TABLE 114 REST OF EUROPE MARINE HYALURONIC ACID MARKET BY SOURCE (KILOTONS) 2020-2030
TABLE 115 MIDDLE EAST AND AFRICA MARINE HYALURONIC ACID MARKET BY COUNTRY (USD MILLION) 2020-2030
TABLE 116 MIDDLE EAST AND AFRICA MARINE HYALURONIC ACID MARKET BY COUNTRY (KILOTONS) 2020-2030
TABLE 117 MIDDLE EAST AND AFRICA MARINE HYALURONIC ACID MARKET BY TYPE (USD MILLION) 2020-2030
TABLE 118 MIDDLE EAST AND AFRICA MARINE HYALURONIC ACID MARKET BY TYPE (KILOTONS) 2020-2030
TABLE 119 MIDDLE EAST AND AFRICA MARINE HYALURONIC ACID MARKET BY SOURCE (USD MILLION) 2020-2030
TABLE 120 MIDDLE EAST AND AFRICA MARINE HYALURONIC ACID MARKET BY SOURCE (KILOTONS) 2020-2030
TABLE 121 UAE MARINE HYALURONIC ACID MARKET BY TYPE (USD MILLION) 2020-2030
TABLE 122 UAE MARINE HYALURONIC ACID MARKET BY TYPE (KILOTONS) 2020-2030
TABLE 123 UAE MARINE HYALURONIC ACID MARKET BY SOURCE (USD MILLION) 2020-2030
TABLE 124 UAE MARINE HYALURONIC ACID MARKET BY SOURCE (KILOTONS) 2020-2030
TABLE 125 SAUDI ARABIA MARINE HYALURONIC ACID MARKET BY TYPE (USD MILLION) 2020-2030
TABLE 126 SAUDI ARABIA MARINE HYALURONIC ACID MARKET BY TYPE (KILOTONS) 2020-2030
TABLE 127 SAUDI ARABIA MARINE HYALURONIC ACID MARKET BY SOURCE (USD MILLION) 2020-2030
TABLE 128 SAUDI ARABIA MARINE HYALURONIC ACID MARKET BY SOURCE (KILOTONS) 2020-2030
TABLE 129 SOUTH AFRICA MARINE HYALURONIC ACID MARKET BY TYPE (USD MILLION) 2020-2030
TABLE 130 SOUTH AFRICA MARINE HYALURONIC ACID MARKET BY TYPE (KILOTONS) 2020-2030
TABLE 131 SOUTH AFRICA MARINE HYALURONIC ACID MARKET BY SOURCE (USD MILLION) 2020-2030
TABLE 132 SOUTH AFRICA MARINE HYALURONIC ACID MARKET BY SOURCE (KILOTONS) 2020-2030
TABLE 133 REST OF MIDDLE EAST AND AFRICA MARINE HYALURONIC ACID MARKET BY TYPE (USD MILLION) 2020-2030
TABLE 134 REST OF MIDDLE EAST AND AFRICA MARINE HYALURONIC ACID MARKET BY TYPE (KILOTONS) 2020-2030
TABLE 135 REST OF MIDDLE EAST AND AFRICA MARINE HYALURONIC ACID MARKET BY SOURCE (USD MILLION) 2020-2030
TABLE 136 REST OF MIDDLE EAST AND AFRICA MARINE HYALURONIC ACID MARKET BY SOURCE (KILOTONS) 2020-2030
LIST OF FIGURES
FIGURE 1 MARKET DYNAMICS
FIGURE 2 MARKET SEGMENTATION
FIGURE 3 REPORT TIMELINES: YEARS CONSIDERED
FIGURE 4 DATA TRIANGULATION
FIGURE 5 BOTTOM-UP APPROACH
FIGURE 6 TOP-DOWN APPROACH
FIGURE 7 RESEARCH FLOW
FIGURE 8 GLOBAL MARINE HYALURONIC ACID MARKET BY SOURCE (USD MILLION) 2020-2030
FIGURE 9 GLOBAL MARINE HYALURONIC ACID MARKET BY TYPE (USD MILLION) 2020-2030
FIGURE 13 GLOBAL MARINE HYALURONIC ACID MARKET BY REGION (USD MILLION) 2020-2030
FIGURE 14 PORTER’S FIVE FORCES MODEL
FIGURE 15 GLOBAL MARINE HYALURONIC ACID MARKET BY SOURCE (USD MILLION) 2022
FIGURE 16 GLOBAL MARINE HYALURONIC ACID MARKET BY TYPE (USD MILLION) 2022
FIGURE 17 GLOBAL MARINE HYALURONIC ACID MARKET BY REGION (USD MILLION) 2022
FIGURE 18 MARKET SHARE ANALYSIS
FIGURE 19 BLOOM AGE BIOTECHNOLOGY CORPORATION LIMITED: COMPANY SNAPSHOT
FIGURE 20 NOVOZYMES: COMPANY SNAPSHOT
FIGURE 21 CROMA-PHARMA: COMPANY SNAPSHOT
FIGURE 22 HIMEDIA LABORATORIES: COMPANY SNAPSHOT
FIGURE 23 BIOIBÉRICA S.A.: COMPANY SNAPSHOT
FIGURE 24 VITAL PROTEINS LLC: COMPANY SNAPSHOT
FIGURE 25 SCOPE FLUIDICS S.A.: COMPANY SNAPSHOT
FIGURE 26 LIFEINFORCE BIOTECH: COMPANY SNAPSHOT
FIGURE 27 SHANDONG RUNKE CHEMICAL CO., LTD.: COMPANY SNAPSHOT
FIGURE 28 NEW YORK BIOLOGY: COMPANY SNAPSHOT
FIGURE 29 GIVAUDAN ACTIVE BEAUTY: COMPANY SNAPSHOT
FIGURE 30 PROVITAL GROUP: COMPANY SNAPSHOT
FIGURE 31 MARINOVA: COMPANY SNAPSHOT
FIGURE 32 NOURYON: COMPANY SNAPSHOT
FIGURE 33 CONAGEN INC.: COMPANY SNAPSHOT
FIGURE 34 BLUE CALIFORNIA: COMPANY SNAPSHOT
DOWNLOAD FREE SAMPLE REPORT
License Type
SPEAK WITH OUR ANALYST
Want to know more about the report or any specific requirement?
WANT TO CUSTOMIZE THE REPORT?
Our Clients Speak
We asked them to research ‘ Equipment market’ all over the world, and their whole arrangement was helpful to us. thehealthanalytics.com insightful analysis and reports contributed to our current analysis and in creating a future strategy. Besides, the te
Yosuke Mitsui
Senior Associate Construction Equipment Sales & Marketing
We asked them to research ‘Equipment market’ all over the world, and their whole arrangement was helpful to us. thehealthanalytics.com insightful analysis and reports contributed to our current analysis and in creating a future strategy. Besides, the te


