

Base Year Value ()
x.x %
x.x %
CAGR ()
x.x %
x.x %
Forecast Year Value ()
x.x %
x.x %
Historical Data Period
Largest Region
Forecast Period
Mercato dei silani per prodotto (alchil silano, silano di zolfo, silano amminico, silano vinilico, silano epossidico, silano metacrilato, mono/cloro silano), applicazione (vernici e rivestimenti, adesivi e sigillanti, gomma e plastica, trattamento delle fibre, elettronica e semiconduttori) e per regione (Nord America, Europa, Asia Pacifico, Sud America, Medio Oriente e Africa). Tendenze e previsioni globali dal 2022 al 2029
Instant access to hundreds of data points and trends
- Market estimates from 2014-2029
- Competitive analysis, industry segmentation, financial benchmarks
- Incorporates SWOT, Porter's Five Forces and risk management frameworks
- PDF report or online database with Word, Excel and PowerPoint export options
- 100% money back guarantee
Panoramica del mercato dei silani
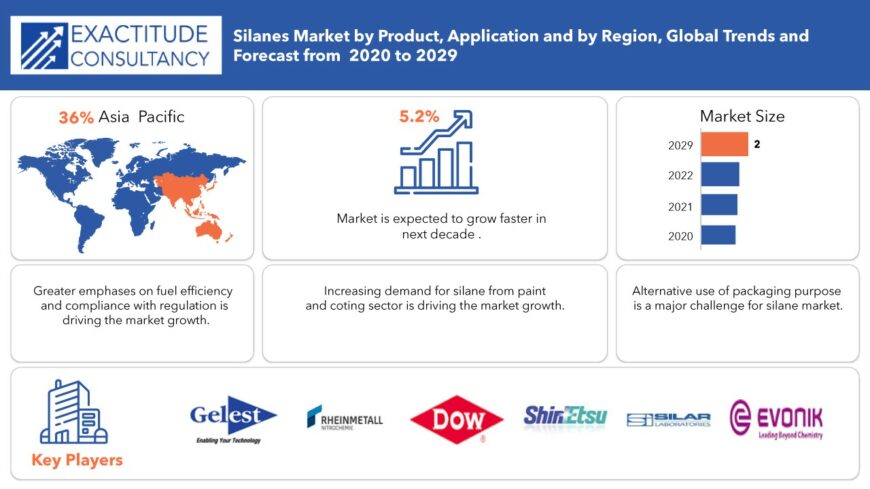
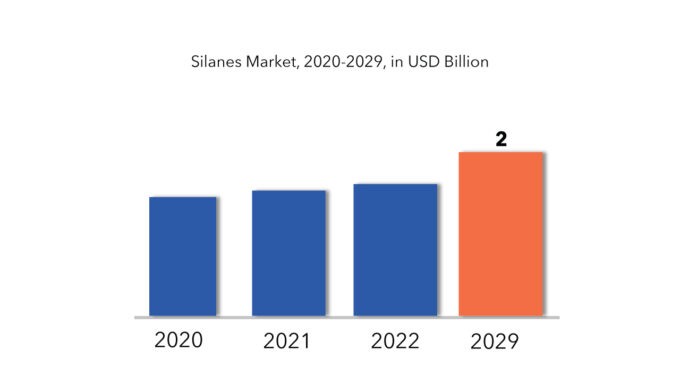
Si prevede che il mercato globale dei silani raggiungerà i 2,30 miliardi di dollari entro il 2029, rispetto agli 1,45 miliardi di dollari del 2020, con un CAGR del 5,2% dal 2022 al 2029.
L'industria automobilistica contemporanea, focalizzata sul miglioramento dell'efficienza del carburante e sul rafforzamento della sicurezza stradale, si sta sempre più rivolgendo ai silani per attenuare la resistenza al rotolamento e migliorare la trazione su superfici bagnate o scivolose. I produttori di apparecchiature originali (OEM) stanno incorporando più materie plastiche, materie plastiche/compositi rinforzati con fibre e pneumatici rinforzati con silani per conformarsi agli standard sui carburanti imposti dalle agenzie federali statunitensi e dall'UE. Di conseguenza, si prevede che il consumo di silani nel trattamento di materie plastiche , gomma e fibre registrerà una crescita significativa nel lasso di tempo previsto.
Il mercato dei silani è pronto per l'espansione, guidato da innovazioni e progressi, che sbloccheranno opportunità redditizie sia per entità consolidate che per attori emergenti. Questi progressi stanno promuovendo nuove applicazioni dei silani in settori quali prodotti farmaceutici e cosmetici. In particolare, si prevede che l'esplorazione di nuove applicazioni da parte di aziende di cosmetici e cura della persona nella cura dei capelli creerà strade per i produttori di silani.
[caption id="allegato_4808" align="aligncenter" width="870"]
I silani servono come primer e tackifier nel settore dei rivestimenti, migliorando il legame tra rivestimenti in resina e substrati protetti. Gli agenti di accoppiamento silanici, i componenti principali dei primer, possono essere combinati con specifici agenti filmogeni, catalizzatori e pigmenti. I rivestimenti di fondo , formati tramite diluizione del solvente, subiscono un processo che coinvolge l'evaporazione del solvente, l'idrolisi e la condensazione dell'acqua atmosferica.
Nel regno dei rivestimenti a base di olio e acqua, il trattamento di riempitivi e pigmenti con silani o additivi migliora significativamente la loro bagnabilità e dispersione durante la fase di rivestimento, portando a una sostanziale riduzione della viscosità. Poiché l' industria delle vernici e dei rivestimenti sposta la sua attenzione dai rivestimenti a base di solvente a quelli a base di acqua, l'uso di silani nei rivestimenti è aumentato. Il silano epossidico , in particolare, aiuta a migliorare la resistenza al blocco e le qualità di carteggiatura dei rivestimenti trasparenti a base di acqua, alimentando così la domanda di silani nel prossimo futuro.
[caption id="allegato_4810" align="alignnone" width="680"]
Silanes Market Segment Analysis
The silanes market is divided into two categories based on product: alkyl silane, sulfur silane, amino silane, vinyl silane, epoxy silane, methacrylate silane, mono/chloro silane. Mono/chloro segment dominate the silanes market. The mono/chloro product type is also used as an intermediate in the production of ultrapure silicon, which is used in the semiconductor industry, and as a protective agent for pharmaceutical intermediates. Mono/chloro silanes are used to coat glass surfaces and silicon, as well as to make silicon polymers. Amino products are also used as a coupling agent, an adhesion promoter, a resin additive, and a surface modifier. Chemical bonding of resins in reinforcing materials and inorganic fillers is improved. The amino-based product is also stable and water-soluble, making it suitable for a wide range of applications. Amino silane is produced by a number of major players in the market for use in paints and coatings. Over the next few years, demand for various silane products as crosslinking agents, adhesion promoters, and coupling agents is expected to increase. Because of their widespread use in reinforcing materials, inorganic fillers, and more across industries like plastic and rubber, amino silanes are expected to have the highest global consumption in terms of volume. In addition, with technological advancements by key product manufacturers around the world, such as PCC Group, Evonik Industries, and Shin-Etsu Chemicals, to serve a broader market base, demand for various products is expected to rise in the coming years.
The market is divided into paints and coating, adhesives and sealants, rubber and plastic, fiber treatment, electronics and semiconductor based on application. Paint and coating segment dominate the silanes market. The high demand for various silane products from various coatings applications, such as emulsion paints and automotive, aircraft, marine, interior & exterior decorative coatings, is to blame for this. Increased demand for cargo and defence aircraft, particularly from developing countries in North America and Europe, is expected to boost the segment's growth in the coming years. Silane is used to crosslink polyethylene and polyethylene copolymers for use in cable insulation and electrical wires. In places where high-temperature resistance is required, silane-based plastic compounds are used. These plastic compounds are also found in hot and cold-water pipes, as well as natural gas carrier pipes. Over the forecast period, the industry is expected to be driven by the expansion of the electrical sector, particularly in Asia Pacific. Plastic and rubber components are critical in multiple application points, and technological advancements in the construction and transportation sectors are expected to fuel product demand even more. Several large-scale manufacturers are constantly investing in research to improve their product portfolios in order to meet the diverse product needs of growing end-use industries. Because of the product's ability to provide excellent adhesion boost as well as being a highly effective coupling agent, paints & coatings, followed by adhesives & sealants, are among the largest consumers of the product globally. Increased construction activity in all major economies is increasing demand for various industrial sealants and coating formulations, which is expected to drive market growth in the coming years.
Silanes Market Players
The major players operating in the global silanes market industry include Gelest, Inc., Shin-Etsu Chemical Co. Ltd., Nitrochemie Aschau GmbH, Silar (Entegris), Dow Corning, Evonik Industries, Wacker Chemie AG, Power Chemical Corp. These industry players are implementing several strategies such as product launches, collaborations, mergers and acquisitions to sustain industry competition and capture higher market share.
Who Should Buy? Or Key Stakeholders
- Paint and coating companies
- Rubber and Plastic companies
- Fiber Treatment industries
- Electronic and Semiconductor sector
- Others
Key Takeaways
- The global silanes market is projected to grow at a CAGR of 5.2%
- Based on product, mono/chloro segment dominate the silanes market.
- Based on application, paint and coating segment dominate the silanes market.
- Asia Pacific is expected to hold the largest share of the global silanes market.
- Increasing demand for eco-friendly and sustainable silane-based products in construction and automotive industries.
Silanes Market Regional Analysis
Geographically, the silanes market is segmented into North America, South America, Europe, APAC and MEA.
- North America: includes the US, Canada, Mexico
- Europe: includes UK, Germany, France, Italy, Spain, Russia, and Rest of Europe
- Asia Pacific: includes China, Japan, South Korea, India, Australia, ASEAN and Rest of APAC
- South America: includes Brazil, Argentina and Rest of South America
- Middle East & Africa: includes Turkey, UAE, Saudi Arabia, South Africa, and Rest of MEA
Asia Pacific is expected to hold the largest share of the global silanes market. The expanding manufacturing sector in Vietnam, South Korea, Thailand, China, Japan, and India fueled demand for plastic compounds and rubber substrates in the automotive, industrial machinery, construction, packaging, and electrical & electronics industries. Due to technology transfer from the Western world, India and China have seen an increase in automotive production in recent years. Furthermore, a well-established electrical and electronics manufacturing base in Taiwan, China, and South Korea is expected to provide additional impetus to the industry.
[caption id="attachment_4811" align="alignnone" width="680"]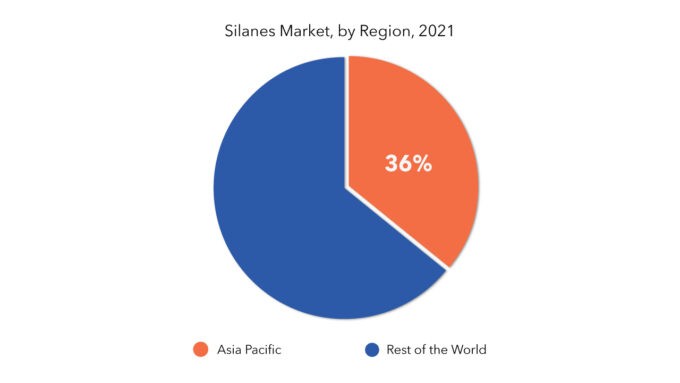
Key Market Segments: Silanes Market
Silanes Market by Product, 2020-2029, (USD Million) (Kilotons)- Alkyl Silane
- Sulfur Silane
- Amino Silane
- Vinyl Silane
- Epoxy Silane
- Methacrylate Silane
- Mono/Chloro Silane
- Paints And Coating
- Adhesives And Sealants
- Rubber And Plastic
- Fiber Treatment
- Electronic And Semiconductor
- North America
- Europe
- Asia Pacific
- South America
- Middle East And Africa
Key Question Answered
- What is the current scenario of the global silanes market?
- What are the emerging technologies for the development of silanes market devices?
- What are the historical size and the present size of the market segments and their future potential?
- What are the major catalysts for the market and their impact during the short, medium, and long terms?
- What are the evolving opportunities for the players in the market?
- Which are the key regions from the investment perspective?
- What are the key strategies being adopted by the major players to up their market shares?
- Introduzione
- Definizione di mercato
- Segmentazione del mercato
- Cronologie della ricerca
- Presupposti e limitazioni
- Metodologia di ricerca
- Estrazione dei dati
- Ricerca secondaria
- Ricerca primaria
- Consigli degli esperti in materia
- Controlli di qualità
- Revisione finale
- Triangolazione dei dati
- Approccio dal basso verso l'alto
- Approccio dall'alto verso il basso
- Flusso di ricerca
- Fonti dei dati
- Estrazione dei dati
- Sintesi
- Panoramica del mercato
- Prospettive del mercato globale dei silani
- Fattori trainanti del mercato
- Limitazioni di mercato
- Opportunità di mercato
- Impatto del Covid-19 sul mercato globale dei silani
- Prospettive del mercato globale dei silani
- Mercato globale dei silani per prodotto, (milioni di USD) (chilotoni)
- Zeoliti
- Metallico
- Composto chimico
- Mercato globale dei silani per applicazione, (milioni di USD) (chilotoni)
- Catalizzatori FCC
- Catalizzatori di alchilazione
- Catalizzatori di idrotrattamento
- Catalizzatori di idrocracking
- Riforma catalitica
- Mercato globale dei silani per regione, (milioni di USD) (chilotoni)
- Introduzione
- Asia-Pacifico
- Cina
- India
- Giappone
- Corea del Sud
- Australia
- Asia sud-orientale
- Resto dell'Asia-Pacifico
- America del Nord
- Stati Uniti
- Canada
- Messico
- Europa
- Germania
- Regno Unito
- Francia
- Italia
- Spagna
- Russia
- Resto d'Europa
- Sud America
- Brasile
- Argentina
- Colombia
- Resto del Sud America
- Medio Oriente e Africa
- Emirati Arabi Uniti
- Arabia Saudita
- Sudafrica
- Resto del Medio Oriente e Africa
- Profili aziendali* (panoramica aziendale, istantanea aziendale, prodotti offerti, sviluppi recenti)
- Società a responsabilità limitata
- Società chimica Shin-Etsu Ltd.
- Nitrochemie Aschau GmbH
- Silare (Entegris)
- Dow Corning
- Industrie Evonik
- Wacker Chemie AG
- Società chimica di potenza
- Altri *L'elenco delle aziende è indicativo
ELENCO DELLE TABELLE
TABLE 1 GLOBAL SILANES MARKET BY APPLICATION (USD MILLIONS) 2020-2029
TABLE 2 GLOBAL SILANES MARKET BY APPLICATION (KILOTONS) 2020-2029
TABLE 3 GLOBAL SILANES MARKET BY PRODUCT (USD MILLIONS) 2020-2029
TABLE 4 GLOBAL SILANES MARKET BY PRODUCT (KILOTONS) 2020-2029
TABLE 5 GLOBAL SILANES MARKET BY REGION (USD MILLIONS) 2020-2029
TABLE 6 GLOBAL SILANES MARKET BY REGION (KILOTONS) 2020-2029
TABLE 7 US SILANES MARKET BY APPLICATION (USD MILLIONS) 2020-2029
TABLE 8 US SILANES MARKET BY APPLICATION (KILOTONS) 2020-2029
TABLE 9 US SILANES MARKET BY PRODUCT (USD MILLIONS) 2020-2029
TABLE 10 US SILANES MARKET BY PRODUCT (KILOTONS) 2020-2029
TABLE 11 CANADA SILANES MARKET BY APPLICATION (USD MILLIONS) 2020-2029
TABLE 12 CANADA SILANES MARKET BY APPLICATION (KILOTONS) 2020-2029
TABLE 13 CANADA SILANES MARKET BY PRODUCT (USD MILLIONS) 2020-2029
TABLE 14 CANADA SILANES MARKET BY PRODUCT (KILOTONS) 2020-2029
TABLE 15 MEXICO SILANES MARKET BY APPLICATION (USD MILLIONS) 2020-2029
TABLE 16 MEXICO SILANES MARKET BY APPLICATION (KILOTONS) 2020-2029
TABLE 17 MEXICO SILANES MARKET BY PRODUCT (USD MILLIONS) 2020-2029
TABLE 18 MEXICO SILANES MARKET BY PRODUCT (KILOTONS) 2020-2029
TABLE 19 BRAZIL SILANES MARKET BY APPLICATION (USD MILLIONS) 2020-2029
TABLE 20 BRAZIL SILANES MARKET BY APPLICATION (KILOTONS) 2020-2029
TABLE 21 BRAZIL SILANES MARKET BY PRODUCT (USD MILLIONS) 2020-2029
TABLE 22 BRAZIL SILANES MARKET BY PRODUCT (KILOTONS) 2020-2029
TABLE 23 ARGENTINA SILANES MARKET BY APPLICATION (USD MILLIONS) 2020-2029
TABLE 24 ARGENTINA SILANES MARKET BY APPLICATION (KILOTONS) 2020-2029
TABLE 25 ARGENTINA SILANES MARKET BY PRODUCT (USD MILLIONS) 2020-2029
TABLE 26 ARGENTINA SILANES MARKET BY PRODUCT (KILOTONS) 2020-2029
TABLE 27 COLOMBIA SILANES MARKET BY APPLICATION (USD MILLIONS) 2020-2029
TABLE 28 COLOMBIA SILANES MARKET BY APPLICATION (KILOTONS) 2020-2029
TABLE 29 COLOMBIA SILANES MARKET BY PRODUCT (USD MILLIONS) 2020-2029
TABLE 30 COLOMBIA SILANES MARKET BY PRODUCT (KILOTONS) 2020-2029
TABLE 31 REST OF SOUTH AMERICA SILANES MARKET BY APPLICATION (USD MILLIONS) 2020-2029
TABLE 32 REST OF SOUTH AMERICA SILANES MARKET BY APPLICATION (KILOTONS) 2020-2029
TABLE 33 REST OF SOUTH AMERICA SILANES MARKET BY PRODUCT (USD MILLIONS) 2020-2029
TABLE 34 REST OF SOUTH AMERICA SILANES MARKET BY PRODUCT (KILOTONS) 2020-2029
TABLE 35 INDIA SILANES MARKET BY APPLICATION (USD MILLIONS) 2020-2029
TABLE 36 INDIA SILANES MARKET BY APPLICATION (KILOTONS) 2020-2029
TABLE 37 INDIA SILANES MARKET BY PRODUCT (USD MILLIONS) 2020-2029
TABLE 38 INDIA SILANES MARKET BY PRODUCT (KILOTONS) 2020-2029
TABLE 39 CHINA SILANES MARKET BY APPLICATION (USD MILLIONS) 2020-2029
TABLE 40 CHINA SILANES MARKET BY APPLICATION (KILOTONS) 2020-2029
TABLE 41 CHINA SILANES MARKET BY PRODUCT (USD MILLIONS) 2020-2029
TABLE 42 CHINA SILANES MARKET BY PRODUCT (KILOTONS) 2020-2029
TABLE 43 JAPAN SILANES MARKET BY APPLICATION (USD MILLIONS) 2020-2029
TABLE 44 JAPAN SILANES MARKET BY APPLICATION (KILOTONS) 2020-2029
TABLE 45 JAPAN SILANES MARKET BY PRODUCT (USD MILLIONS) 2020-2029
TABLE 46 JAPAN SILANES MARKET BY PRODUCT (KILOTONS) 2020-2029
TABLE 47 SOUTH KOREA SILANES MARKET BY APPLICATION (USD MILLIONS) 2020-2029
TABLE 48 SOUTH KOREA SILANES MARKET BY APPLICATION (KILOTONS) 2020-2029
TABLE 49 SOUTH KOREA SILANES MARKET BY PRODUCT (USD MILLIONS) 2020-2029
TABLE 50 SOUTH KOREA SILANES MARKET BY PRODUCT (KILOTONS) 2020-2029
TABLE 51 AUSTRALIA SILANES MARKET BY APPLICATION (USD MILLIONS) 2020-2029
TABLE 52 AUSTRALIA SILANES MARKET BY APPLICATION (KILOTONS) 2020-2029
TABLE 53 AUSTRALIA SILANES MARKET BY PRODUCT (USD MILLIONS) 2020-2029
TABLE 54 AUSTRALIA SILANES MARKET BY PRODUCT (KILOTONS) 2020-2029
TABLE 55 SOUTH-EAST ASIA SILANES MARKET BY APPLICATION (USD MILLIONS) 2020-2029
TABLE 56 SOUTH-EAST ASIA SILANES MARKET BY APPLICATION (KILOTONS) 2020-2029
TABLE 57 SOUTH-EAST ASIA SILANES MARKET BY PRODUCT (USD MILLIONS) 2020-2029
TABLE 58 SOUTH-EAST ASIA SILANES MARKET BY PRODUCT (KILOTONS) 2020-2029
TABLE 59 REST OF ASIA PACIFIC SILANES MARKET BY APPLICATION (USD MILLIONS) 2020-2029
TABLE 60 REST OF ASIA PACIFIC SILANES MARKET BY APPLICATION (KILOTONS) 2020-2029
TABLE 61 REST OF ASIA PACIFIC SILANES MARKET BY PRODUCT (USD MILLIONS) 2020-2029
TABLE 62 REST OF ASIA PACIFIC SILANES MARKET BY PRODUCT (KILOTONS) 2020-2029
TABLE 63 GERMANY SILANES MARKET BY APPLICATION (USD MILLIONS) 2020-2029
TABLE 64 GERMANY SILANES MARKET BY APPLICATION (KILOTONS) 2020-2029
TABLE 65 GERMANY SILANES MARKET BY PRODUCT (USD MILLIONS) 2020-2029
TABLE 66 GERMANY SILANES MARKET BY PRODUCT (KILOTONS) 2020-2029
TABLE 67 UK SILANES MARKET BY APPLICATION (USD MILLIONS) 2020-2029
TABLE 68 UK SILANES MARKET BY APPLICATION (KILOTONS) 2020-2029
TABLE 69 UK SILANES MARKET BY PRODUCT (USD MILLIONS) 2020-2029
TABLE 70 UK SILANES MARKET BY PRODUCT (KILOTONS) 2020-2029
TABLE 71 FRANCE SILANES MARKET BY APPLICATION (USD MILLIONS) 2020-2029
TABLE 72 FRANCE SILANES MARKET BY APPLICATION (KILOTONS) 2020-2029
TABLE 73 FRANCE SILANES MARKET BY PRODUCT (USD MILLIONS) 2020-2029
TABLE 74 FRANCE SILANES MARKET BY PRODUCT (KILOTONS) 2020-2029
TABLE 75 ITALY SILANES MARKET BY APPLICATION (USD MILLIONS) 2020-2029
TABLE 76 ITALY SILANES MARKET BY APPLICATION (KILOTONS) 2020-2029
TABLE 77 ITALY SILANES MARKET BY PRODUCT (USD MILLIONS) 2020-2029
TABLE 78 ITALY SILANES MARKET BY PRODUCT (KILOTONS) 2020-2029
TABLE 79 SPAIN SILANES MARKET BY APPLICATION (USD MILLIONS) 2020-2029
TABLE 80 SPAIN SILANES MARKET BY APPLICATION (KILOTONS) 2020-2029
TABLE 81 SPAIN SILANES MARKET BY PRODUCT (USD MILLIONS) 2020-2029
TABLE 82 SPAIN SILANES MARKET BY PRODUCT (KILOTONS) 2020-2029
TABLE 83 RUSSIA SILANES MARKET BY APPLICATION (USD MILLIONS) 2020-2029
TABLE 84 RUSSIA SILANES MARKET BY APPLICATION (KILOTONS) 2020-2029
TABLE 85 RUSSIA SILANES MARKET BY PRODUCT (USD MILLIONS) 2020-2029
TABLE 86 RUSSIA SILANES MARKET BY PRODUCT (KILOTONS) 2020-2029
TABLE 87 REST OF EUROPE SILANES MARKET BY APPLICATION (USD MILLIONS) 2020-2029
TABLE 88 REST OF EUROPE SILANES MARKET BY APPLICATION (KILOTONS) 2020-2029
TABLE 89 REST OF EUROPE SILANES MARKET BY PRODUCT (USD MILLIONS) 2020-2029
TABLE 90 REST OF EUROPE SILANES MARKET BY PRODUCT (KILOTONS) 2020-2029
TABLE 91 UAE SILANES MARKET BY APPLICATION (USD MILLIONS) 2020-2029
TABLE 92 UAE SILANES MARKET BY APPLICATION (KILOTONS) 2020-2029
TABLE 93 UAE SILANES MARKET BY PRODUCT (USD MILLIONS) 2020-2029
TABLE 94 UAE SILANES MARKET BY PRODUCT (KILOTONS) 2020-2029
TABLE 95 SAUDI ARABIA SILANES MARKET BY APPLICATION (USD MILLIONS) 2020-2029
TABLE 96 SAUDI ARABIA SILANES MARKET BY APPLICATION (KILOTONS) 2020-2029
TABLE 97 SAUDI ARABIA SILANES MARKET BY PRODUCT (USD MILLIONS) 2020-2029
TABLE 98 SAUDI ARABIA SILANES MARKET BY PRODUCT (KILOTONS) 2020-2029
TABLE 99 SOUTH AFRICA SILANES MARKET BY APPLICATION (USD MILLIONS) 2020-2029
TABLE 100 SOUTH AFRICA SILANES MARKET BY APPLICATION (KILOTONS) 2020-2029
TABLE 101 SOUTH AFRICA SILANES MARKET BY PRODUCT (USD MILLIONS) 2020-2029
TABLE 102 SOUTH AFRICA SILANES MARKET BY PRODUCT (KILOTONS) 2020-2029
TABLE 103 REST OF MIDDLE EAST AND AFRICA SILANES MARKET BY APPLICATION (USD MILLIONS) 2020-2029
TABLE 104 REST OF MIDDLE EAST AND AFRICA SILANES MARKET BY APPLICATION (KILOTONS) 2020-2029
TABLE 105 REST OF MIDDLE EAST AND AFRICA SILANES MARKET BY PRODUCT (USD MILLIONS) 2020-2029
TABLE 106 REST OF MIDDLE EAST AND AFRICA SILANES MARKET BY PRODUCT (KILOTONS) 2020-2029
LIST OF FIGURES
FIGURE 1 MARKET DYNAMICS
FIGURE 2 MARKET SEGMENTATION
FIGURE 3 REPORT TIMELINES: YEARS CONSIDERED
FIGURE 4 DATA TRIANGULATION
FIGURE 5 BOTTOM-UP APPROACH
FIGURE 6 TOP-DOWN APPROACH
FIGURE 7 RESEARCH FLOW
FIGURE 8 GLOBAL SILANES MARKET BY PRODUCT, USD MILLION, 2020-2029
FIGURE 9 GLOBAL SILANES MARKET BY APPLICATION, USD MILLION, 2020-2029
FIGURE 10 GLOBAL SILANES MARKET BY REGION, USD MILLION, 2020-2029
FIGURE 11 PORTER’S FIVE FORCES MODEL
FIGURE 12 GLOBAL SILANES MARKET BY PRODUCT, USD MILLION, 2020-2029
FIGURE 13 GLOBAL SILANES MARKET BY APPLICATION, USD MILLION, 2020-2029
FIGURE 14 GLOBAL SILANES MARKET BY REGION, USD MILLION, 2020-2029
FIGURE 15 SILANES MARKET BY REGION 2020
FIGURE 16 MARKET SHARE ANALYSIS
FIGURE 17 GELEST, INC.: COMPANY SNAPSHOT
FIGURE 18 SHIN-ETSU CHEMICAL CO. LTD.: COMPANY SNAPSHOT
FIGURE 19 NITROCHEMIE ASCHAU GMBH: COMPANY SNAPSHOT
FIGURE 20 SILAR (ENTEGRIS): COMPANY SNAPSHOT
FIGURE 21 DOW CORNING: COMPANY SNAPSHOT
FIGURE 22 EVONIK INDUSTRIES: COMPANY SNAPSHOT
FIGURE 23 WACKER CHEMIE AG: COMPANY SNAPSHOT
FIGURE 24 POWER CHEMICAL CORP: COMPANY SNAPSHOT
DOWNLOAD FREE SAMPLE REPORT
License Type
SPEAK WITH OUR ANALYST
Want to know more about the report or any specific requirement?
WANT TO CUSTOMIZE THE REPORT?
Our Clients Speak
We asked them to research ‘ Equipment market’ all over the world, and their whole arrangement was helpful to us. thehealthanalytics.com insightful analysis and reports contributed to our current analysis and in creating a future strategy. Besides, the te
Yosuke Mitsui
Senior Associate Construction Equipment Sales & Marketing
We asked them to research ‘Equipment market’ all over the world, and their whole arrangement was helpful to us. thehealthanalytics.com insightful analysis and reports contributed to our current analysis and in creating a future strategy. Besides, the te


