

Base Year Value ()
x.x %
x.x %
CAGR ()
x.x %
x.x %
Forecast Year Value ()
x.x %
x.x %
Historical Data Period
Largest Region
Forecast Period
サイディング市場:材質別(ビニール、繊維セメント、木材、その他)、最終用途産業別(住宅、非住宅)および地域別(北米、ヨーロッパ、アジア太平洋、南米、中東、アフリカ)、2022年から2029年までの世界的な傾向と予測
Instant access to hundreds of data points and trends
- Market estimates from 2014-2029
- Competitive analysis, industry segmentation, financial benchmarks
- Incorporates SWOT, Porter's Five Forces and risk management frameworks
- PDF report or online database with Word, Excel and PowerPoint export options
- 100% money back guarantee
サイディング市場の概要
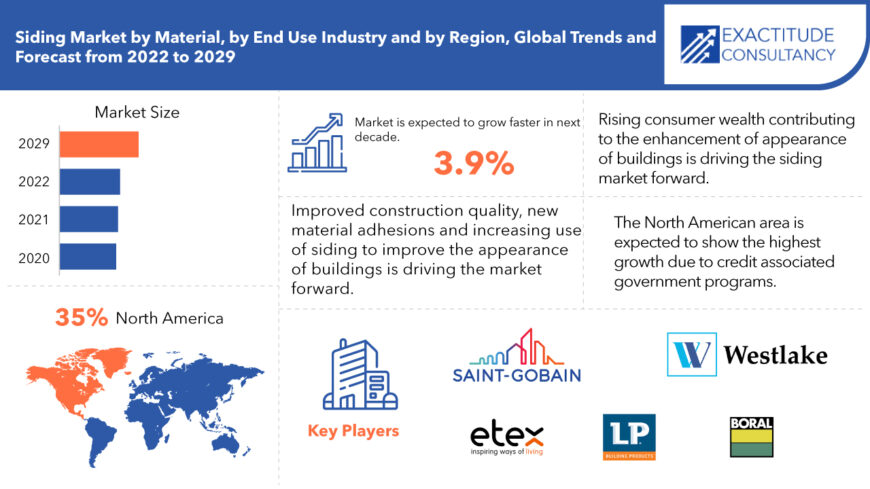
世界のサイディング市場は、2022年から2029年にかけて3.9%のCAGRで成長すると予想されています。2020年の1018.6億米ドルから2029年には1424.8億米ドルを超えると予想されています。
建物を太陽、風、雨から守るために外壁に使用される保護材は、サイディングとして知られています。サイディングは、熱損失を防ぎ、建物の温度を一定に保つために使用されます。サイディングには、水平ラップサイディング、垂直ボードサイディング、下見板張り、屋根板など、さまざまなスタイルがあります。サイディングにより、建物の建築的な素晴らしさがさらに高まります。サイディングは、木材、ビニール、石、繊維、複合サイディングなど、使用される材料に基づいて、多数のカテゴリに分類されます。サイディングは、巨大な建物の装飾や耐候性に使用される外壁被覆材として認識されています。住宅構造や小さなアパートでは、これらのサイディング材の需要が高まっています。
| 属性 | 詳細 |
| 研究期間 | 2020-2029 |
| 基準年 | 2021 |
| 推定年 | 2022 |
| 予測年 | 2022-2029 |
| 歴史的期間 | 2018-2020 |
| ユニット | 価値(百万米ドル)、(百万平方フィート) |
| セグメンテーション | 材質別、最終用途産業別、地域別 |
| 素材別 |
|
| 最終用途産業別 |
|
| 地域別 |
|
世界中の住宅建築の大幅な発展により、これらの構造物の外壁にサイディングを使用することが、サイディング業界の重要な成長原動力であると考えられています。多くの国でインフラ開発が進むことで、サイディング業界が前進しています。サイディング市場、特に木材および繊維サイディング市場は、人口増加と住宅および商業ビル開発の需要によって牽引されています。建築部門では、化学物質への曝露に耐えることができ、気象条件の変化に耐える耐候性材料として利用できるサイディング材料の需要が高まっています。
さらに、消費者の富の増加と、建物の外観を向上させるためにサイディングを採用する傾向の高まりは、サイディング市場の重要な発展の原動力となる可能性があります。さらに、木材、繊維、プラスチックなど、利用可能なサイディング材料の選択肢が広いため、市場の可能性が広がります。その結果、これらのオプションはサイディング業界の成長の原動力としても機能します。ただし、サイディング材料に関する知識の欠如は、サイディング部門にとって大きな障害となる可能性があります。
[キャプション id="attachment_10011" align="aligncenter" width="870"]
Frequently Asked Questions
• What is the worth of global Siding market?
The Siding market size had crossed USD 101.86 billion in 2020 and will observe a CAGR of more than 3.9% up to 2029 driven by the rising technological advancements.
• What is the share of the North America Siding industry?
North America held more than 35% of the Siding market revenue share in 2021 and will witness expansion.
• What are the drivers, restraints and challenges for Siding market, globally?
Usage of siding in the external walls in residential building is a key driver for the siding market. Rising consumer wealth contributing to the enhancement of appearance of buildings is driving the siding market forward. The North American area is expected to show the highest growth due to credit associated government programs. Improved construction quality, new material adhesions and increasing use of siding to improve the appearance of buildings is driving the market forward.
• Which are the top companies to hold the market share in Siding market?
Compagnie de Saint-Gobain S.A., Westlake Chemical, Louisiana Pacific Corporation, Etex Group, Boral Limited, James Hardie Industries PLC, Nichiha Corporation, Cornerstone Building Brands, SHERA are the key players in the siding market. These companies have developed methods to improve their product portfolios, market presence, and growth prospects in the siding industry.
• Which is the largest regional market for Siding market?
North America is the largest market for the Siding market.
• On the basis of material, which segment witnessed the highest growth in the Siding market?
Fiber cement siding dominated the market in terms of material. It is mostly used for siding in residential and non-residential structures, and it has a 50-year lifespan. Fiber cement siding is cost-effective and may be put in areas with harsh weather. Because of its unusual makeup, it may expand and compress.
Siding Market Segment Analysis
The siding market can be divided on the basis of material into vinyl, fiber cement, wood and others. Fiber cement siding dominated the market in terms of material. It is mostly used for siding in residential and non-residential structures, and it has a 50-year lifespan. Fiber cement siding is cost-effective and may be put in areas with harsh weather. Because of its unusual makeup, it may expand and compress. The fibre in the cement makes it stronger and longer-lasting. It also inhibits the formation of surface fractures. Fiber cement is used to replace asbestos cement, which has been linked to cancer in humans.
On the basis of end use industry into residential and non-residential segments. Siding improves a building's visual appeal while also providing features like durability and protection from intense weathering, which has fueled the residential sector. Other advantages, including as fire resistance and good thermal efficiency, will drive up demand for siding. Fiber cement, vinyl, bricks, and wood are the most popular materials for residential siding. Fiber cement siding is popular for residential siding because of its low cost, great durability, and aesthetic appeal. The favourable and flexible financing policies implemented by governments across all areas are boosting the sales of residential building projects, which is fueling the growth of the residential segment in the siding market.
[caption id="attachment_10012" align="alignleft" width="680"]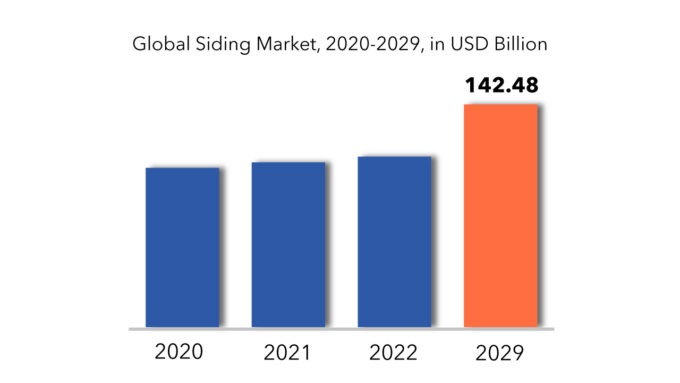
Siding Market Players
Compagnie de Saint-Gobain S.A., Westlake Chemical, Louisiana Pacific Corporation, Etex Group, Boral Limited, James Hardie Industries PLC, Nichiha Corporation, Cornerstone Building Brands, SHERA are the key players in the siding market. These companies have developed methods to improve their product portfolios, market presence, and growth prospects in the siding industry.
- Westlake Chemical purchased NAKAN, a worldwide compounding solutions company, in January 2019 to expand its manufacturing and research facilities in China, Germany, France, Japan, Mexico, Italy, the United States, Vietnam, and Spain. NAKAN's products are used in a variety of sectors, including automotive, medical, and building and construction.
- LP Building Solutions announced the addition of two new products to its portfolio in January 2019, LP SmartSide Smooth Trim & Siding and LP WeatherLogic Air & Water Barrier. These goods are part of a line of solution-oriented solutions for homeowners and construction professionals.
Who Should Buy? Or Key Stakeholders
- Siding Manufacturers
- Siding traders
- Government Contractors
- Architects and Engineers
- Market Consulting Firms
- Regulatory Bodies
- Research Organizations
Siding Market Regional Analysis
The Siding market by region includes North America, Asia-Pacific (APAC), Europe, South America, and Middle East & Africa (MEA).
- North America: includes the US, Canada, Mexico
- Asia Pacific: includes China, Japan, South Korea, India, Australia, ASEAN and Rest of APAC
- Europe: includes UK, Germany, France, Italy, Spain, Russia, and Rest of Europe
- South America: includes Brazil, Argentina and Rest of South America
- Middle East & Africa: includes Turkey, UAE, Saudi Arabia, South Africa, and Rest of MEA
In 2020, the North American area retained the biggest market share, thanks to a comeback in the residential and non-residential building sectors. In addition, the siding market in this area is expected to increase at the fastest rate in terms of value from 2022 to 2029. The region's sidings market is predicted to grow as a result of a slew of government programmes, including the Home Renovation Tax Credit and the Home Energy Loan Program (HELP), which encourage homeowners to install energy-efficient siding.
[caption id="attachment_10013" align="alignleft" width="680"]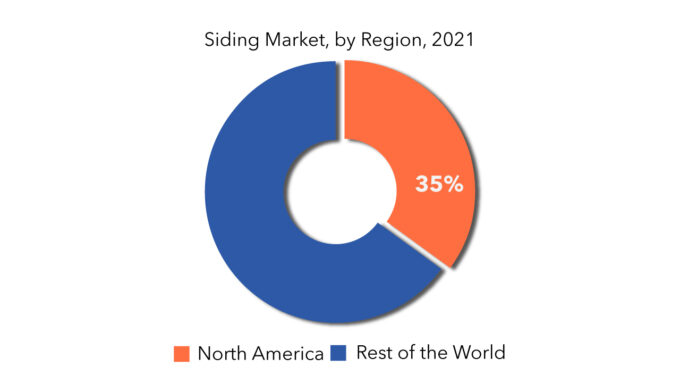
Key Market Segments: Siding Market
Siding Market by Material, 2020-2029, (USD Million), (Million Square Feet)- Vinyl
- Fiber Cement
- Wood
- Others (Stucco, Brick, and Stone)
- Residential
- Non-Residential
- North America
- Europe
- Asia Pacific
- South America
- Middle East and Africa
Key Question Answered
- What is the current size of the Siding market?
- What are the key factors influencing the growth of Siding?
- What are the major end use industries for Siding?
- Who are the major key players in the Siding market?
- Which region will provide more business opportunities for Siding in future?
- Which segment holds the maximum share of the Siding market?
- 導入
- 市場の定義
- 市場セグメンテーション
- 研究タイムライン
- 前提と制限
- 研究方法
- データマイニング
- 二次調査
- 一次研究
- 専門家のアドバイス
- 品質チェック
- 最終レビュー
- データの三角測量
- ボトムアップアプローチ
- トップダウンアプローチ
- 研究の流れ
- データソース
- データマイニング
- エグゼクティブサマリー
- 市場概要
- 世界のサイディング市場の見通し
- 市場の推進要因
- 市場の制約
- 市場機会
- サイディング市場へのCOVID-19の影響
- ポーターの5つの力モデル
- 新規参入者からの脅威
- 代替品からの脅威
- サプライヤーの交渉力
- 顧客の交渉力
- 競争の度合い
- 業界バリューチェーン分析
- 世界のサイディング市場の見通し
- 世界のサイディング市場(材質別)(百万米ドル)(百万平方フィート)
- ビニール
- ファイバーセメント
- 木材
- その他(漆喰、レンガ、石)
- 最終用途産業別世界サイディング市場 (百万米ドル) (百万平方フィート)
- 居住の
- 非住宅
- 地域別世界サイディング市場 (百万米ドル) (百万平方フィート)
- 北米
- 私たち
- カナダ
- メキシコ
- 南アメリカ
- ブラジル
- アルゼンチン
- コロンビア
- 南米のその他の地域
- ヨーロッパ
- ドイツ
- 英国
- フランス
- イタリア
- スペイン
- ロシア
- その他のヨーロッパ
- アジア太平洋
- インド
- 中国
- 日本
- 韓国
- オーストラリア
- 東南アジア
- その他のアジア太平洋地域
- 中東およびアフリカ
- アラブ首長国連邦
- サウジアラビア
- 南アフリカ
- その他の中東およびアフリカ
- 北米
- 会社概要*(事業概要、会社概要、提供資料、最近の動向)
- サンゴバン社
- ウェストレイクケミカル
- ルイジアナ・パシフィック・コーポレーション
- エテックスグループ
- ボラルリミテッド
- ジェームス・ハーディ・インダストリーズPLC
- ニチハ株式会社
- コーナーストーンビルディングブランド
- SHERA *企業リストは参考です
表のリスト
TABLE 1 GLOBAL SIDING MARKET BY MATERIAL (USD MILLIONS) 2020-2029
TABLE 2 GLOBAL SIDING MARKET BY MATERIAL (MILLION SQUARE FEET) 2020-2029
TABLE 3 GLOBAL SIDING MARKET BY END USE INDUSTRY (USD MILLIONS) 2020-2029
TABLE 4 GLOBAL SIDING MARKET BY END USE INDUSTRY (MILLION SQUARE FEET) 2020-2029
TABLE 5 GLOBAL SIDING MARKET BY REGION (USD MILLIONS) 2020-2029
TABLE 6 GLOBAL SIDING MARKET BY REGION (MILLION SQUARE FEET) 2020-2029
TABLE 7 US SIDING MARKET BY MATERIAL (USD MILLIONS) 2020-2029
TABLE 8 US SIDING MARKET BY MATERIAL (MILLION SQUARE FEET) 2020-2029
TABLE 9 US SIDING MARKET BY END USE INDUSTRY (USD MILLIONS) 2020-2029
TABLE 10 US SIDING MARKET BY END USE INDUSTRY (MILLION SQUARE FEET) 2020-2029
TABLE 11 CANADA SIDING MARKET BY MATERIAL (USD MILLIONS) 2020-2029
TABLE 12 CANADA SIDING MARKET BY MATERIAL (MILLION SQUARE FEET) 2020-2029
TABLE 13 CANADA SIDING MARKET BY END USE INDUSTRY (USD MILLIONS) 2020-2029
TABLE 14 CANADA SIDING MARKET BY END USE INDUSTRY (MILLION SQUARE FEET) 2020-2029
TABLE 15 MEXICO SIDING MARKET BY MATERIAL (USD MILLIONS) 2020-2029
TABLE 16 MEXICO SIDING MARKET BY MATERIAL (MILLION SQUARE FEET) 2020-2029
TABLE 17 MEXICO SIDING MARKET BY END USE INDUSTRY (USD MILLIONS) 2020-2029
TABLE 18 MEXICO SIDING MARKET BY END USE INDUSTRY (MILLION SQUARE FEET) 2020-2029
TABLE 19 BRAZIL SIDING MARKET BY MATERIAL (USD MILLIONS) 2020-2029
TABLE 20 BRAZIL SIDING MARKET BY MATERIAL (MILLION SQUARE FEET) 2020-2029
TABLE 21 BRAZIL SIDING MARKET BY END USE INDUSTRY (USD MILLIONS) 2020-2029
TABLE 22 BRAZIL SIDING MARKET BY END USE INDUSTRY (MILLION SQUARE FEET) 2020-2029
TABLE 23 ARGENTINA SIDING MARKET BY MATERIAL (USD MILLIONS) 2020-2029
TABLE 24 ARGENTINA SIDING MARKET BY MATERIAL (MILLION SQUARE FEET) 2020-2029
TABLE 25 ARGENTINA SIDING MARKET BY END USE INDUSTRY (USD MILLIONS) 2020-2029
TABLE 26 ARGENTINA SIDING MARKET BY END USE INDUSTRY (MILLION SQUARE FEET) 2020-2029
TABLE 27 COLOMBIA SIDING MARKET BY MATERIAL (USD MILLIONS) 2020-2029
TABLE 28 COLOMBIA SIDING MARKET BY MATERIAL (MILLION SQUARE FEET) 2020-2029
TABLE 29 COLOMBIA SIDING MARKET BY END USE INDUSTRY (USD MILLIONS) 2020-2029
TABLE 30 COLOMBIA SIDING MARKET BY END USE INDUSTRY (MILLION SQUARE FEET) 2020-2029
TABLE 31 REST OF SOUTH AMERICA SIDING MARKET BY MATERIAL (USD MILLIONS) 2020-2029
TABLE 32 REST OF SOUTH AMERICA SIDING MARKET BY MATERIAL (MILLION SQUARE FEET) 2020-2029
TABLE 33 REST OF SOUTH AMERICA SIDING MARKET BY END USE INDUSTRY (USD MILLIONS) 2020-2029
TABLE 34 REST OF SOUTH AMERICA SIDING MARKET BY END USE INDUSTRY (MILLION SQUARE FEET) 2020-2029
TABLE 35 INDIA SIDING MARKET BY MATERIAL (USD MILLIONS) 2020-2029
TABLE 36 INDIA SIDING MARKET BY MATERIAL (MILLION SQUARE FEET) 2020-2029
TABLE 37 INDIA SIDING MARKET BY END USE INDUSTRY (USD MILLIONS) 2020-2029
TABLE 38 INDIA SIDING MARKET BY END USE INDUSTRY (MILLION SQUARE FEET) 2020-2029
TABLE 39 CHINA SIDING MARKET BY MATERIAL (USD MILLIONS) 2020-2029
TABLE 40 CHINA SIDING MARKET BY MATERIAL (MILLION SQUARE FEET) 2020-2029
TABLE 41 CHINA SIDING MARKET BY END USE INDUSTRY (USD MILLIONS) 2020-2029
TABLE 42 CHINA SIDING MARKET BY END USE INDUSTRY (MILLION SQUARE FEET) 2020-2029
TABLE 43 JAPAN SIDING MARKET BY MATERIAL (USD MILLIONS) 2020-2029
TABLE 44 JAPAN SIDING MARKET BY MATERIAL (MILLION SQUARE FEET) 2020-2029
TABLE 45 JAPAN SIDING MARKET BY END USE INDUSTRY (USD MILLIONS) 2020-2029
TABLE 46 JAPAN SIDING MARKET BY END USE INDUSTRY (MILLION SQUARE FEET) 2020-2029
TABLE 47 SOUTH KOREA SIDING MARKET BY MATERIAL (USD MILLIONS) 2020-2029
TABLE 48 SOUTH KOREA SIDING MARKET BY MATERIAL (MILLION SQUARE FEET) 2020-2029
TABLE 49 SOUTH KOREA SIDING MARKET BY END USE INDUSTRY (USD MILLIONS) 2020-2029
TABLE 50 SOUTH KOREA SIDING MARKET BY END USE INDUSTRY (MILLION SQUARE FEET) 2020-2029
TABLE 51 AUSTRALIA SIDING MARKET BY MATERIAL (USD MILLIONS) 2020-2029
TABLE 52 AUSTRALIA SIDING MARKET BY MATERIAL (MILLION SQUARE FEET) 2020-2029
TABLE 53 AUSTRALIA SIDING MARKET BY END USE INDUSTRY (USD MILLIONS) 2020-2029
TABLE 54 AUSTRALIA SIDING MARKET BY END USE INDUSTRY (MILLION SQUARE FEET) 2020-2029
TABLE 55 SOUTH-EAST ASIA SIDING MARKET BY MATERIAL (USD MILLIONS) 2020-2029
TABLE 56 SOUTH-EAST ASIA SIDING MARKET BY MATERIAL (MILLION SQUARE FEET) 2020-2029
TABLE 57 SOUTH-EAST ASIA SIDING MARKET BY END USE INDUSTRY (USD MILLIONS) 2020-2029
TABLE 58 SOUTH-EAST ASIA SIDING MARKET BY END USE INDUSTRY (MILLION SQUARE FEET) 2020-2029
TABLE 59 REST OF ASIA PACIFIC SIDING MARKET BY MATERIAL (USD MILLIONS) 2020-2029
TABLE 60 REST OF ASIA PACIFIC SIDING MARKET BY MATERIAL (MILLION SQUARE FEET) 2020-2029
TABLE 61 REST OF ASIA PACIFIC SIDING MARKET BY END USE INDUSTRY (USD MILLIONS) 2020-2029
TABLE 62 REST OF ASIA PACIFIC SIDING MARKET BY END USE INDUSTRY (MILLION SQUARE FEET) 2020-2029
TABLE 63 GERMANY SIDING MARKET BY MATERIAL (USD MILLIONS) 2020-2029
TABLE 64 GERMANY SIDING MARKET BY MATERIAL (MILLION SQUARE FEET) 2020-2029
TABLE 65 GERMANY SIDING MARKET BY END USE INDUSTRY (USD MILLIONS) 2020-2029
TABLE 66 GERMANY SIDING MARKET BY END USE INDUSTRY (MILLION SQUARE FEET) 2020-2029
TABLE 67 UK SIDING MARKET BY MATERIAL (USD MILLIONS) 2020-2029
TABLE 68 UK SIDING MARKET BY MATERIAL (MILLION SQUARE FEET) 2020-2029
TABLE 69 UK SIDING MARKET BY END USE INDUSTRY (USD MILLIONS) 2020-2029
TABLE 70 UK SIDING MARKET BY END USE INDUSTRY (MILLION SQUARE FEET) 2020-2029
TABLE 71 FRANCE SIDING MARKET BY MATERIAL (USD MILLIONS) 2020-2029
TABLE 72 FRANCE SIDING MARKET BY MATERIAL (MILLION SQUARE FEET) 2020-2029
TABLE 73 FRANCE SIDING MARKET BY END USE INDUSTRY (USD MILLIONS) 2020-2029
TABLE 74 FRANCE SIDING MARKET BY END USE INDUSTRY (MILLION SQUARE FEET) 2020-2029
TABLE 75 ITALY SIDING MARKET BY MATERIAL (USD MILLIONS) 2020-2029
TABLE 76 ITALY SIDING MARKET BY MATERIAL (MILLION SQUARE FEET) 2020-2029
TABLE 77 ITALY SIDING MARKET BY END USE INDUSTRY (USD MILLIONS) 2020-2029
TABLE 78 ITALY SIDING MARKET BY END USE INDUSTRY (MILLION SQUARE FEET) 2020-2029
TABLE 79 SPAIN SIDING MARKET BY MATERIAL (USD MILLIONS) 2020-2029
TABLE 80 SPAIN SIDING MARKET BY MATERIAL (MILLION SQUARE FEET) 2020-2029
TABLE 81 SPAIN SIDING MARKET BY END USE INDUSTRY (USD MILLIONS) 2020-2029
TABLE 82 SPAIN SIDING MARKET BY END USE INDUSTRY (MILLION SQUARE FEET) 2020-2029
TABLE 83 RUSSIA SIDING MARKET BY MATERIAL (USD MILLIONS) 2020-2029
TABLE 84 RUSSIA SIDING MARKET BY MATERIAL (MILLION SQUARE FEET) 2020-2029
TABLE 85 RUSSIA SIDING MARKET BY END USE INDUSTRY (USD MILLIONS) 2020-2029
TABLE 86 RUSSIA SIDING MARKET BY END USE INDUSTRY (MILLION SQUARE FEET) 2020-2029
TABLE 87 REST OF EUROPE SIDING MARKET BY MATERIAL (USD MILLIONS) 2020-2029
TABLE 88 REST OF EUROPE SIDING MARKET BY MATERIAL (MILLION SQUARE FEET) 2020-2029
TABLE 89 REST OF EUROPE SIDING MARKET BY END USE INDUSTRY (USD MILLIONS) 2020-2029
TABLE 90 REST OF EUROPE SIDING MARKET BY END USE INDUSTRY (MILLION SQUARE FEET) 2020-2029
TABLE 91 UAE SIDING MARKET BY MATERIAL (USD MILLIONS) 2020-2029
TABLE 92 UAE SIDING MARKET BY MATERIAL (MILLION SQUARE FEET) 2020-2029
TABLE 93 UAE SIDING MARKET BY END USE INDUSTRY (USD MILLIONS) 2020-2029
TABLE 94 UAE SIDING MARKET BY END USE INDUSTRY (MILLION SQUARE FEET) 2020-2029
TABLE 95 SAUDI ARABIA SIDING MARKET BY MATERIAL (USD MILLIONS) 2020-2029
TABLE 96 SAUDI ARABIA SIDING MARKET BY MATERIAL (MILLION SQUARE FEET) 2020-2029
TABLE 97 SAUDI ARABIA SIDING MARKET BY END USE INDUSTRY (USD MILLIONS) 2020-2029
TABLE 98 SAUDI ARABIA SIDING MARKET BY END USE INDUSTRY (MILLION SQUARE FEET) 2020-2029
TABLE 99 SOUTH AFRICA SIDING MARKET BY MATERIAL (USD MILLIONS) 2020-2029
TABLE 100 SOUTH AFRICA SIDING MARKET BY MATERIAL (MILLION SQUARE FEET) 2020-2029
TABLE 101 SOUTH AFRICA SIDING MARKET BY END USE INDUSTRY (USD MILLIONS) 2020-2029
TABLE 102 SOUTH AFRICA SIDING MARKET BY END USE INDUSTRY (MILLION SQUARE FEET) 2020-2029
TABLE 103 REST OF MIDDLE EAST AND AFRICA SIDING MARKET BY MATERIAL (USD MILLIONS) 2020-2029
TABLE 104 REST OF MIDDLE EAST AND AFRICA SIDING MARKET BY MATERIAL (MILLION SQUARE FEET) 2020-2029
TABLE 105 REST OF MIDDLE EAST AND AFRICA SIDING MARKET BY END USE INDUSTRY (USD MILLIONS) 2020-2029
TABLE 106 REST OF MIDDLE EAST AND AFRICA SIDING MARKET BY END USE INDUSTRY (MILLION SQUARE FEET) 2020-2029
LIST OF FIGURES
FIGURE 1 MARKET DYNAMICS
FIGURE 2 MARKET SEGMENTATION
FIGURE 3 REPORT TIMELINES: YEARS CONSIDERED
FIGURE 4 DATA TRIANGULATION
FIGURE 5 BOTTOM-UP APPROACH
FIGURE 6 TOP-DOWN APPROACH
FIGURE 7 RESEARCH FLOW
FIGURE 8 GLOBAL SIDING MARKET BY MATERIAL, USD MILLION, 2020-2029
FIGURE 9 GLOBAL SIDING MARKET BY END-USER INDUSTRY, USD MILLION, 2020-2029
FIGURE 10 GLOBAL SIDING MARKET BY REGION, USD MILLION, 2020-2029
FIGURE 11 PORTER’S FIVE FORCES MODEL
FIGURE 12 NORTH AMERICA SIDING MARKET SNAPSHOT
FIGURE 13 EUROPE SIDING MARKET SNAPSHOT
FIGURE 14 ASIA PACIFIC SIDING MARKET SNAPSHOT
FIGURE 15 SOUTH AMERICA SIDING MARKET SNAPSHOT
FIGURE 16 MIDDLE EAST & AFRICA SIDING MARKET SNAPSHOT
FIGURE 17 COMPAGNIE DE SAINT-GOBAIN S.A.: COMPANY SNAPSHOT
FIGURE 18 WESTLAKE CHEMICAL: COMPANY SNAPSHOT
FIGURE 19 LOUISIANA PACIFIC CORPORATION: COMPANY SNAPSHOT
FIGURE 20 ETEX GROUP: COMPANY SNAPSHOT
FIGURE 21 BORAL LIMITED: COMPANY SNAPSHOT
FIGURE 22 JAMES HARDIE INDUSTRIES PLC: COMPANY SNAPSHOT
FIGURE 23 NICHIHA CORPORATION: COMPANY SNAPSHOT
FIGURE 24 CORNERSTONE BUILDING BRANDS: COMPANY SNAPSHOT
FIGURE 25 SHERA: COMPANY SNAPSHOT
DOWNLOAD FREE SAMPLE REPORT
License Type
SPEAK WITH OUR ANALYST
Want to know more about the report or any specific requirement?
WANT TO CUSTOMIZE THE REPORT?
Our Clients Speak
We asked them to research ‘ Equipment market’ all over the world, and their whole arrangement was helpful to us. thehealthanalytics.com insightful analysis and reports contributed to our current analysis and in creating a future strategy. Besides, the te
Yosuke Mitsui
Senior Associate Construction Equipment Sales & Marketing
We asked them to research ‘Equipment market’ all over the world, and their whole arrangement was helpful to us. thehealthanalytics.com insightful analysis and reports contributed to our current analysis and in creating a future strategy. Besides, the te


