

Base Year Value ()
x.x %
x.x %
CAGR ()
x.x %
x.x %
Forecast Year Value ()
x.x %
x.x %
Historical Data Period
Largest Region
Forecast Period
エラストマー膜市場:タイプ別(液体およびシート)、コンポーネント別(1成分および2成分)、用途別(屋根および壁、地下建設、湿地など)、エンドユーザー別(住宅、商業、インフラ、産業など)および地域別 2022年から2029年までの世界的な動向と予測
Instant access to hundreds of data points and trends
- Market estimates from 2014-2029
- Competitive analysis, industry segmentation, financial benchmarks
- Incorporates SWOT, Porter's Five Forces and risk management frameworks
- PDF report or online database with Word, Excel and PowerPoint export options
- 100% money back guarantee
エラストマー膜市場の概要
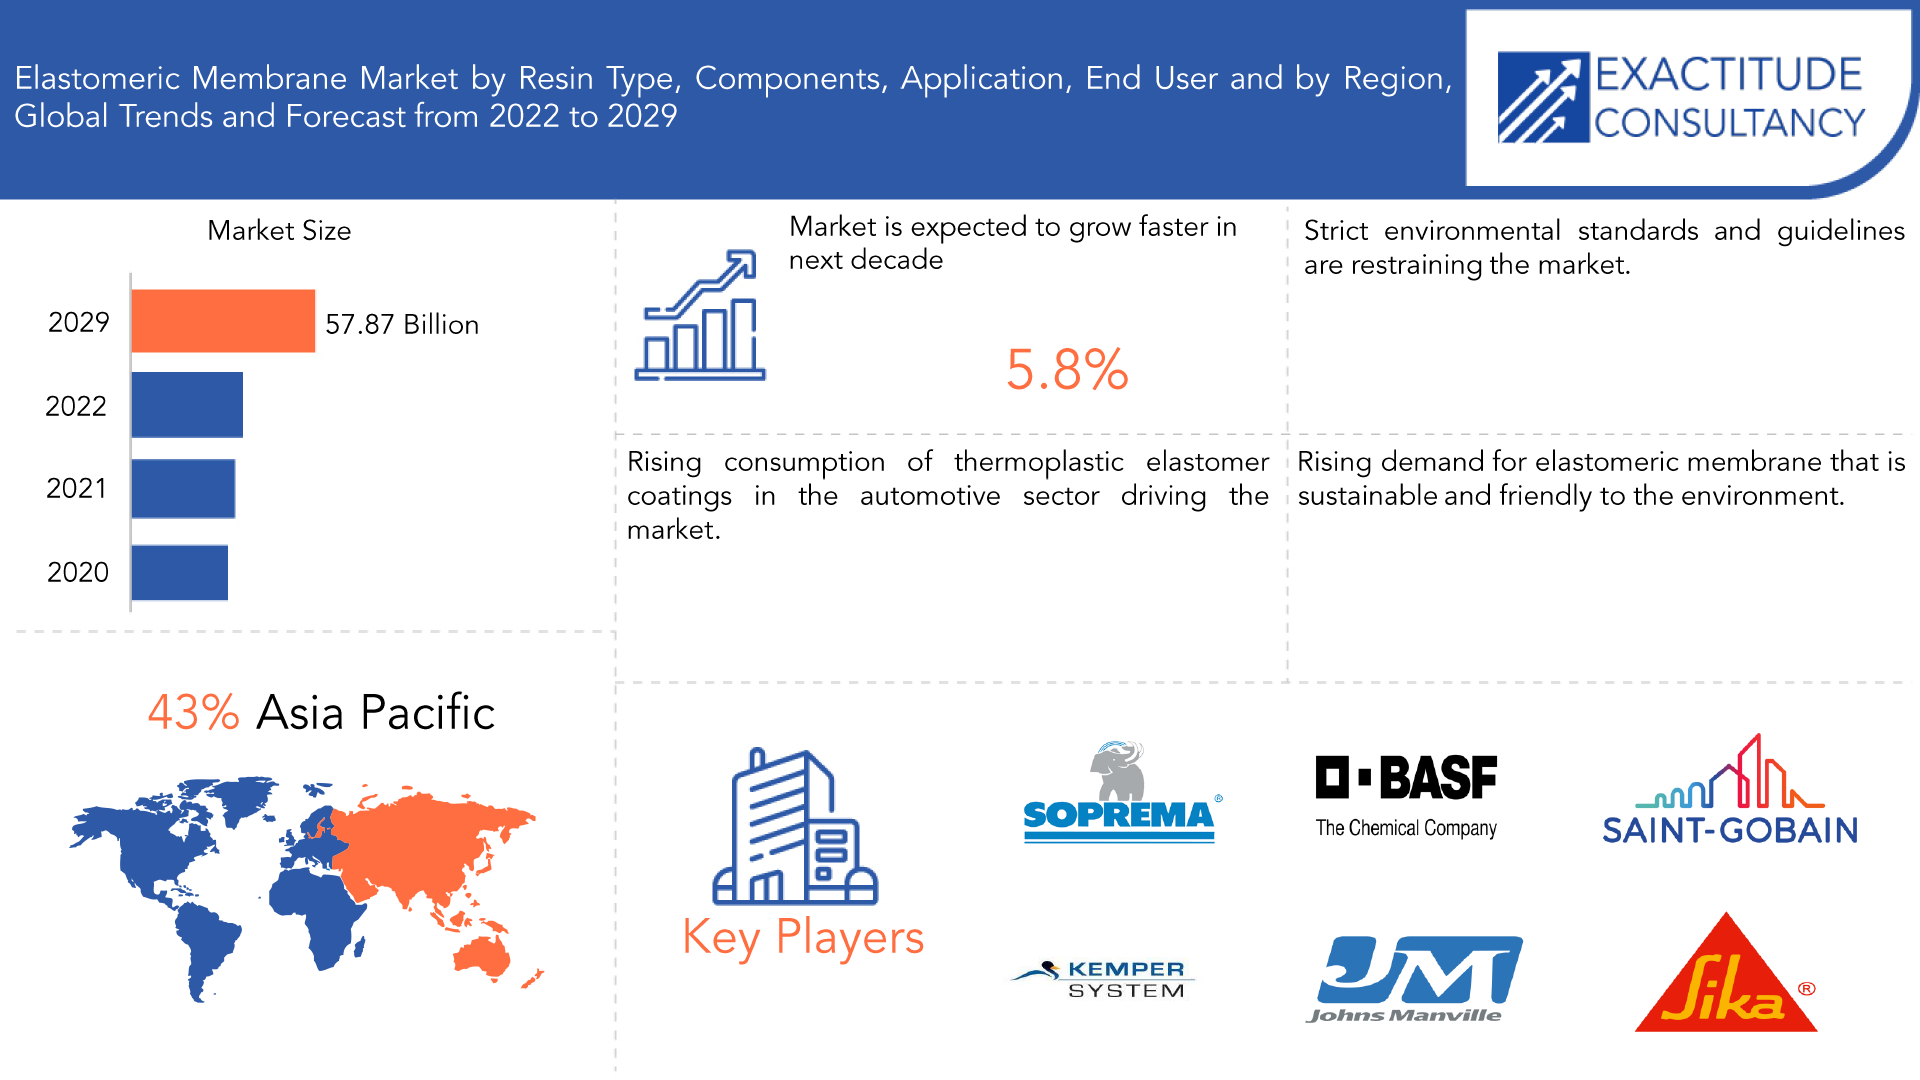
エラストマー膜市場は2020年に348億4,000万米ドルに達し、2029年まで5.8%のCAGRで拡大すると予想されています。
エラストマー膜屋根は、屋根にすっきりと磨き上げられた外観を与える魅力的な仕上げで、耐久性と耐湿性で知られています。白いエラストマー膜はますます一般的になりつつあり、現在では一部の行政区や都市で必須となっています。
エラストマー膜の市場は、環境への配慮と持続可能性の向上に向けた取り組みの高まり、およびエネルギー消費の削減に重点が置かれることによる「クールルーフ」の使用によって牽引されています。しかし、エラストマー膜市場は熟練労働者の不足によって阻害されると予想されています。
エラストマー膜の寿命は 25 ~ 30 年です。大きな平らな屋根や傾斜の少ない屋根には、メンテナンスがほとんど必要のないこの膜が使用されています。また、優れた弾力性により寒冷気候にも適しています。商業部門のエンド ユーザーは製品の耐久性を重視するため、エラストマー膜は商業部門で広く使用されています。屋根、壁、地下の建設現場、湿ったエリアなど、あらゆる場所でエラストマー膜が使用されています。
| 属性 | 詳細 |
| 研究期間 | 2020-2029 |
| 基準年 | 2021 |
| 推定年 | 2022 |
| 予測年 | 2022-2029 |
| 歴史的時代 | 2018-2020 |
| ユニット | 価値(10億米ドル) |
| セグメンテーション | タイプ別、コンポーネント別、アプリケーション別、エンドユーザー別、地域別。 |
| タイプ別 |
|
| コンポーネント別 |
|
| アプリケーション別 |
|
| エンドユーザー別 |
|
| 地域別 |
|
エネルギー消費の削減に重点が置かれるようになり、最近「クール ルーフ」という用語が生まれました。たとえば、連邦政府機関は、特定の領域で使用するすべての材料を、Energy Star のクール マテリアルの要件を満たすように選択しました。米国環境保護庁 (EPA) は、Energy Star プログラムを確立しました。このプログラムでは、材料フィルムが Energy Star に適合しているとみなされるには、基礎反射率が .65 で、3 年経過後の反射率が .50 である必要があります。そのため、計画グループは、クール マテリアルの要件に従って、利用可能な材料の代替品を検討する必要があります。
屋内構造で暖房日よりも冷房日数の方が長い環境では、クールルーフフレームワークが有利です。環境を改善し、エネルギーコストを削減します。クールルーフは、エラストマー膜を使用して実現されます。その結果、企業は新しい効果的なエラストマー膜を作成し、導入しています。たとえば、反射率の高い Sikalastic -560 は、Sika AG によって開発されました。これは、防水屋根用の安価で環境に優しい液体塗布膜です。同社は、Cool Roof Rating Council (CRRC) のメンバーでもあります。
二酸化炭素排出量を削減し、より環境に優しくなる必要性が高まる中、環境保護庁 (EPA) は屋根材にアスベストを使用することを許可するガイドラインをいくつか発行しました。米国グリーンビルディング協会によると、建物は直接的にも間接的にも汚染物質を排出し、二酸化炭素排出量の 40% を占めています。
エラストマー膜コーティングは、ペイントよりも安価な代替品であり、ペイントと同様に塗布されます。ただし、初心者や DIY では作業になりません。専門知識、知識、安全対策が必要であり、資格のある専門家のみが行う必要があります。専門家は、現場での経験に基づいてアドバイスを提供し、希望どおりの外観を実現できるよう支援します。
[キャプション id="attachment_15997" align="aligncenter" width="1920"]
Frequently Asked Questions
• What is the worth of global Elastomeric membranes market?
The Elastomeric membranes market reached USD 34.84 Billion in 2020 and is expected to grow at a CAGR of more than 5.8% through 2029, owing to the increasing technology.
• What are the upcoming trends of Elastomeric membranes market, globally?
The upcoming trend in the Elastomeric membranes market is an opportunity for market growth in enterprise applications.
• What is the CAGR of Elastomeric membranes market?
The global Elastomeric membranes market registered a CAGR of 5.8% from 2022 to 2029.
• Which are the top companies to hold the market share in Elastomeric membranes market?
Key players profiled in the report include BASF, SOPREMA, Sika Carlisle Companies Inc., GCP Applied Technologies, Inc. Kemper System, Firestone Building Products Company, Johns Manville, Saint-Gobain, and Standard Industries, Inc.
• Which is the largest regional market for Elastomeric membranes market?
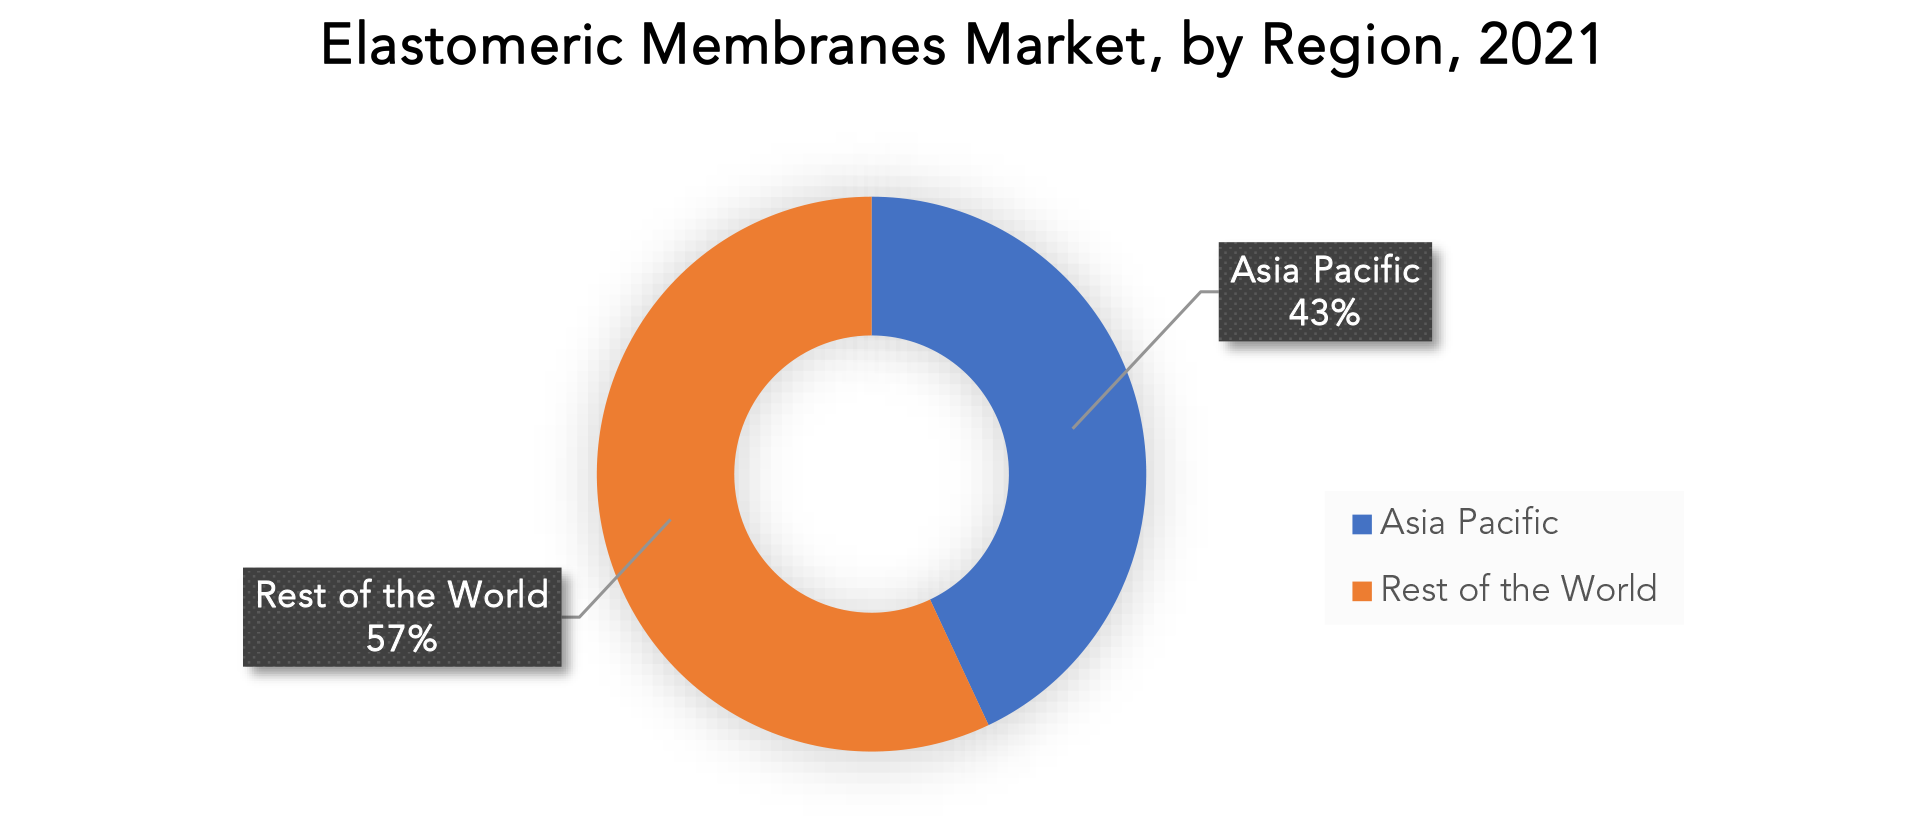
Asia Pacific dominates the market for elastomeric membranes. This market has the highest market share of 43% in the world.
Elastomeric Membranes Market Segment Analysis
Sheet, one of the segments analysed in the report, is projected to record 3.6% CAGR and reach USD 27.8 Billion by the end of the analysis period. Growth in the Liquid Applied segment is readjusted to a revised 4.8% CAGR for the following 8 years taking into account the ongoing post-pandemic recovery.
The global elastomeric membrane market is segmented into Roofs and Walls, Wet Areas, Underground Construction, and other segments based on application. The segment for roofs and walls is anticipated to hold the largest market share during the forecasted period. As a result of increased investment in non-residential developments like industrial, educational, and apartment buildings, the elastomeric membrane market for rooftops is anticipated to expand. Elastomeric coatings are advantageous for any roof because they provide a seamless layer. It also protects against UV rays and salty air.
The commercial construction segment is expected to grow significantly during the forecast period, accounting for more than 53% of the market share in 2021. Increased construction of commercial buildings such as institutional buildings, shopping malls, showrooms, corporate offices, and industrial buildings in both developed and developing countries is propelling the commercial construction segment forward. Rising foreign investment in the construction industry is also helping to drive market growth. According to FDI India data, Indian real estate attracted approximately USD 5 billion in institutional investments in 2021, and institutional real estate investments in India increased by 22% to USD 922 million in the first quarter of 2021.
[caption id="attachment_15998" align="aligncenter" width="1920"]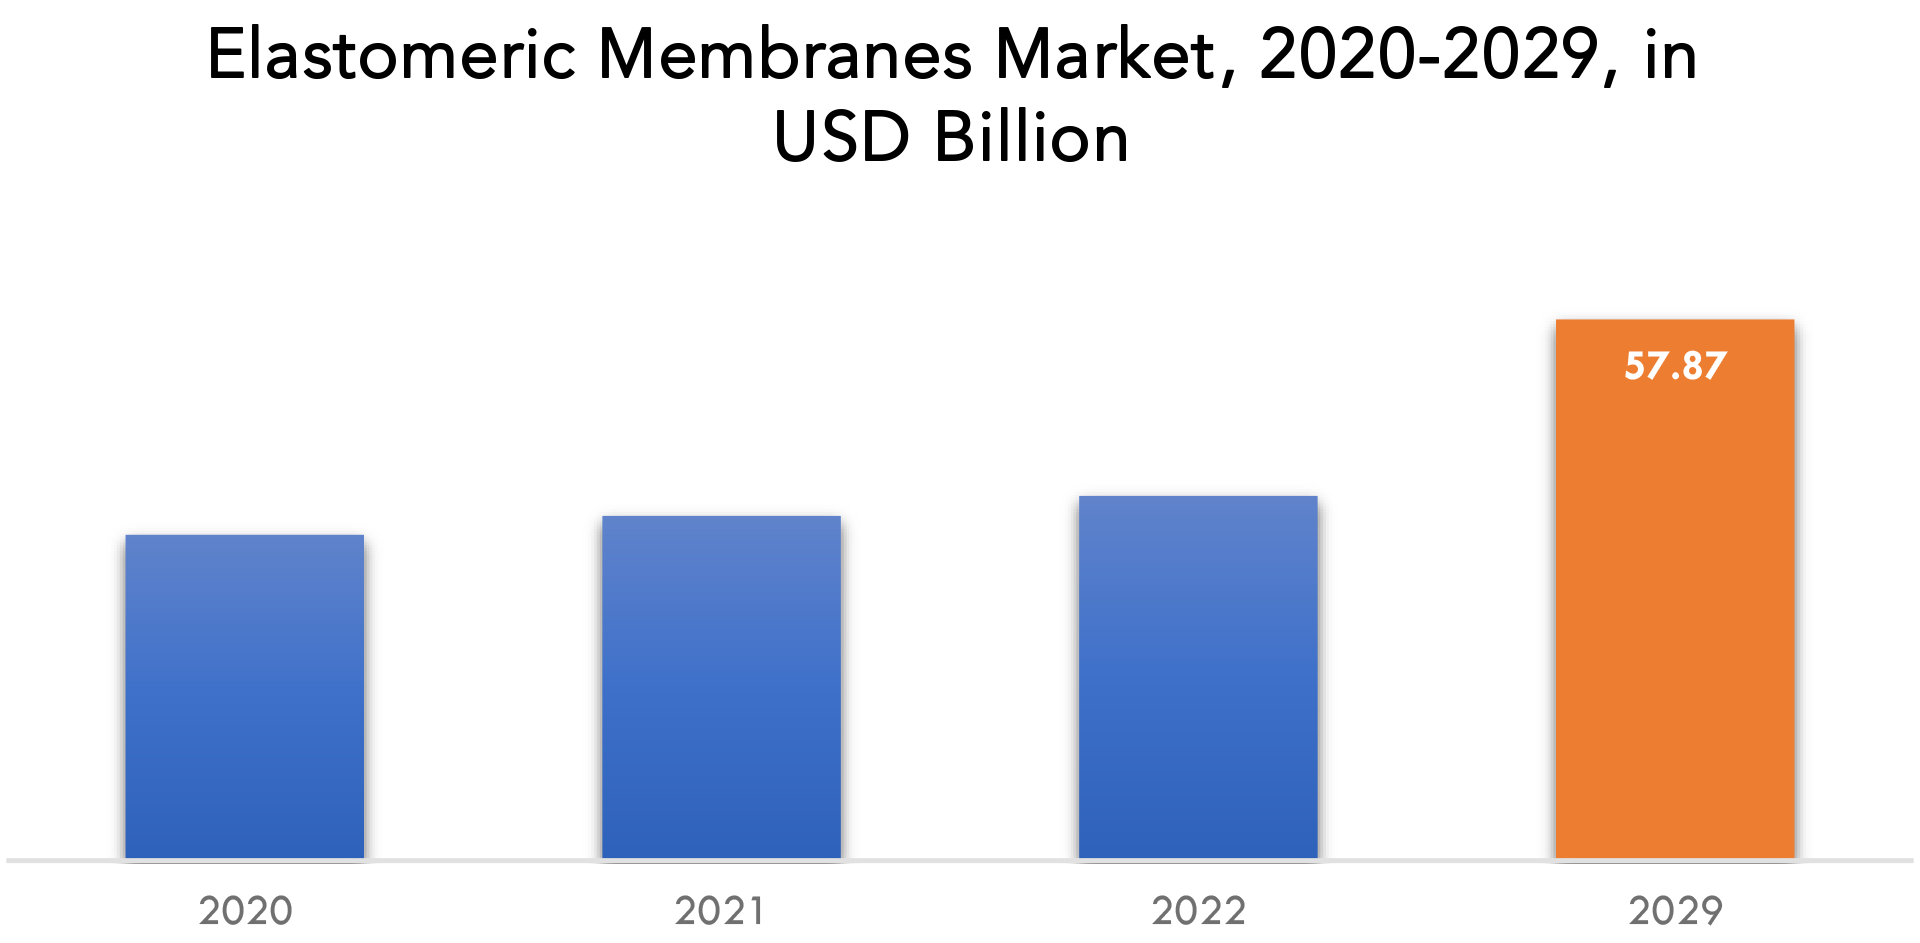
Elastomeric membranes Market Players
BASF, SOPREMA, Sika Carlisle Companies Inc., GCP Applied Technologies, Inc. Kemper System, Firestone Building Products Company, Johns Manville, Saint-Gobain, and Standard Industries, Inc. are key players in the elastomeric membranes market. Mergers and acquisitions, joint ventures, capacity expansions, major distribution, and branding decisions made by established industry players to increase market share and regional presence. They are also engaged in ongoing R&D activities to develop new Types and are working to expand the Type portfolio. This is expected to increase competition and put new market entrants at risk.
Industry Development
February 6, 2022, BASF showcased its market-leading products and sustainable solutions for all stages of the plastics journey at CHINAPLAS 2023: Make, Use, and Recycle. January 17, 2023, BASF has announced an investment in polymer dispersions capacity expansion at its Merak, Indonesia, production site. The expansion is in line with the growing trend of high-quality packaging in ASEAN, which is home to major paper and board manufacturers.Who Should Buy? Or Key stakeholders
- Research and development
- Technological Industry
- End Use industries
- Laboratories
- Construction
- Residential
- Automotive
- Industrial and Manufacturing
Elastomeric Membranes Market Regional Analysis
Geographically, the Elastomeric membranes market is segmented into North America, South America, Europe, APAC and MEA.
- North America: includes the US, Canada, Mexico
- Europe: includes UK, Germany, France, Italy, Spain, Russia, and Rest of Europe
- Asia Pacific: includes China, Japan, South Korea, India, Australia, ASEAN and Rest of APAC
- South America: includes Brazil, Argentina and Rest of South America
- Middle East & Africa: includes Turkey, UAE, Saudi Arabia, South Africa, and Rest of MEA
The construction industry in the Asia Pacific is projected to register a CAGR of more than 4.2% in the upcoming years. The high consumption of the elastomeric membrane in commercial malls, structures, rooftops, wet areas, etc. ensures steady demand in the Asia-Pacific region. The growing number of planned cities in Asia will also result in a continued rise in demand for elastomeric membrane. By 2026, the UN predicts that nearly half of all people in Asia will reside in urban areas.
The majority of the elastomeric membrane market is in North America, and it is influenced by US government standards and regulations for pollution management. The region's non-residential sector is growing quickly due to the growing industrialization of the US and Canada, which is hastening organisational development.
Key Market Segments: Elastomeric Membranes Market
Elastomeric Membranes Market By Type, 2020-2029, (USD Billion) (Kilotons)- Solid
- Liquid
- One Component
- Two Components
- Roofs And Walls
- Wet Areas
- Underground Construction
- Others
- Residential
- Commercial
- Industrial
- North America
- Europe
- Asia Pacific
- South America
- Middle East And Africa
Exactitude Consultancy Services Key Objectives:
- Increasing sales and market share
- Developing new technology
- Improving profitability
- Entering new markets
- Enhancing brand reputation
Key Question Answered
- What is the expected growth rate of the elastomeric membranes market over the next 5 years?
- Who are the major players in the elastomeric membranes market and what is their market share?
- What are the end-user industries driving demand for market and what is their outlook?
- What are the opportunities for growth in emerging markets such as Asia-pacific, middle east, and Africa?
- How is the economic environment affecting the elastomeric membranes market, including factors such as interest rates, inflation, and exchange rates?
- What is the expected impact of government policies and regulations on the elastomeric membranes market?
- What is the current and forecasted size and growth rate of the global elastomeric membranes market?
- What are the key drivers of growth in the elastomeric membranes market?
- Who are the major players in the market and what is their market share?
- What are the distribution channels and supply chain dynamics in the elastomeric membranes market?
- What are the technological advancements and innovations in the elastomeric membranes market and their impact on product development and growth?
- What are the regulatory considerations and their impact on the market?
- What are the challenges faced by players in the elastomeric membranes market and how are they addressing these challenges?
- What are the opportunities for growth and expansion in the elastomeric membranes market?
- What are the product offerings and specifications of leading players in the market?
- What is the pricing trend of elastomeric membranes in the market and what is the impact of raw material prices on the price trend?
- 導入
- 市場の定義
- 市場セグメンテーション
- 研究タイムライン
- 前提と制限
- 研究方法
- データマイニング
- 二次調査
- 一次研究
- 専門家のアドバイス
- 品質チェック
- 最終レビュー
- データ三角測量
- ボトムアップアプローチ
- トップダウンアプローチ
- 研究の流れ
- データソース
- データマイニング
- エグゼクティブサマリー
- 市場概要
- 世界のエラストマー膜市場の見通し
- 市場の推進要因
- 市場の制約
- 市場機会
- COVID-19 によるエラストマー膜市場への影響
- ポーターの5つの力モデル
- 新規参入からの脅威
- 代替選手からの脅威
- サプライヤーの交渉力
- 顧客の交渉力
- 競争の度合い
- 業界バリューチェーン分析
- 世界のエラストマー膜市場の見通し
- 2020年~2029年の世界エラストマー膜市場(タイプ別)(10億米ドル)(キロトン)
- 固体
- 液体
- 2020年~2029年の世界エラストマー膜市場(コンポーネント別)(10億米ドル)(キロトン)
- 1つのコンポーネント
- 2つのコンポーネント
- 世界のエラストマー膜市場、用途別、2020-2029年、(10億米ドル)(キロトン)
- 屋根と壁
- 湿ったエリア
- 地下建設
- その他
- エンドユーザー別世界エラストマー膜市場、2020-2029年、(10億米ドル)(キロトン)
- 居住の
- コマーシャル
- 工業用
- 世界のエラストマー膜市場(地域別)、2020年~2029年(10億米ドル)(キロトン)
- 北米
- 私たち
- カナダ
- メキシコ
- 南アメリカ
- ブラジル
- アルゼンチン
- コロンビア
- 南米のその他の地域
- ヨーロッパ
- ドイツ
- 英国
- フランス
- イタリア
- スペイン
- ロシア
- その他のヨーロッパ
- アジア太平洋
- インド
- 中国
- 日本
- 韓国
- オーストラリア
- 東南アジア
- その他のアジア太平洋地域
- 中東・アフリカ
- アラブ首長国連邦
- サウジアラビア
- 南アフリカ
- REST OF MIDDLE EAST AND AFRICA
- 北米
- COMPANY PROFILES*
(BUSINESS OVERVIEW, COMPANY SNAPSHOT, PRODUCTS OFFERED, RECENT DEVELOPMENTS)
- SOPREMA INC
- BASF SE
- SAINT-GOBAIN S.A.
- KEMPER SYSTEM
- JOHNS MANVILLE
- SIKA AG
- CARLISLE COMPANIES INC
- GCP APPLIED TECHNOLOGIES INC
- FIRESTONE BUILDING PRODUCTS
- KARNAK
*THE COMPANY LIST IS INDICATIVE
LIST OF TABLES
TABLE 1 GLOBAL ELASTOMERIC MEMBRANES MARKET BY TYPE (USD BILLION) 2020-2029
TABLE 2 GLOBAL ELASTOMERIC MEMBRANES MARKET BY TYPE (KILOTONS) 2020-2029
TABLE 3 GLOBAL ELASTOMERIC MEMBRANES MARKET BY COMPONENT (USD BILLION) 2020-2029
TABLE 4 GLOBAL ELASTOMERIC MEMBRANES MARKET BY COMPONENT (KILOTONS) 2020-2029
TABLE 5 GLOBAL ELASTOMERIC MEMBRANES MARKET BY APPLICATION (USD BILLION) 2020-2029
TABLE 6 GLOBAL ELASTOMERIC MEMBRANES MARKET BY APPLICATION (KILOTONS) 2020-2029
TABLE 7 GLOBAL ELASTOMERIC MEMBRANES MARKET BY END USER (USD BILLION) 2020-2029
TABLE 8 GLOBAL ELASTOMERIC MEMBRANES MARKET BY END USER (KILOTONS) 2020-2029
TABLE 9 GLOBAL ELASTOMERIC MEMBRANES MARKET BY REGION (USD BILLION) 2020-2029
TABLE 10 GLOBAL ELASTOMERIC MEMBRANES MARKET BY REGION (KILOTONS) 2020-2029
TABLE 11 NORTH AMERICA ELASTOMERIC MEMBRANES MARKET BY TYPE (USD BILLION) 2020-2029
TABLE 12 NORTH AMERICA ELASTOMERIC MEMBRANES MARKET BY TYPE (KILOTONS) 2020-2029
TABLE 13 NORTH AMERICA ELASTOMERIC MEMBRANES MARKET BY COMPONENT (USD BILLION) 2020-2029
TABLE 14 NORTH AMERICA ELASTOMERIC MEMBRANES MARKET BY COMPONENT (KILOTONS) 2020-2029
TABLE 15 NORTH AMERICA ELASTOMERIC MEMBRANES MARKET BY APPLICATION (USD BILLION) 2020-2029
TABLE 16 NORTH AMERICA ELASTOMERIC MEMBRANES MARKET BY APPLICATION (KILOTONS) 2020-2029
TABLE 17 NORTH AMERICA ELASTOMERIC MEMBRANES MARKET BY END USER (USD BILLION) 2020-2029
TABLE 18 NORTH AMERICA ELASTOMERIC MEMBRANES MARKET BY END USER (KILOTONS) 2020-2029
TABLE 19 NORTH AMERICA ELASTOMERIC MEMBRANES MARKET BY COUNTRY (USD BILLION) 2020-2029
TABLE 20 NORTH AMERICA ELASTOMERIC MEMBRANES MARKET BY COUNTRY (KILOTONS) 2020-2029
TABLE 21 US ELASTOMERIC MEMBRANES MARKET BY TYPE (USD BILLION) 2020-2029
TABLE 22 US ELASTOMERIC MEMBRANES MARKET BY TYPE (KILOTONS) 2020-2029
TABLE 23 US ELASTOMERIC MEMBRANES MARKET BY COMPONENT (USD BILLION) 2020-2029
TABLE 24 US ELASTOMERIC MEMBRANES MARKET BY COMPONENT (KILOTONS) 2020-2029
TABLE 25 US ELASTOMERIC MEMBRANES MARKET BY APPLICATION (USD BILLION) 2020-2029
TABLE 26 US ELASTOMERIC MEMBRANES MARKET BY APPLICATION (KILOTONS) 2020-2029
TABLE 27 US ELASTOMERIC MEMBRANES MARKET BY END USER (USD BILLION) 2020-2029
TABLE 28 US ELASTOMERIC MEMBRANES MARKET BY END USER (KILOTONS) 2020-2029
TABLE 29 CANADA ELASTOMERIC MEMBRANES MARKET BY TYPE (USD BILLION) 2020-2029
TABLE 30 CANADA ELASTOMERIC MEMBRANES MARKET BY TYPE (KILOTONS) 2020-2029
TABLE 31 CANADA ELASTOMERIC MEMBRANES MARKET BY COMPONENT (USD BILLION) 2020-2029
TABLE 32 CANADA ELASTOMERIC MEMBRANES MARKET BY COMPONENT (KILOTONS) 2020-2029
TABLE 33 CANADA ELASTOMERIC MEMBRANES MARKET BY APPLICATION (USD BILLION) 2020-2029
TABLE 34 CANADA ELASTOMERIC MEMBRANES MARKET BY APPLICATION (KILOTONS) 2020-2029
TABLE 35 CANADA ELASTOMERIC MEMBRANES MARKET BY END USER (USD BILLION) 2020-2029
TABLE 36 CANADA ELASTOMERIC MEMBRANES MARKET BY END USER (KILOTONS) 2020-2029
TABLE 37 MEXICO ELASTOMERIC MEMBRANES MARKET BY TYPE (USD BILLION) 2020-2029
TABLE 38 MEXICO ELASTOMERIC MEMBRANES MARKET BY TYPE (KILOTONS) 2020-2029
TABLE 39 MEXICO ELASTOMERIC MEMBRANES MARKET BY COMPONENT (USD BILLION) 2020-2029
TABLE 40 MEXICO ELASTOMERIC MEMBRANES MARKET BY COMPONENT (KILOTONS) 2020-2029
TABLE 41 MEXICO ELASTOMERIC MEMBRANES MARKET BY APPLICATION (USD BILLION) 2020-2029
TABLE 42 MEXICO ELASTOMERIC MEMBRANES MARKET BY APPLICATION (KILOTONS) 2020-2029
TABLE 43 MEXICO ELASTOMERIC MEMBRANES MARKET BY END USER (USD BILLION) 2020-2029
TABLE 44 MEXICO ELASTOMERIC MEMBRANES MARKET BY END USER (KILOTONS) 2020-2029
TABLE 45 SOUTH AMERICA ELASTOMERIC MEMBRANES MARKET BY TYPE (USD BILLION) 2020-2029
TABLE 46 SOUTH AMERICA ELASTOMERIC MEMBRANES MARKET BY TYPE (KILOTONS) 2020-2029
TABLE 47 SOUTH AMERICA ELASTOMERIC MEMBRANES MARKET BY COMPONENT (USD BILLION) 2020-2029
TABLE 48 SOUTH AMERICA ELASTOMERIC MEMBRANES MARKET BY COMPONENT (KILOTONS) 2020-2029
TABLE 49 SOUTH AMERICA ELASTOMERIC MEMBRANES MARKET BY APPLICATION (USD BILLION) 2020-2029
TABLE 50 SOUTH AMERICA ELASTOMERIC MEMBRANES MARKET BY APPLICATION (KILOTONS) 2020-2029
TABLE 51 SOUTH AMERICA ELASTOMERIC MEMBRANES MARKET BY END USER (USD BILLION) 2020-2029
TABLE 52 SOUTH AMERICA ELASTOMERIC MEMBRANES MARKET BY END USER (KILOTONS) 2020-2029
TABLE 53 SOUTH AMERICA ELASTOMERIC MEMBRANES MARKET BY COUNTRY (USD BILLION) 2020-2029
TABLE 54 SOUTH AMERICA ELASTOMERIC MEMBRANES MARKET BY COUNTRY (KILOTONS) 2020-2029
TABLE 55 BRAZIL ELASTOMERIC MEMBRANES MARKET BY TYPE (USD BILLION) 2020-2029
TABLE 56 BRAZIL ELASTOMERIC MEMBRANES MARKET BY TYPE (KILOTONS) 2020-2029
TABLE 57 BRAZIL ELASTOMERIC MEMBRANES MARKET BY COMPONENT (USD BILLION) 2020-2029
TABLE 58 BRAZIL ELASTOMERIC MEMBRANES MARKET BY COMPONENT (KILOTONS) 2020-2029
TABLE 59 BRAZIL ELASTOMERIC MEMBRANES MARKET BY APPLICATION (USD BILLION) 2020-2029
TABLE 60 BRAZIL ELASTOMERIC MEMBRANES MARKET BY APPLICATION (KILOTONS) 2020-2029
TABLE 61 BRAZIL ELASTOMERIC MEMBRANES MARKET BY END USER (USD BILLION) 2020-2029
TABLE 62 BRAZIL ELASTOMERIC MEMBRANES MARKET BY END USER (KILOTONS) 2020-2029
TABLE 63 ARGENTINA ELASTOMERIC MEMBRANES MARKET BY TYPE (USD BILLION) 2020-2029
TABLE 64 ARGENTINA ELASTOMERIC MEMBRANES MARKET BY TYPE (KILOTONS) 2020-2029
TABLE 65 ARGENTINA ELASTOMERIC MEMBRANES MARKET BY COMPONENT (USD BILLION) 2020-2029
TABLE 66 ARGENTINA ELASTOMERIC MEMBRANES MARKET BY COMPONENT (KILOTONS) 2020-2029
TABLE 67 ARGENTINA ELASTOMERIC MEMBRANES MARKET BY APPLICATION (USD BILLION) 2020-2029
TABLE 68 ARGENTINA ELASTOMERIC MEMBRANES MARKET BY APPLICATION (KILOTONS) 2020-2029
TABLE 69 ARGENTINA ELASTOMERIC MEMBRANES MARKET BY END USER (USD BILLION) 2020-2029
TABLE 70 ARGENTINA ELASTOMERIC MEMBRANES MARKET BY END USER (KILOTONS) 2020-2029
TABLE 71 COLOMBIA ELASTOMERIC MEMBRANES MARKET BY TYPE (USD BILLION) 2020-2029
TABLE 72 COLOMBIA ELASTOMERIC MEMBRANES MARKET BY TYPE (KILOTONS) 2020-2029
TABLE 73 COLOMBIA ELASTOMERIC MEMBRANES MARKET BY COMPONENT (USD BILLION) 2020-2029
TABLE 74 COLOMBIA ELASTOMERIC MEMBRANES MARKET BY COMPONENT (KILOTONS) 2020-2029
TABLE 75 COLOMBIA ELASTOMERIC MEMBRANES MARKET BY APPLICATION (USD BILLION) 2020-2029
TABLE 76 COLOMBIA ELASTOMERIC MEMBRANES MARKET BY APPLICATION (KILOTONS) 2020-2029
TABLE 77 COLOMBIA ELASTOMERIC MEMBRANES MARKET BY END USER (USD BILLION) 2020-2029
TABLE 78 COLOMBIA ELASTOMERIC MEMBRANES MARKET BY END USER (KILOTONS) 2020-2029
TABLE 79 REST OF SOUTH AMERICA ELASTOMERIC MEMBRANES MARKET BY TYPE (USD BILLION) 2020-2029
TABLE 80 REST OF SOUTH AMERICA ELASTOMERIC MEMBRANES MARKET BY TYPE (KILOTONS) 2020-2029
TABLE 81 REST OF SOUTH AMERICA ELASTOMERIC MEMBRANES MARKET BY COMPONENT (USD BILLION) 2020-2029
TABLE 82 REST OF SOUTH AMERICA ELASTOMERIC MEMBRANES MARKET BY COMPONENT (KILOTONS) 2020-2029
TABLE 83 REST OF SOUTH AMERICA ELASTOMERIC MEMBRANES MARKET BY APPLICATION (USD BILLION) 2020-2029
TABLE 84 REST OF SOUTH AMERICA ELASTOMERIC MEMBRANES MARKET BY APPLICATION (KILOTONS) 2020-2029
TABLE 85 REST OF SOUTH AMERICA ELASTOMERIC MEMBRANES MARKET BY END USER (USD BILLION) 2020-2029
TABLE 86 REST OF SOUTH AMERICA ELASTOMERIC MEMBRANES MARKET BY END USER (KILOTONS) 2020-2029
TABLE 87 ASIA PACIFIC ELASTOMERIC MEMBRANES MARKET BY TYPE (USD BILLION) 2020-2029
TABLE 88 ASIA PACIFIC ELASTOMERIC MEMBRANES MARKET BY TYPE (KILOTONS) 2020-2029
TABLE 89 ASIA PACIFIC ELASTOMERIC MEMBRANES MARKET BY COMPONENT (USD BILLION) 2020-2029
TABLE 90 ASIA PACIFIC ELASTOMERIC MEMBRANES MARKET BY COMPONENT (KILOTONS) 2020-2029
TABLE 91 ASIA PACIFIC ELASTOMERIC MEMBRANES MARKET BY APPLICATION (USD BILLION) 2020-2029
TABLE 92 ASIA PACIFIC ELASTOMERIC MEMBRANES MARKET BY APPLICATION (KILOTONS) 2020-2029
TABLE 93 ASIA PACIFIC ELASTOMERIC MEMBRANES MARKET BY END USER (USD BILLION) 2020-2029
TABLE 94 ASIA PACIFIC ELASTOMERIC MEMBRANES MARKET BY END USER (KILOTONS) 2020-2029
TABLE 95 ASIA PACIFIC ELASTOMERIC MEMBRANES MARKET BY COUNTRY (USD BILLION) 2020-2029
TABLE 96 ASIA PACIFIC ELASTOMERIC MEMBRANES MARKET BY COUNTRY (KILOTONS) 2020-2029
TABLE 97 INDIA ELASTOMERIC MEMBRANES MARKET BY TYPE (USD BILLION) 2020-2029
TABLE 98 INDIA ELASTOMERIC MEMBRANES MARKET BY TYPE (KILOTONS) 2020-2029
TABLE 99 INDIA ELASTOMERIC MEMBRANES MARKET BY COMPONENT (USD BILLION) 2020-2029
TABLE 100 INDIA ELASTOMERIC MEMBRANES MARKET BY COMPONENT (KILOTONS) 2020-2029
TABLE 101 INDIA ELASTOMERIC MEMBRANES MARKET BY APPLICATION (USD BILLION) 2020-2029
TABLE 102 INDIA ELASTOMERIC MEMBRANES MARKET BY APPLICATION (KILOTONS) 2020-2029
TABLE 103 INDIA ELASTOMERIC MEMBRANES MARKET BY END USER (USD BILLION) 2020-2029
TABLE 104 INDIA ELASTOMERIC MEMBRANES MARKET BY END USER (KILOTONS) 2020-2029
TABLE 105 CHINA ELASTOMERIC MEMBRANES MARKET BY TYPE (USD BILLION) 2020-2029
TABLE 106 CHINA ELASTOMERIC MEMBRANES MARKET BY TYPE (KILOTONS) 2020-2029
TABLE 107 CHINA ELASTOMERIC MEMBRANES MARKET BY COMPONENT (USD BILLION) 2020-2029
TABLE 108 CHINA ELASTOMERIC MEMBRANES MARKET BY COMPONENT (KILOTONS) 2020-2029
TABLE 109 CHINA ELASTOMERIC MEMBRANES MARKET BY APPLICATION (USD BILLION) 2020-2029
TABLE 110 CHINA ELASTOMERIC MEMBRANES MARKET BY APPLICATION (KILOTONS) 2020-2029
TABLE 111 CHINA ELASTOMERIC MEMBRANES MARKET BY END USER (USD BILLION) 2020-2029
TABLE 112 CHINA ELASTOMERIC MEMBRANES MARKET BY END USER (KILOTONS) 2020-2029
TABLE 113 JAPAN ELASTOMERIC MEMBRANES MARKET BY TYPE (USD BILLION) 2020-2029
TABLE 114 JAPAN ELASTOMERIC MEMBRANES MARKET BY TYPE (KILOTONS) 2020-2029
TABLE 115 JAPAN ELASTOMERIC MEMBRANES MARKET BY COMPONENT (USD BILLION) 2020-2029
TABLE 116 JAPAN ELASTOMERIC MEMBRANES MARKET BY COMPONENT (KILOTONS) 2020-2029
TABLE 117 JAPAN ELASTOMERIC MEMBRANES MARKET BY APPLICATION (USD BILLION) 2020-2029
TABLE 118 JAPAN ELASTOMERIC MEMBRANES MARKET BY APPLICATION (KILOTONS) 2020-2029
TABLE 119 JAPAN ELASTOMERIC MEMBRANES MARKET BY END USER (USD BILLION) 2020-2029
TABLE 120 JAPAN ELASTOMERIC MEMBRANES MARKET BY END USER (KILOTONS) 2020-2029
TABLE 121 SOUTH KOREA ELASTOMERIC MEMBRANES MARKET BY TYPE (USD BILLION) 2020-2029
TABLE 122 SOUTH KOREA ELASTOMERIC MEMBRANES MARKET BY TYPE (KILOTONS) 2020-2029
TABLE 123 SOUTH KOREA ELASTOMERIC MEMBRANES MARKET BY COMPONENT (USD BILLION) 2020-2029
TABLE 124 SOUTH KOREA ELASTOMERIC MEMBRANES MARKET BY COMPONENT (KILOTONS) 2020-2029
TABLE 125 SOUTH KOREA ELASTOMERIC MEMBRANES MARKET BY APPLICATION (USD BILLION) 2020-2029
TABLE 126 SOUTH KOREA ELASTOMERIC MEMBRANES MARKET BY APPLICATION (KILOTONS) 2020-2029
TABLE 127 SOUTH KOREA ELASTOMERIC MEMBRANES MARKET BY END USER (USD BILLION) 2020-2029
TABLE 128 SOUTH KOREA ELASTOMERIC MEMBRANES MARKET BY END USER (KILOTONS) 2020-2029
TABLE 129 AUSTRALIA ELASTOMERIC MEMBRANES MARKET BY TYPE (USD BILLION) 2020-2029
TABLE 130 AUSTRALIA ELASTOMERIC MEMBRANES MARKET BY TYPE (KILOTONS) 2020-2029
TABLE 131 AUSTRALIA ELASTOMERIC MEMBRANES MARKET BY COMPONENT (USD BILLION) 2020-2029
TABLE 132 AUSTRALIA ELASTOMERIC MEMBRANES MARKET BY COMPONENT (KILOTONS) 2020-2029
TABLE 133 AUSTRALIA ELASTOMERIC MEMBRANES MARKET BY APPLICATION (USD BILLION) 2020-2029
TABLE 134 AUSTRALIA ELASTOMERIC MEMBRANES MARKET BY APPLICATION (KILOTONS) 2020-2029
TABLE 135 AUSTRALIA ELASTOMERIC MEMBRANES MARKET BY END USER (USD BILLION) 2020-2029
TABLE 136 AUSTRALIA ELASTOMERIC MEMBRANES MARKET BY END USER (KILOTONS) 2020-2029
TABLE 137 SOUTH EAST ASIA ELASTOMERIC MEMBRANES MARKET BY TYPE (USD BILLION) 2020-2029
TABLE 138 SOUTH EAST ASIA ELASTOMERIC MEMBRANES MARKET BY TYPE (KILOTONS) 2020-2029
TABLE 139 SOUTH EAST ASIA ELASTOMERIC MEMBRANES MARKET BY COMPONENT (USD BILLION) 2020-2029
TABLE 140 SOUTH EAST ASIA ELASTOMERIC MEMBRANES MARKET BY COMPONENT (KILOTONS) 2020-2029
TABLE 141 SOUTH EAST ASIA ELASTOMERIC MEMBRANES MARKET BY APPLICATION (USD BILLION) 2020-2029
TABLE 142 SOUTH EAST ASIA ELASTOMERIC MEMBRANES MARKET BY APPLICATION (KILOTONS) 2020-2029
TABLE 143 SOUTH EAST ASIA ELASTOMERIC MEMBRANES MARKET BY END USER (USD BILLION) 2020-2029
TABLE 144 SOUTH EAST ASIA ELASTOMERIC MEMBRANES MARKET BY END USER (KILOTONS) 2020-2029
TABLE 145 REST OF ASIA PACIFIC ELASTOMERIC MEMBRANES MARKET BY TYPE (USD BILLION) 2020-2029
TABLE 146 REST OF ASIA PACIFIC ELASTOMERIC MEMBRANES MARKET BY TYPE (KILOTONS) 2020-2029
TABLE 147 REST OF ASIA PACIFIC ELASTOMERIC MEMBRANES MARKET BY COMPONENT (USD BILLION) 2020-2029
TABLE 148 REST OF ASIA PACIFIC ELASTOMERIC MEMBRANES MARKET BY COMPONENT (KILOTONS) 2020-2029
TABLE 149 REST OF ASIA PACIFIC ELASTOMERIC MEMBRANES MARKET BY APPLICATION (USD BILLION) 2020-2029
TABLE 150 REST OF ASIA PACIFIC ELASTOMERIC MEMBRANES MARKET BY APPLICATION (KILOTONS) 2020-2029
TABLE 151 REST OF ASIA PACIFIC ELASTOMERIC MEMBRANES MARKET BY END USER (USD BILLION) 2020-2029
TABLE 152 REST OF ASIA PACIFIC ELASTOMERIC MEMBRANES MARKET BY END USER (KILOTONS) 2020-2029
TABLE 153 EUROPE ELASTOMERIC MEMBRANES MARKET BY TYPE (USD BILLION) 2020-2029
TABLE 154 EUROPE ELASTOMERIC MEMBRANES MARKET BY TYPE (KILOTONS) 2020-2029
TABLE 155 EUROPE ELASTOMERIC MEMBRANES MARKET BY COMPONENT (USD BILLION) 2020-2029
TABLE 156 EUROPE ELASTOMERIC MEMBRANES MARKET BY COMPONENT (KILOTONS) 2020-2029
TABLE 157 EUROPE ELASTOMERIC MEMBRANES MARKET BY APPLICATION (USD BILLION) 2020-2029
TABLE 158 EUROPE ELASTOMERIC MEMBRANES MARKET BY APPLICATION (KILOTONS) 2020-2029
TABLE 159 EUROPE ELASTOMERIC MEMBRANES MARKET BY END USER (USD BILLION) 2020-2029
TABLE 160 EUROPE ELASTOMERIC MEMBRANES MARKET BY END USER (KILOTONS) 2020-2029
TABLE 161 EUROPE ELASTOMERIC MEMBRANES MARKET BY COUNTRY (USD BILLION) 2020-2029
TABLE 162 EUROPE ELASTOMERIC MEMBRANES MARKET BY COUNTRY (KILOTONS) 2020-2029
TABLE 163 GERMANY ELASTOMERIC MEMBRANES MARKET BY TYPE (USD BILLION) 2020-2029
TABLE 164 GERMANY ELASTOMERIC MEMBRANES MARKET BY TYPE (KILOTONS) 2020-2029
TABLE 165 GERMANY ELASTOMERIC MEMBRANES MARKET BY COMPONENT (USD BILLION) 2020-2029
TABLE 166 GERMANY ELASTOMERIC MEMBRANES MARKET BY COMPONENT (KILOTONS) 2020-2029
TABLE 167 GERMANY ELASTOMERIC MEMBRANES MARKET BY APPLICATION (USD BILLION) 2020-2029
TABLE 168 GERMANY ELASTOMERIC MEMBRANES MARKET BY APPLICATION (KILOTONS) 2020-2029
TABLE 169 GERMANY ELASTOMERIC MEMBRANES MARKET BY END USER (USD BILLION) 2020-2029
TABLE 170 GERMANY ELASTOMERIC MEMBRANES MARKET BY END USER (KILOTONS) 2020-2029
TABLE 171 UK ELASTOMERIC MEMBRANES MARKET BY TYPE (USD BILLION) 2020-2029
TABLE 172 UK ELASTOMERIC MEMBRANES MARKET BY TYPE (KILOTONS) 2020-2029
TABLE 173 UK ELASTOMERIC MEMBRANES MARKET BY COMPONENT (USD BILLION) 2020-2029
TABLE 174 UK ELASTOMERIC MEMBRANES MARKET BY COMPONENT (KILOTONS) 2020-2029
TABLE 175 UK ELASTOMERIC MEMBRANES MARKET BY APPLICATION (USD BILLION) 2020-2029
TABLE 176 UK ELASTOMERIC MEMBRANES MARKET BY APPLICATION (KILOTONS) 2020-2029
TABLE 177 UK ELASTOMERIC MEMBRANES MARKET BY END USER (USD BILLION) 2020-2029
TABLE 178 UK ELASTOMERIC MEMBRANES MARKET BY END USER (KILOTONS) 2020-2029
TABLE 179 FRANCE ELASTOMERIC MEMBRANES MARKET BY TYPE (USD BILLION) 2020-2029
TABLE 180 FRANCE ELASTOMERIC MEMBRANES MARKET BY TYPE (KILOTONS) 2020-2029
TABLE 181 FRANCE ELASTOMERIC MEMBRANES MARKET BY COMPONENT (USD BILLION) 2020-2029
TABLE 182 FRANCE ELASTOMERIC MEMBRANES MARKET BY COMPONENT (KILOTONS) 2020-2029
TABLE 183 FRANCE ELASTOMERIC MEMBRANES MARKET BY APPLICATION (USD BILLION) 2020-2029
TABLE 184 FRANCE ELASTOMERIC MEMBRANES MARKET BY APPLICATION (KILOTONS) 2020-2029
TABLE 185 FRANCE ELASTOMERIC MEMBRANES MARKET BY END USER (USD BILLION) 2020-2029
TABLE 186 FRANCE ELASTOMERIC MEMBRANES MARKET BY END USER (KILOTONS) 2020-2029
TABLE 187 ITALY ELASTOMERIC MEMBRANES MARKET BY TYPE (USD BILLION) 2020-2029
TABLE 188 ITALY ELASTOMERIC MEMBRANES MARKET BY TYPE (KILOTONS) 2020-2029
TABLE 189 ITALY ELASTOMERIC MEMBRANES MARKET BY COMPONENT (USD BILLION) 2020-2029
TABLE 190 ITALY ELASTOMERIC MEMBRANES MARKET BY COMPONENT (KILOTONS) 2020-2029
TABLE 191 ITALY ELASTOMERIC MEMBRANES MARKET BY APPLICATION (USD BILLION) 2020-2029
TABLE 192 ITALY ELASTOMERIC MEMBRANES MARKET BY APPLICATION (KILOTONS) 2020-2029
TABLE 193 ITALY ELASTOMERIC MEMBRANES MARKET BY END USER (USD BILLION) 2020-2029
TABLE 194 ITALY ELASTOMERIC MEMBRANES MARKET BY END USER (KILOTONS) 2020-2029
TABLE 195 SPAIN ELASTOMERIC MEMBRANES MARKET BY TYPE (USD BILLION) 2020-2029
TABLE 196 SPAIN ELASTOMERIC MEMBRANES MARKET BY TYPE (KILOTONS) 2020-2029
TABLE 197 SPAIN ELASTOMERIC MEMBRANES MARKET BY COMPONENT (USD BILLION) 2020-2029
TABLE 198 SPAIN ELASTOMERIC MEMBRANES MARKET BY COMPONENT (KILOTONS) 2020-2029
TABLE 199 SPAIN ELASTOMERIC MEMBRANES MARKET BY APPLICATION (USD BILLION) 2020-2029
TABLE 200 SPAIN ELASTOMERIC MEMBRANES MARKET BY APPLICATION (KILOTONS) 2020-2029
TABLE 201 SPAIN ELASTOMERIC MEMBRANES MARKET BY END USER (USD BILLION) 2020-2029
TABLE 202 SPAIN ELASTOMERIC MEMBRANES MARKET BY END USER (KILOTONS) 2020-2029
TABLE 203 RUSSIA ELASTOMERIC MEMBRANES MARKET BY TYPE (USD BILLION) 2020-2029
TABLE 204 RUSSIA ELASTOMERIC MEMBRANES MARKET BY TYPE (KILOTONS) 2020-2029
TABLE 205 RUSSIA ELASTOMERIC MEMBRANES MARKET BY COMPONENT (USD BILLION) 2020-2029
TABLE 206 RUSSIA ELASTOMERIC MEMBRANES MARKET BY COMPONENT (KILOTONS) 2020-2029
TABLE 207 RUSSIA ELASTOMERIC MEMBRANES MARKET BY APPLICATION (USD BILLION) 2020-2029
TABLE 208 RUSSIA ELASTOMERIC MEMBRANES MARKET BY APPLICATION (KILOTONS) 2020-2029
TABLE 209 RUSSIA ELASTOMERIC MEMBRANES MARKET BY END USER (USD BILLION) 2020-2029
TABLE 210 RUSSIA ELASTOMERIC MEMBRANES MARKET BY END USER (KILOTONS) 2020-2029
TABLE 211 REST OF EUROPE ELASTOMERIC MEMBRANES MARKET BY TYPE (USD BILLION) 2020-2029
TABLE 212 REST OF EUROPE ELASTOMERIC MEMBRANES MARKET BY TYPE (KILOTONS) 2020-2029
TABLE 213 REST OF EUROPE ELASTOMERIC MEMBRANES MARKET BY COMPONENT (USD BILLION) 2020-2029
TABLE 214 REST OF EUROPE ELASTOMERIC MEMBRANES MARKET BY COMPONENT (KILOTONS) 2020-2029
TABLE 215 REST OF EUROPE ELASTOMERIC MEMBRANES MARKET BY APPLICATION (USD BILLION) 2020-2029
TABLE 216 REST OF EUROPE ELASTOMERIC MEMBRANES MARKET BY APPLICATION (KILOTONS) 2020-2029
TABLE 217 REST OF EUROPE ELASTOMERIC MEMBRANES MARKET BY END USER (USD BILLION) 2020-2029
TABLE 218 REST OF EUROPE ELASTOMERIC MEMBRANES MARKET BY END USER (KILOTONS) 2020-2029
TABLE 219 MIDDLE EAST & AFRICA ELASTOMERIC MEMBRANES MARKET BY TYPE (USD BILLION) 2020-2029
TABLE 220 MIDDLE EAST & AFRICA ELASTOMERIC MEMBRANES MARKET BY TYPE (KILOTONS) 2020-2029
TABLE 221 MIDDLE EAST & AFRICA ELASTOMERIC MEMBRANES MARKET BY COMPONENT (USD BILLION) 2020-2029
TABLE 222 MIDDLE EAST & AFRICA ELASTOMERIC MEMBRANES MARKET BY COMPONENT (KILOTONS) 2020-2029
TABLE 223 MIDDLE EAST & AFRICA ELASTOMERIC MEMBRANES MARKET BY APPLICATION (USD BILLION) 2020-2029
TABLE 224 MIDDLE EAST & AFRICA ELASTOMERIC MEMBRANES MARKET BY APPLICATION (KILOTONS) 2020-2029
TABLE 225 MIDDLE EAST & AFRICA ELASTOMERIC MEMBRANES MARKET BY END USER (USD BILLION) 2020-2029
TABLE 226 MIDDLE EAST & AFRICA ELASTOMERIC MEMBRANES MARKET BY END USER (KILOTONS) 2020-2029
TABLE 227 MIDDLE EAST & AFRICA ELASTOMERIC MEMBRANES MARKET BY COUNTRY (USD BILLION) 2020-2029
TABLE 228 MIDDLE EAST & AFRICA ELASTOMERIC MEMBRANES MARKET BY COUNTRY (KILOTONS) 2020-2029
TABLE 229 UAE ELASTOMERIC MEMBRANES MARKET BY TYPE (USD BILLION) 2020-2029
TABLE 230 UAE ELASTOMERIC MEMBRANES MARKET BY TYPE (KILOTONS) 2020-2029
TABLE 231 UAE ELASTOMERIC MEMBRANES MARKET BY COMPONENT (USD BILLION) 2020-2029
TABLE 232 UAE ELASTOMERIC MEMBRANES MARKET BY COMPONENT (KILOTONS) 2020-2029
TABLE 233 UAE ELASTOMERIC MEMBRANES MARKET BY APPLICATION (USD BILLION) 2020-2029
TABLE 234 UAE ELASTOMERIC MEMBRANES MARKET BY APPLICATION (KILOTONS) 2020-2029
TABLE 235 UAE ELASTOMERIC MEMBRANES MARKET BY END USER (USD BILLION) 2020-2029
TABLE 236 UAE ELASTOMERIC MEMBRANES MARKET BY END USER (KILOTONS) 2020-2029
TABLE 237 SAUDI ARABIA ELASTOMERIC MEMBRANES MARKET BY TYPE (USD BILLION) 2020-2029
TABLE 238 SAUDI ARABIA ELASTOMERIC MEMBRANES MARKET BY TYPE (KILOTONS) 2020-2029
TABLE 239 SAUDI ARABIA ELASTOMERIC MEMBRANES MARKET BY COMPONENT (USD BILLION) 2020-2029
TABLE 240 SAUDI ARABIA ELASTOMERIC MEMBRANES MARKET BY COMPONENT (KILOTONS) 2020-2029
TABLE 241 SAUDI ARABIA ELASTOMERIC MEMBRANES MARKET BY APPLICATION (USD BILLION) 2020-2029
TABLE 242 SAUDI ARABIA ELASTOMERIC MEMBRANES MARKET BY APPLICATION (KILOTONS) 2020-2029
TABLE 243 SAUDI ARABIA ELASTOMERIC MEMBRANES MARKET BY END USER (USD BILLION) 2020-2029
TABLE 244 SAUDI ARABIA ELASTOMERIC MEMBRANES MARKET BY END USER (KILOTONS) 2020-2029
TABLE 245 SOUTH AFRICA ELASTOMERIC MEMBRANES MARKET BY TYPE (USD BILLION) 2020-2029
TABLE 246 SOUTH AFRICA ELASTOMERIC MEMBRANES MARKET BY TYPE (KILOTONS) 2020-2029
TABLE 247 SOUTH AFRICA ELASTOMERIC MEMBRANES MARKET BY COMPONENT (USD BILLION) 2020-2029
TABLE 248 SOUTH AFRICA ELASTOMERIC MEMBRANES MARKET BY COMPONENT (KILOTONS) 2020-2029
TABLE 249 SOUTH AFRICA ELASTOMERIC MEMBRANES MARKET BY APPLICATION (USD BILLION) 2020-2029
TABLE 250 SOUTH AFRICA ELASTOMERIC MEMBRANES MARKET BY APPLICATION (KILOTONS) 2020-2029
TABLE 251 SOUTH AFRICA ELASTOMERIC MEMBRANES MARKET BY END USER (USD BILLION) 2020-2029
TABLE 252 SOUTH AFRICA ELASTOMERIC MEMBRANES MARKET BY END USER (KILOTONS) 2020-2029
TABLE 253 REST OF MIDDLE EAST & AFRICA ELASTOMERIC MEMBRANES MARKET BY TYPE (USD BILLION) 2020-2029
TABLE 254 REST OF MIDDLE EAST & AFRICA ELASTOMERIC MEMBRANES MARKET BY TYPE (KILOTONS) 2020-2029
TABLE 255 REST OF MIDDLE EAST & AFRICA ELASTOMERIC MEMBRANES MARKET BY COMPONENT (USD BILLION) 2020-2029
TABLE 256 REST OF MIDDLE EAST & AFRICA ELASTOMERIC MEMBRANES MARKET BY COMPONENT (KILOTONS) 2020-2029
TABLE 257 REST OF MIDDLE EAST & AFRICA ELASTOMERIC MEMBRANES MARKET BY APPLICATION (USD BILLION) 2020-2029
TABLE 258 REST OF MIDDLE EAST & AFRICA ELASTOMERIC MEMBRANES MARKET BY APPLICATION (KILOTONS) 2020-2029
TABLE 259 REST OF MIDDLE EAST & AFRICA ELASTOMERIC MEMBRANES MARKET BY END USER (USD BILLION) 2020-2029
TABLE 260 REST OF MIDDLE EAST & AFRICA ELASTOMERIC MEMBRANES MARKET BY END USER (KILOTONS) 2020-2029
LIST OF FIGURES
FIGURE 1 MARKET DYNAMICS
FIGURE 2 MARKET SEGMENTATION
FIGURE 3 REPORT TIMELINES: YEARS CONSIDERED
FIGURE 4 DATA TRIANGULATION
FIGURE 5 BOTTOM-UP APPROACH
FIGURE 6 TOP-DOWN APPROACH
FIGURE 7 RESEARCH FLOW
FIGURE 8 GLOBAL ELASTOMERIC MEMBRANES MARKET BY TYPE, USD BILLION, 2020-2029
FIGURE 9 GLOBAL ELASTOMERIC MEMBRANES MARKET BY COMPONENT, USD BILLION, 2020-202
FIGURE 10 GLOBAL ELASTOMERIC MEMBRANES MARKET BY APPLICATION, USD BILLION, 2020-2029
FIGURE 11 GLOBAL ELASTOMERIC MEMBRANES MARKET BY END USER, USD BILLION, 2020-2029
FIGURE 12 GLOBAL ELASTOMERIC MEMBRANES MARKET BY REGION, USD BILLION, 2020-2029
FIGURE 13 PORTER’S FIVE FORCES MODEL
FIGURE 14 GLOBAL ELASTOMERIC MEMBRANES MARKET BY TYPE (USD BILLION), 2021
FIGURE 15 GLOBAL ELASTOMERIC MEMBRANES MARKET BY COMPONENT (USD BILLION), 2021
FIGURE 16 GLOBAL ELASTOMERIC MEMBRANES MARKET BY APPLICATION (USD BILLION), 2021
FIGURE 17 GLOBAL ELASTOMERIC MEMBRANES MARKET BY END USER (USD BILLION), 2021
FIGURE 18 GLOBAL ELASTOMERIC MEMBRANES MARKET BY REGION, USD BILLION, 2021
FIGURE 19 NORTH AMERICA ELASTOMERIC MEMBRANES MARKET SNAPSHOT
FIGURE 20 EUROPE ELASTOMERIC MEMBRANES MARKET SNAPSHOT
FIGURE 21 SOUTH AMERICA ELASTOMERIC MEMBRANES MARKET SNAPSHOT
FIGURE 22 ASIA PACIFIC ELASTOMERIC MEMBRANES MARKET SNAPSHOT
FIGURE 23 MIDDLE EAST ASIA AND AFRICA ELASTOMERIC MEMBRANES MARKET SNAPSHOT
FIGURE 24 MARKET SHARE ANALYSIS
FIGURE 25 SOPREMA INC: COMPANY SNAPSHOT
FIGURE 26 BASF SE: COMPANY SNAPSHOT
FIGURE 27 SAINT-GOBAIN S.A.: COMPANY SNAPSHOT
FIGURE 28 KEMPER SYSTEM: COMPANY SNAPSHOT
FIGURE 29 JOHNS MANVILLE: COMPANY SNAPSHOT
FIGURE 30 SIKA AG: COMPANY SNAPSHOT
FIGURE 31 CARLISLE COMPANIES INC: COMPANY SNAPSHOT
FIGURE 32 GCP APPLIED TECHNOLOGIES INC: COMPANY SNAPSHOT
FIGURE 33 FIRESTONE BUILDING PRODUCTS: COMPANY SNAPSHOT
FIGURE 34 KARNAK: COMPANY SNAPSHOT
DOWNLOAD FREE SAMPLE REPORT
License Type
SPEAK WITH OUR ANALYST
Want to know more about the report or any specific requirement?
WANT TO CUSTOMIZE THE REPORT?
Our Clients Speak
We asked them to research ‘ Equipment market’ all over the world, and their whole arrangement was helpful to us. thehealthanalytics.com insightful analysis and reports contributed to our current analysis and in creating a future strategy. Besides, the te
Yosuke Mitsui
Senior Associate Construction Equipment Sales & Marketing
We asked them to research ‘Equipment market’ all over the world, and their whole arrangement was helpful to us. thehealthanalytics.com insightful analysis and reports contributed to our current analysis and in creating a future strategy. Besides, the te


