

Base Year Value ()
x.x %
x.x %
CAGR ()
x.x %
x.x %
Forecast Year Value ()
x.x %
x.x %
Historical Data Period
Largest Region
Forecast Period
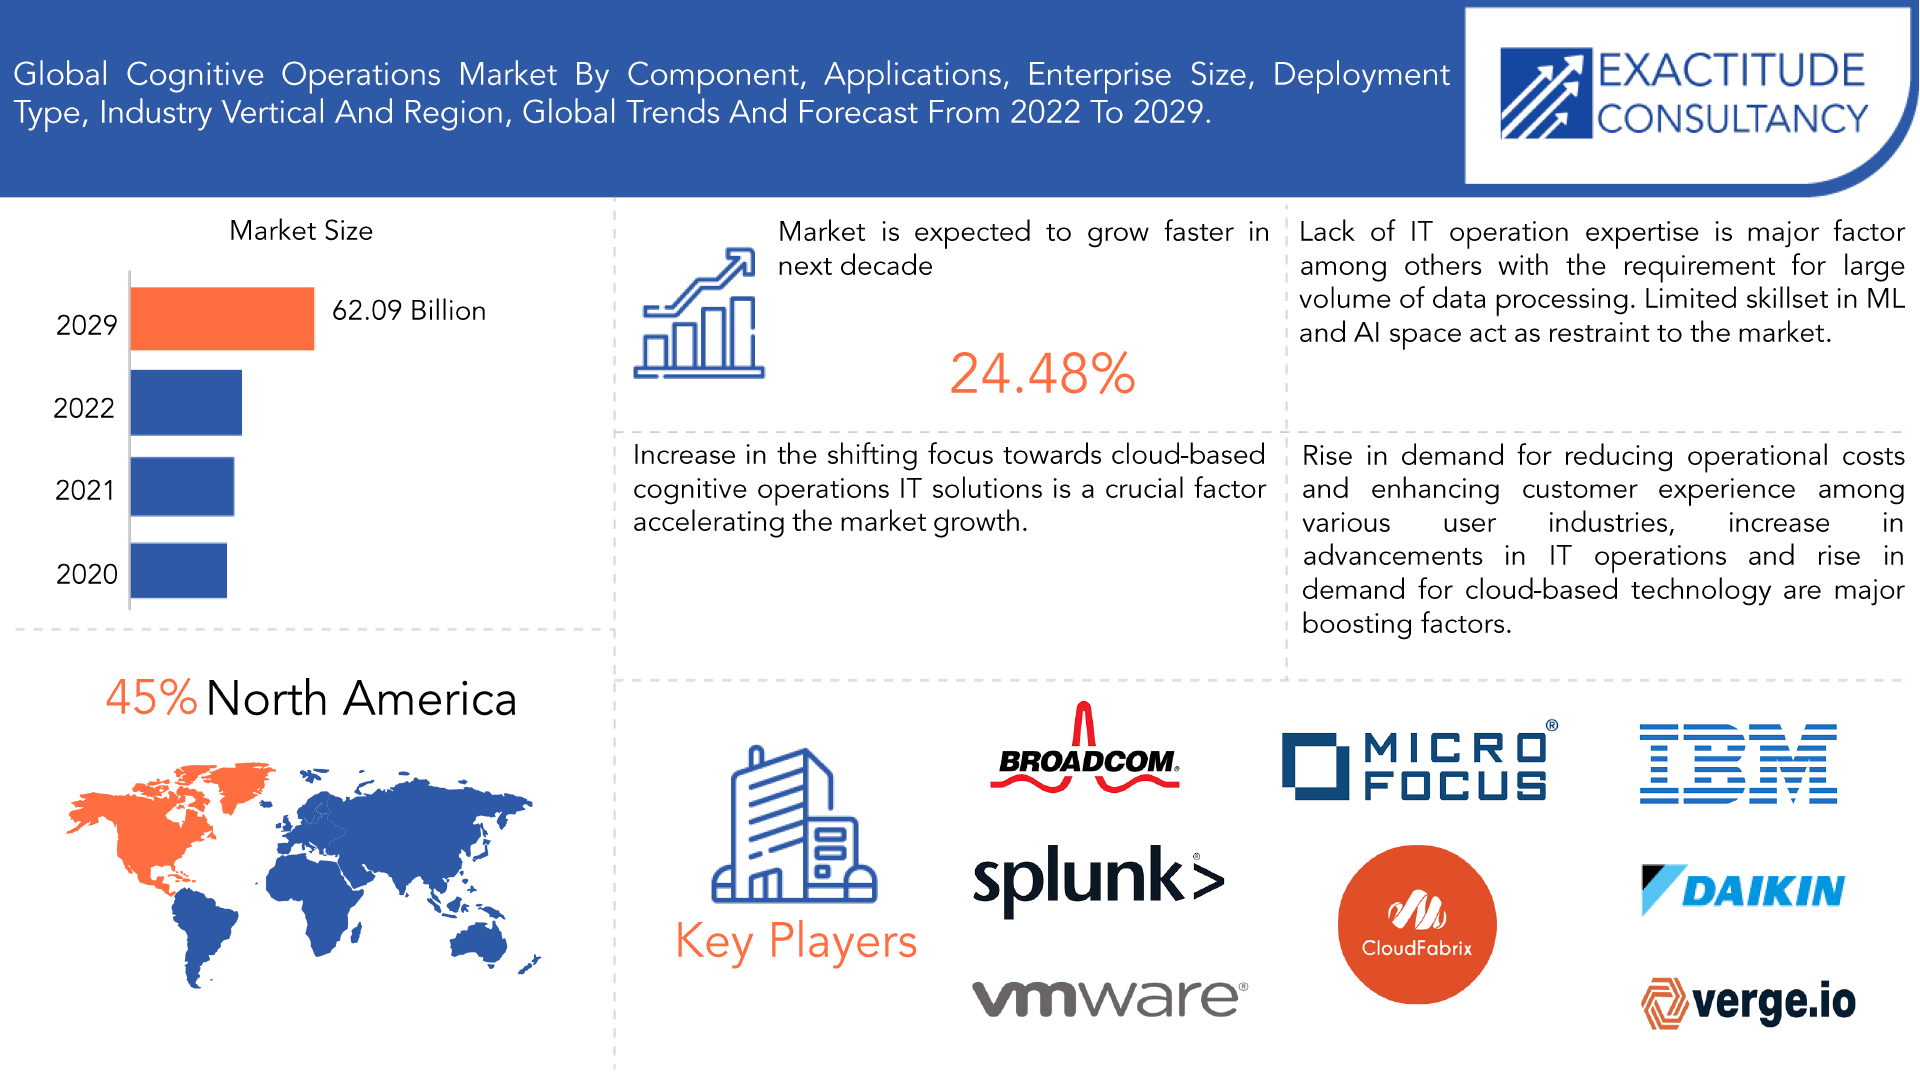
グローバル コグニティブ オペレーション市場、展開タイプ別 (クラウド、オンプレミス)、アプリケーション別 (IT 運用分析、インフラストラクチャ管理、ネットワーク分析、セキュリティ分析)、企業規模別 (大企業、中小企業)、コンポーネント別 (ソリューション、サービス)、産業垂直別 (BFSI、IT および通信、ヘルスケアおよびライフ サイエンス、メディアおよびエンターテイメント、製造、政府、小売および電子商取引)、地域別、2022 年から 2029 年までの世界的な傾向と予測。
Instant access to hundreds of data points and trends
- Market estimates from 2014-2029
- Competitive analysis, industry segmentation, financial benchmarks
- Incorporates SWOT, Porter's Five Forces and risk management frameworks
- PDF report or online database with Word, Excel and PowerPoint export options
- 100% money back guarantee
グローバル コグニティブ オペレーション市場の概要
世界の認知オペレーション市場規模は、2021年から2029年にかけて24.48%以上のCAGRで成長すると予想されています。2020年の620億9,000万米ドル強から、2029年には86億5,000万米ドルを超えると予想されています。
認知ソリューションで起こり得る問題をより短時間で特定するために、認知オペレーションでは人工知能を活用します。さらに、このようなシステムでは、パターンの特定、音声および視覚信号の調査、予測の提供、手順の合理化を行うために、IT およびビジネス オペレーションを自動化できます。現代の認知オペレーションは、小規模なスタンドアロンのオートメーション システムに限定されるのではなく、完全なエンタープライズ クラスのデジタル オートメーション ソリューションを組み合わせています。市場収益の成長は、モノのインターネット (IoT)、情報検索、機械学習(ML) 向けの認知オペレーション製品の需要の高まりによって推進されています。IoT デバイスへのシステムの迅速な統合により、認知オペレーションは、日々の企業オペレーションに役立つインテリジェント コンピューティング テクノロジーの新しいパラダイムです。世界中で、かなりの数の営利企業と非営利企業がサービス モデルを近代化し、認知オペレーションをモノのインターネット(IoT) エコシステムに統合しています。認知オペレーションは、AI とコンピューター サイエンスの進歩の結果として急速に発展しており、予測期間中に人気が高まると予想されます。
| 属性 | 詳細 |
| 研究期間 | 2020-2029 |
| 基準年 | 2021 |
| 推定年 | 2022 |
| 予測年 | 2022-2029 |
| 歴史的期間 | 2018-2020 |
| ユニット | 価値(10億米ドル) |
| セグメンテーション | 導入タイプ別、アプリケーション別、企業規模別、コンポーネント別、業種別、地域別 |
| 展開タイプ別 |
|
| アプリケーション別 |
|
| 企業規模別 |
|
| コンポーネント別 |
|
| コンポーネント別 |
|
| 地域別 |
|
認知オペレーションの主な目的は、企業の意思決定をサポートすることです。これは、予測分析などの ML 機能を活用して、スムーズな企業運営を行うための完璧なソリューションです。予測分析は正しい結果を生み出すための効果的なツールであるため、多くの企業顧客がこれらの効果的な予測分析ソリューションを利用して、日常の企業運営を行っています。数値、テキスト、言語パターン、写真、ビデオ、サウンドなどの感覚入力など、大量のさまざまなデータをリアルタイムで処理および操作することは、認知オペレーションの市場成長におけるもう 1 つの重要な要素です。これらのソリューションは、顧客と従業員のエクスペリエンスを向上させ、企業が新しい商品やサービスを開発する動機付け、リスクを軽減して新しいビジネス チャンスを特定するなど、さまざまな効果をもたらします。これらの側面は、認知オペレーション市場の需要を促進すると予想されます。
AI を活用したシステムを開発、導入、管理して IT 運用に組み込む際に、ほとんどの組織は経験と分析スキルの不足による問題に直面します。分析スキルと有能な従業員の不足は、組織が対処する主な問題です。IT 運用のデータは、現在、機械学習アルゴリズムを使用して分析する必要があります。機械学習モデルの構築は難しいプロセスであるため、知識、能力、適切なトレーニングが必要です。
COVID-19の影響で多くの企業が業務をリモートワークに移行したため、情報技術は急速に発展しました。遠隔地での作業、教育、ソーシャルメディア、娯楽でのインターネットの利用が増えたことは、COVID-19における認知オペレーションの市場に好影響を与えています。企業の大多数が業務をオンラインに移行したため、認知オペレーションの需要は時間とともに劇的に拡大しました。大規模な業界では、情報技術、ヘルスケアと製薬、サプライチェーン、eコマース、小売など、大量のデータの処理と操作に認知オペレーションソリューションを採用するケースがほとんどです。企業や政府は、病気の蔓延を阻止するために、地理空間分析とデータ視覚化のための認知オペレーションも使用しています。
[キャプション id="attachment_16323" align="aligncenter" width="1920"]
Frequently Asked Questions
• Who are the key players in the global cognitive operations market?
Some key players operating in the Global Cognitive Operations market include IBM Corporation, Micro Focus International Plc, Broadcom Corporation, VMware Inc., Splunk Inc., CloudFabrix, Verge.io, Daikin, HCK Technologies, CA Technologies.
• What are the factors driving the global cognitive operations market?
The use of adaptive and cognitive solutions in daily life enables experts to easily maintain, monitor, and analyze huge and complicated data sets. The IT Infrastructure is also aided by it. Data is currently expanding quickly across all IT departments. Additionally, the digital transformation is generating a lot of data, such as log data, performance data, configuration data, and events data. Managers of IT operations can utilize this information to improve their operational effectiveness and streamline corporate operations.
• How big is the global cognitive operations market?
The global cognitive operations market size was estimated at USD 8.65 billion in 2020 and is expected to reach USD 62.09 billion in 2029.
• What is the global cognitive operations market growth?
The global cognitive operations market is expected to grow at a compound annual growth rate of 24.48 % from 2022 to 2029 to reach USD 62.09 billion by 2029.
• Which region accounted for the largest global cognitive operations market share?
The North America dominated the global cognitive operations market with a share of 45% in 2021.
Global Cognitive Operations Market Segment Analysis
As a result of the cloud's many advantages, including lower operating costs, easier deployments, and greater scalability, the cloud deployment option is anticipated to increase at a higher CAGR during the projection period. Contrarily, it is anticipated that the on-premises deployment mode will account for a greater share of the cognitive operations market during the projection period since data-sensitive businesses favor on-premises deployment of cognitive operations solutions.
The IT operations analytics (ITOA) application is anticipated to have the biggest market size during the projection period, while the security analytics application is anticipated to develop at the quickest rate in the cognitive operations market. Enterprises may successfully identify, analyses, and address security issues across all IT operating processes with the use of security analytics. ITOA aids enterprises in identifying trends by connecting incident tickets to performance problems and infrastructure changes.
While the Small and Medium-sized Enterprises (SMEs) segment is anticipated to post a higher CAGR during the forecast period, the large enterprises segment is anticipated to account for a greater share of the market during that time. SMEs may obtain real-time data and make predictions about the future thanks to cognitive operations solutions.
It is anticipated that during the forecast period, the solutions sector would represent a bigger market share. The software tools sector is anticipated to have a bigger market share because cognitive operations software tools assist organizations in finding solutions for various IT operations activities, such as monitoring and managing vast and complex environments, more efficiently. During the projected period, however, the services segment is anticipated to expand more quickly.
The BFSI (Banking, Financial Services, and Insurance) sector is predicted to have the greatest market share in the cognitive operations industry among the verticals. During the projected period, the vertical in IT and telecom is anticipated to develop at the greatest CAGR. Cognitive operations solutions are used in the IT and telecom sector to mine the massive amounts of data created by user networks for important insights. The banking industry can analyze huge amounts of data to improve the client experience with the aid of cognitive operations capabilities.
[caption id="attachment_16324" align="aligncenter" width="1920"]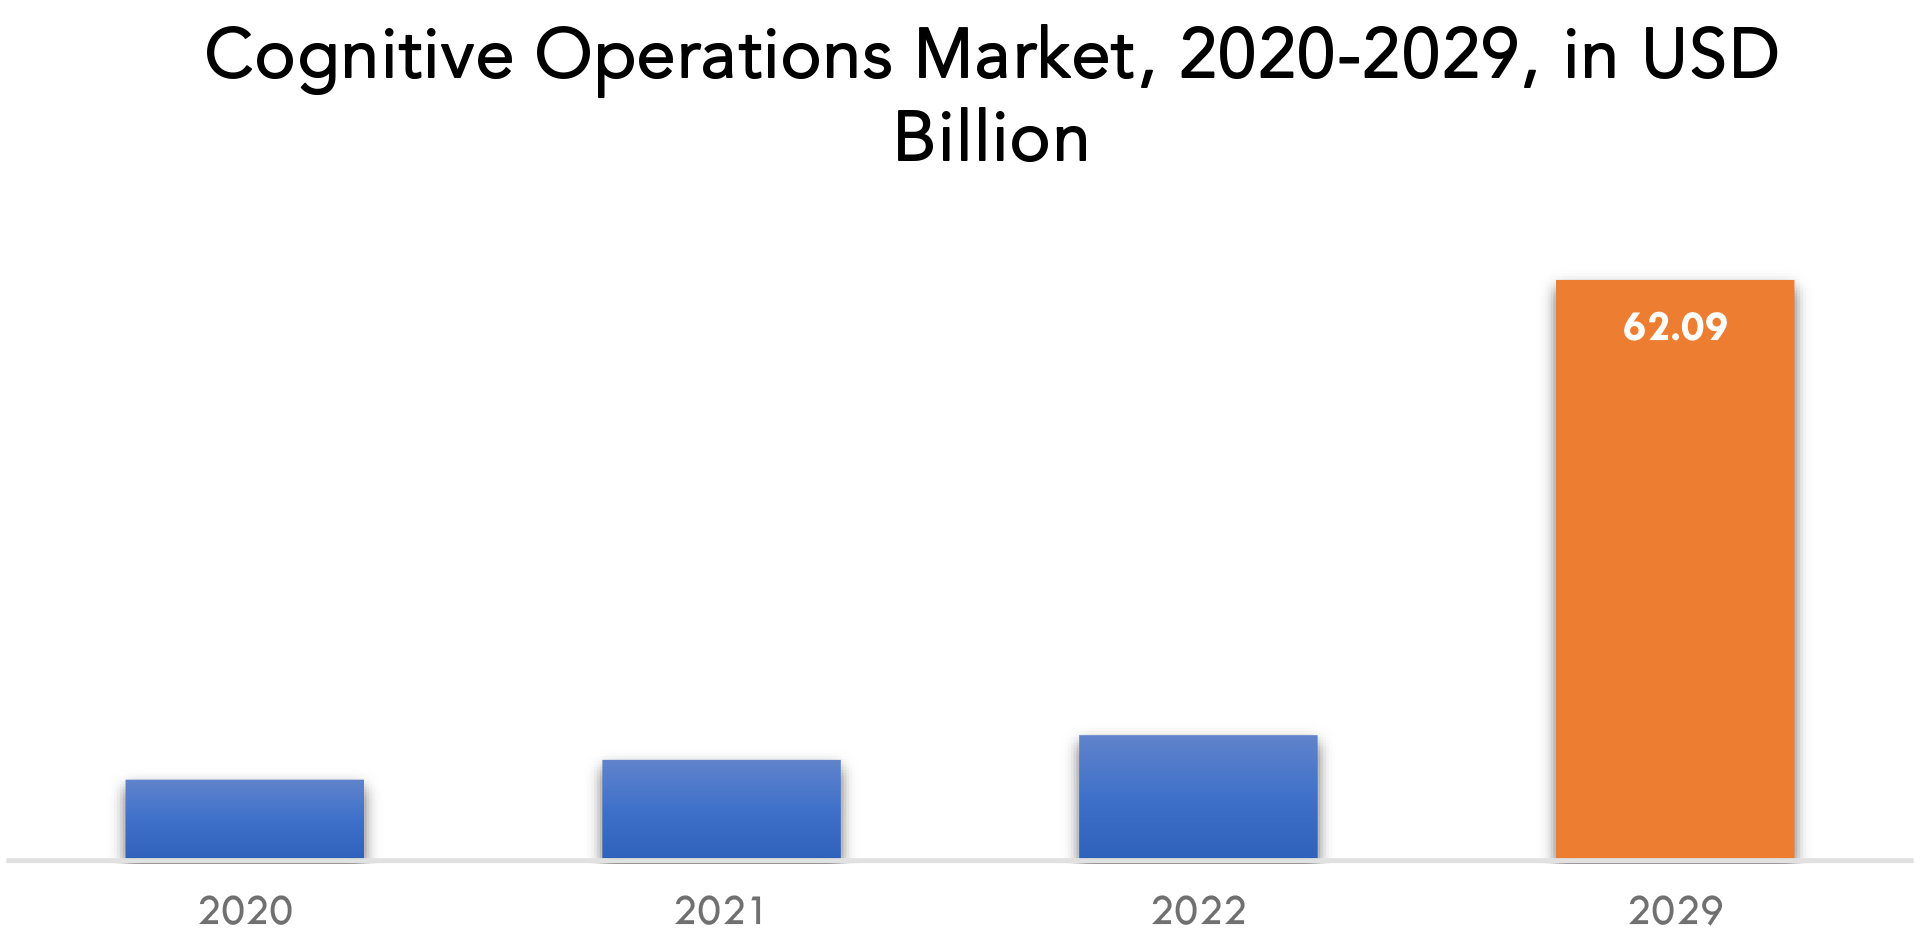
Global Cognitive Operations Market Players
Key competitors from both domestic and international markets compete fiercely in the worldwide global cognitive operations industry include IBM Corporation, Micro Focus International Plc, Broadcom Corporation, VMware Inc., Splunk Inc., CloudFabrix, Verge.io, Daikin, HCK Technologies, CA Technologies.
Recent News:- 12th August 2021, CloudFabrix and Verge.io announce strategic partnership to provide complete data center transformation. This partnership will combine CloudFabrix AI-based asset intelligence & operations with Verge.io data center virtualization operating system to provide a complete data center transformation for enterprise and channel service provider (CSP) organizations.
- 17th June 2021: IBM announced the closing of its acquisition of Turbonomic Inc., an application resource management (ARM) and Network Performance Management (NPM) software provider based in Boston, MA.
Who Should Buy? Or Key stakeholders
- Automotive Industries
- Research Organizations
- Value-added Resellers (VARs)
- Managed Service Provider
- System Integrators
- IT Directors or Consultants
- SMEs
- Cloud Service Providers
- Regulatory Authorities
- Cognitive Operations Solution Providers
- Investors
- Government
- Others
Global Cognitive Operations Market Regional Analysis
The Global Cognitive Operations Market by region includes North America, Asia-Pacific (APAC), Europe, South America, and Middle East & Africa (MEA).
- North America: includes the US, Canada, Mexico
- Asia Pacific: includes China, Japan, South Korea, India, Australia, ASEAN and Rest of APAC
- Europe: includes UK, Germany, France, Italy, Spain, Russia, and Rest of Europe
- South America: includes Brazil, Argentina and Rest of South America
- Middle East & Africa: includes Turkey, UAE, Saudi Arabia, South Africa, and Rest of MEA
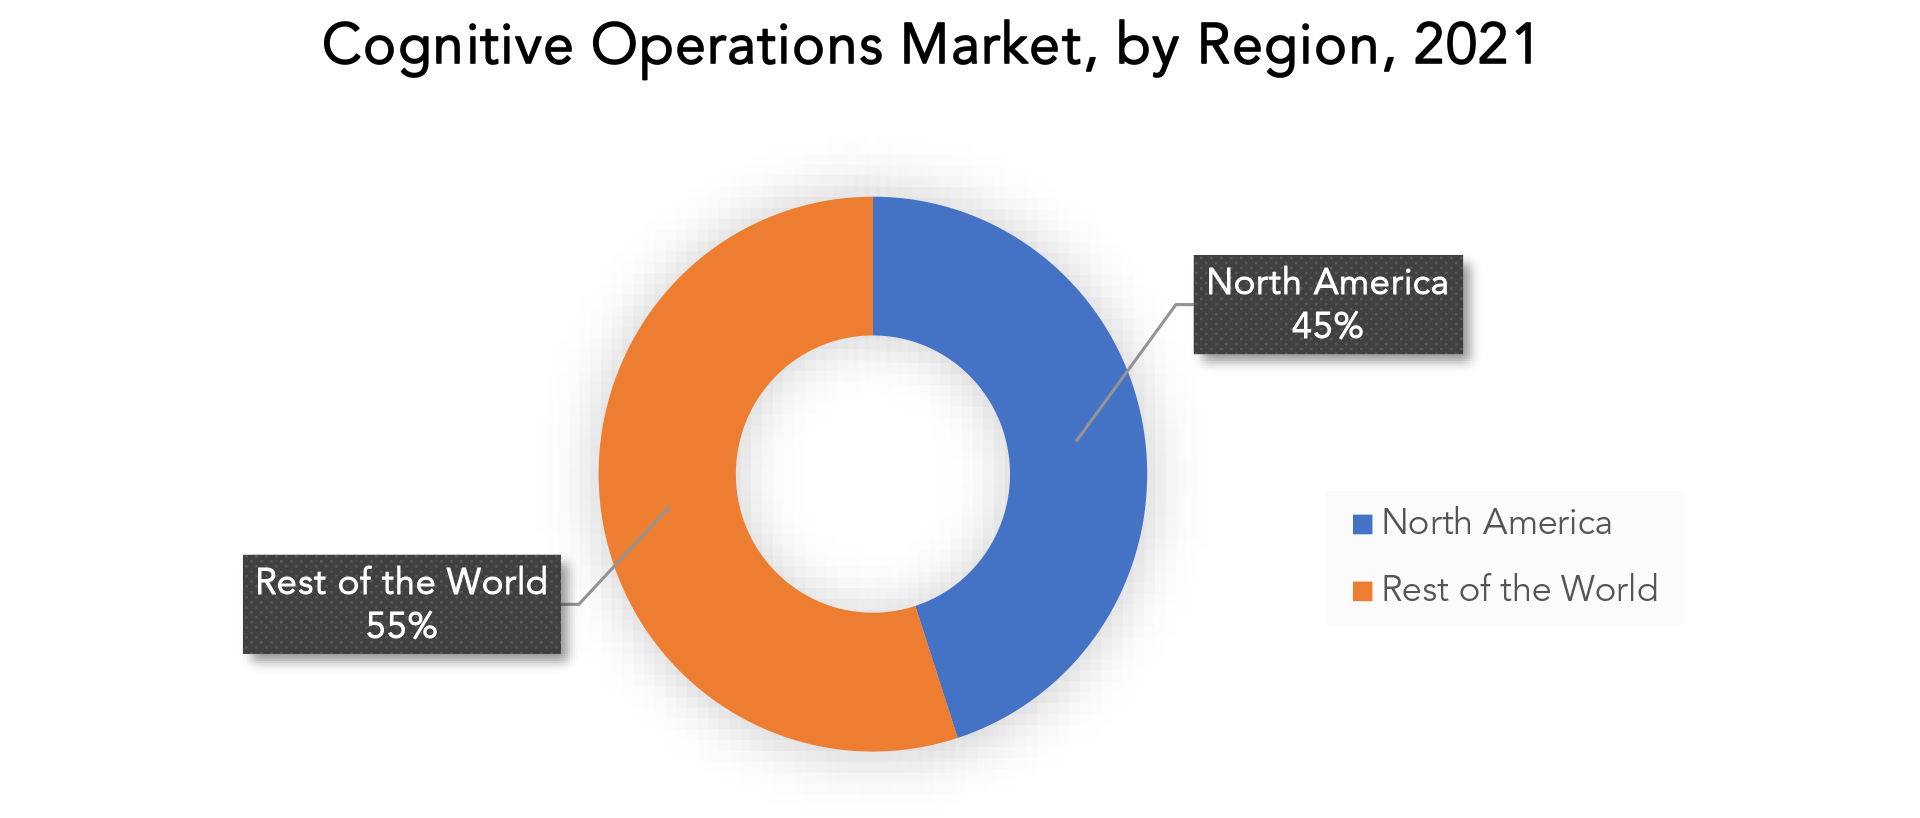
In terms of revenue, the cognitive operations market in 2021 will be dominated by the North American region. Increased adoption of the internet, IT infrastructure, robotics, sophisticated healthcare, and the quick integration of cognitive operations into these business processes have all boosted the market for cognitive operations in this region. The World Bank estimates that in 2020, more than 92% of North Americans will have access to the internet. As a result, internet penetration in this region will drive the market for cognitive operations in a variety of sectors, including fashion and retail, healthcare, manufacturing, transportation, and many others. APAC is expected to have the market's fastest growth.
Key Market Segments: Global Cognitive Operations Market
Global Cognitive Operations Market By Deployment Type, 2020-2029, (USD Billion)- Cloud
- On-Premise
- It Operations Analytics
- Infrastructure Management
- Network Analytics
- Security Analytics
- Large Enterprise
- SMES
- Solutions
- Services
- BFSI
- IT and Telecommunications
- Healthcare
- Media and Entertainment
- Manufacturing
- Retail and E-Commerce
- North America
- Europe
- Asia Pacific
- South America
- Middle East and Africa
Key Question Answered
- What is the expected growth rate of the cognitive operations market over the next 7 years?
- Who are the major players in the cognitive operations market and what is their market share?
- What are the end-user industries driving demand for market and what is their outlook?
- What are the opportunities for growth in emerging markets such as Asia-Pacific, Middle East, and Africa?
- How is the economic environment affecting the cognitive operations market, including factors such as interest rates, inflation, and exchange rates?
- What is the expected impact of government policies and regulations on the cognitive operations market?
- What is the current and forecasted size and growth rate of the global cognitive operations market?
- What are the key drivers of growth in the cognitive operations market?
- What are the distribution channels and supply chain dynamics in the cognitive operations market?
- What are the technological advancements and innovations in the cognitive operations market and their impact on product development and growth?
- What are the regulatory considerations and their impact on the market?
- What are the challenges faced by players in the cognitive operations market and how are they addressing these challenges?
- What are the opportunities for growth and expansion in the cognitive operations market?
- What are the service offerings and specifications of leading players in the market?
- What is the pricing trend of cognitive operations in the market and what is the impact of raw material prices on the price trend?
- 導入
- 市場の定義
- 市場セグメンテーション
- 研究タイムライン
- 前提と制限
- 研究方法
- データマイニング
- 二次調査
- 一次研究
- 専門家のアドバイス
- 品質チェック
- 最終レビュー
- データ三角測量
- ボトムアップアプローチ
- トップダウンアプローチ
- 研究の流れ
- データソース
- データマイニング
- エグゼクティブサマリー
- 市場概要
- グローバルコグニティブオペレーション市場の展望
- 市場の推進要因
- 市場の制約
- 市場機会
- COVID-19が認知オペレーション市場に与える影響
- ポーターの5つの力モデル
- THREAT FROM NEW ENTRANTS
- THREAT FROM SUBSTITUTES
- BARGAINING POWER OF SUPPLIERS
- BARGAINING POWER OF CUSTOMERS
- DEGREE OF COMPETITION
- INDUSTRY VALUE CHAIN ANALYSIS
- グローバルコグニティブオペレーション市場の展望
- GLOBAL COGNITIVE OPERATIONS MARKET BY DEPLOYMENT TYPE, 2020-2029, (USD BILLION)
- CLOUD
- ON-PREMISE
- GLOBAL COGNITIVE OPERATIONS MARKET BY APPLICATION, 2020-2029, (USD BILLION)
- IT OPERATIONS ANALYTICS
- INFRASTRUCTURE MANAGEMENT
- NETWORK ANALYTICS
- SECURITY ANALYTICS
- GLOBAL COGNITIVE OPERATIONS MARKET BY ENTERPRISE SIZE, 2020-2029, (USD BILLION)
- LARGE ENTERPRISE
- SMES
- GLOBAL COGNITIVE OPERATIONS MARKET BY COMPONENT, 2020-2029, (USD BILLION)
- SOLUTIONS
- SERVICES
- GLOBAL COGNITIVE OPERATIONS MARKET BY INDUSTRIAL VERTICAL, 2020-2029, (USD BILLION)
- BFSI
- IT AND TELECOMMUNICATIONS
- HEALTHCARE
- MEDIA AND ENTERTAINMENT
- MANUFACTURING
- RETAIL AND E-COMMERCE
- GLOBAL COGNITIVE OPERATIONS MARKET BY REGION, 2020-2029, (USD BILLION), (THOUSAND UNITS)
- NORTH AMERICA
- US
- CANADA
- MEXICO
- SOUTH AMERICA
- BRAZIL
- ARGENTINA
- COLOMBIA
- REST OF SOUTH AMERICA
- EUROPE
- GERMANY
- UK
- FRANCE
- ITALY
- SPAIN
- RUSSIA
- REST OF EUROPE
- ASIA PACIFIC
- INDIA
- CHINA
- JAPAN
- SOUTH KOREA
- AUSTRALIA
- SOUTH-EAST ASIA
- REST OF ASIA PACIFIC
- MIDDLE EAST AND AFRICA
- UAE
- SAUDI ARABIA
- SOUTH AFRICA
- REST OF MIDDLE EAST AND AFRICA
- NORTH AMERICA
- COMPANY PROFILES*
(BUSINESS OVERVIEW, COMPANY SNAPSHOT, PRODUCTS OFFERED, RECENT DEVELOPMENTS)
- IBM CORPORATION
- MICRO FOCUS INTERNATIONAL PLC
- BROADCOM CORPORATION
- VMWARE INC.
- SPLUNK INC.
- CLOUDFABRIX
- IO
- DAIKIN
- HCL TECHNOLOGIES
- CA TECHNOLOGIES
*THE COMPANY LIST IS INDICATIVE
LIST OF TABLES
TABLE 1 GLOBAL COGNITIVE OPERATIONS MARKET BY DEPLOYMENT TYPE (USD BILLION) 2020-2029
TABLE 2 GLOBAL COGNITIVE OPERATIONS MARKET BY APPLICATION (USD BILLION) 2020-2029
TABLE 3 GLOBAL COGNITIVE OPERATIONS MARKET BY ENTERPRISE SIZE (USD BILLION) 2020-2029
TABLE 4 GLOBAL COGNITIVE OPERATIONS MARKET BY COMPONENT (USD BILLION) 2020-2029
TABLE 5 GLOBAL COGNITIVE OPERATIONS MARKET BY INDUSTRY VERTICAL (USD BILLION) 2020-2029
TABLE 6 GLOBAL COGNITIVE OPERATIONS MARKET BY REGION (USD BILLION) 2020-2029
TABLE 7 NORTH AMERICA COGNITIVE OPERATIONS MARKET BY COUNTRY (USD BILLION) 2020-2029
TABLE 8 NORTH AMERICA COGNITIVE OPERATIONS MARKET BY DEPLOYMENT TYPE (USD BILLION) 2020-2029
TABLE 9 NORTH AMERICA COGNITIVE OPERATIONS MARKET BY APPLICATION (USD BILLION) 2020-2029
TABLE 10 NORTH AMERICA COGNITIVE OPERATIONS MARKET BY ENTERPRISE SIZE (USD BILLION) 2020-2029
TABLE 11 NORTH AMERICA COGNITIVE OPERATIONS MARKET BY COMPONENT (USD BILLION) 2020-2029
TABLE 12 NORTH AMERICA COGNITIVE OPERATIONS MARKET BY INDUSTRY VERTICAL (USD BILLION) 2020-2029
TABLE 13 US COGNITIVE OPERATIONS MARKET BY DEPLOYMENT TYPE (USD BILLION) 2020-2029
TABLE 14 US COGNITIVE OPERATIONS MARKET BY APPLICATION (USD BILLION) 2020-2029
TABLE 15 US COGNITIVE OPERATIONS MARKET BY ENTERPRISE SIZE (USD BILLION) 2020-2029
TABLE 16 US COGNITIVE OPERATIONS MARKET BY COMPONENT (USD BILLION) 2020-2029
TABLE 17 US COGNITIVE OPERATIONS MARKET BY INDUSTRY VERTICAL (USD BILLION) 2020-2029
TABLE 18 CANADA COGNITIVE OPERATIONS MARKET BY DEPLOYMENT TYPE (USD BILLION) 2020-2029
TABLE 19 CANADA COGNITIVE OPERATIONS MARKET BY APPLICATION (USD BILLION) 2020-2029
TABLE 20 CANADA COGNITIVE OPERATIONS MARKET BY ENTERPRISE SIZE (USD BILLION) 2020-2029
TABLE 21 CANADA COGNITIVE OPERATIONS MARKET BY COMPONENT (USD BILLION) 2020-2029
TABLE 22 CANADA COGNITIVE OPERATIONS MARKET BY INDUSTRY VERTICAL (USD BILLION) 2020-2029
TABLE 23 MEXICO COGNITIVE OPERATIONS MARKET BY DEPLOYMENT TYPE (USD BILLION) 2020-2029
TABLE 24 MEXICO COGNITIVE OPERATIONS MARKET BY APPLICATION (USD BILLION) 2020-2029
TABLE 25 MEXICO COGNITIVE OPERATIONS MARKET BY ENTERPRISE SIZE (USD BILLION) 2020-2029
TABLE 26 MEXICO COGNITIVE OPERATIONS MARKET BY COMPONENT (USD BILLION) 2020-2029
TABLE 27 MEXICO COGNITIVE OPERATIONS MARKET BY INDUSTRY VERTICAL (USD BILLION) 2020-2029
TABLE 28 SOUTH AMERICA COGNITIVE OPERATIONS MARKET BY COUNTRY (USD BILLION) 2020-2029
TABLE 29 SOUTH AMERICA COGNITIVE OPERATIONS MARKET BY DEPLOYMENT TYPE (USD BILLION) 2020-2029
TABLE 30 SOUTH AMERICA COGNITIVE OPERATIONS MARKET BY APPLICATION (USD BILLION) 2020-2029
TABLE 31 SOUTH AMERICA COGNITIVE OPERATIONS MARKET BY ENTERPRISE SIZE (USD BILLION) 2020-2029
TABLE 32 SOUTH AMERICA COGNITIVE OPERATIONS MARKET BY COMPONENT (USD BILLION) 2020-2029
TABLE 33 SOUTH AMERICA COGNITIVE OPERATIONS MARKET BY INDUSTRY VERTICAL (USD BILLION) 2020-2029
TABLE 34 BRAZIL COGNITIVE OPERATIONS MARKET BY DEPLOYMENT TYPE (USD BILLION) 2020-2029
TABLE 35 BRAZIL COGNITIVE OPERATIONS MARKET BY APPLICATION (USD BILLION) 2020-2029
TABLE 36 BRAZIL COGNITIVE OPERATIONS MARKET BY ENTERPRISE SIZE (USD BILLION) 2020-2029
TABLE 37 BRAZIL COGNITIVE OPERATIONS MARKET BY COMPONENT (USD BILLION) 2020-2029
TABLE 38 BRAZIL COGNITIVE OPERATIONS MARKET BY INDUSTRY VERTICAL (USD BILLION) 2020-2029
TABLE 39 ARGENTINA COGNITIVE OPERATIONS MARKET BY DEPLOYMENT TYPE (USD BILLION) 2020-2029
TABLE 40 ARGENTINA COGNITIVE OPERATIONS MARKET BY APPLICATION (USD BILLION) 2020-2029
TABLE 41 ARGENTINA COGNITIVE OPERATIONS MARKET BY ENTERPRISE SIZE (USD BILLION) 2020-2029
TABLE 42 ARGENTINA COGNITIVE OPERATIONS MARKET BY COMPONENT (USD BILLION) 2020-2029
TABLE 43 ARGENTINA COGNITIVE OPERATIONS MARKET BY INDUSTRY VERTICAL (USD BILLION) 2020-2029
TABLE 44 COLOMBIA COGNITIVE OPERATIONS MARKET BY DEPLOYMENT TYPE (USD BILLION) 2020-2029
TABLE 45 COLOMBIA COGNITIVE OPERATIONS MARKET BY APPLICATION (USD BILLION) 2020-2029
TABLE 46 COLOMBIA COGNITIVE OPERATIONS MARKET BY ENTERPRISE SIZE (USD BILLION) 2020-2029
TABLE 47 COLOMBIA COGNITIVE OPERATIONS MARKET BY COMPONENT (USD BILLION) 2020-2029
TABLE 48 COLOMBIA COGNITIVE OPERATIONS MARKET BY INDUSTRY VERTICAL (USD BILLION) 2020-2029
TABLE 49 REST OF SOUTH AMERICA COGNITIVE OPERATIONS MARKET BY DEPLOYMENT TYPE (USD BILLION) 2020-2029
TABLE 50 REST OF SOUTH AMERICA COGNITIVE OPERATIONS MARKET BY APPLICATION (USD BILLION) 2020-2029
TABLE 51 REST OF SOUTH AMERICA COGNITIVE OPERATIONS MARKET BY ENTERPRISE SIZE (USD BILLION) 2020-2029
TABLE 52 REST OF SOUTH AMERICA COGNITIVE OPERATIONS MARKET BY COMPONENT (USD BILLION) 2020-2029
TABLE 53 REST OF SOUTH AMERICA COGNITIVE OPERATIONS MARKET BY INDUSTRY VERTICAL (USD BILLION) 2020-2029
TABLE 54 ASIA-PACIFIC COGNITIVE OPERATIONS MARKET BY COUNTRY (USD BILLION) 2020-2029
TABLE 55 ASIA-PACIFIC COGNITIVE OPERATIONS MARKET BY DEPLOYMENT TYPE (USD BILLION) 2020-2029
TABLE 56 ASIA-PACIFIC COGNITIVE OPERATIONS MARKET BY APPLICATION (USD BILLION) 2020-2029
TABLE 57 ASIA-PACIFIC COGNITIVE OPERATIONS MARKET BY ENTERPRISE SIZE (USD BILLION) 2020-2029
TABLE 58 ASIA-PACIFIC COGNITIVE OPERATIONS MARKET BY COMPONENT (USD BILLION) 2020-2029
TABLE 59 ASIA-PACIFIC COGNITIVE OPERATIONS MARKET BY INDUSTRY VERTICAL (USD BILLION) 2020-2029
TABLE 60 INDIA COGNITIVE OPERATIONS MARKET BY DEPLOYMENT TYPE (USD BILLION) 2020-2029
TABLE 61 INDIA COGNITIVE OPERATIONS MARKET BY APPLICATION (USD BILLION) 2020-2029
TABLE 62 INDIA COGNITIVE OPERATIONS MARKET BY ENTERPRISE SIZE (USD BILLION) 2020-2029
TABLE 63 INDIA COGNITIVE OPERATIONS MARKET BY COMPONENT (USD BILLION) 2020-2029
TABLE 64 INDIA COGNITIVE OPERATIONS MARKET BY INDUSTRY VERTICAL (USD BILLION) 2020-2029
TABLE 65 CHINA COGNITIVE OPERATIONS MARKET BY DEPLOYMENT TYPE (USD BILLION) 2020-2029
TABLE 66 CHINA COGNITIVE OPERATIONS MARKET BY APPLICATION (USD BILLION) 2020-2029
TABLE 67 CHINA COGNITIVE OPERATIONS MARKET BY ENTERPRISE SIZE (USD BILLION) 2020-2029
TABLE 68 CHINA COGNITIVE OPERATIONS MARKET BY COMPONENT (USD BILLION) 2020-2029
TABLE 69 CHINA COGNITIVE OPERATIONS MARKET BY INDUSTRY VERTICAL (USD BILLION) 2020-2029
TABLE 70 JAPAN COGNITIVE OPERATIONS MARKET BY DEPLOYMENT TYPE (USD BILLION) 2020-2029
TABLE 71 JAPAN COGNITIVE OPERATIONS MARKET BY APPLICATION (USD BILLION) 2020-2029
TABLE 72 JAPAN COGNITIVE OPERATIONS MARKET BY ENTERPRISE SIZE (USD BILLION) 2020-2029
TABLE 73 JAPAN COGNITIVE OPERATIONS MARKET BY COMPONENT (USD BILLION) 2020-2029
TABLE 74 JAPAN COGNITIVE OPERATIONS MARKET BY INDUSTRY VERTICAL (USD BILLION) 2020-2029
TABLE 75 SOUTH KOREA COGNITIVE OPERATIONS MARKET BY DEPLOYMENT TYPE (USD BILLION) 2020-2029
TABLE 76 SOUTH KOREA COGNITIVE OPERATIONS MARKET BY APPLICATION (USD BILLION) 2020-2029
TABLE 77 SOUTH KOREA COGNITIVE OPERATIONS MARKET BY ENTERPRISE SIZE (USD BILLION) 2020-2029
TABLE 78 SOUTH KOREA COGNITIVE OPERATIONS MARKET BY COMPONENT (USD BILLION) 2020-2029
TABLE 79 SOUTH KOREA COGNITIVE OPERATIONS MARKET BY INDUSTRY VERTICAL (USD BILLION) 2020-2029
TABLE 80 AUSTRALIA COGNITIVE OPERATIONS MARKET BY DEPLOYMENT TYPE (USD BILLION) 2020-2029
TABLE 81 AUSTRALIA COGNITIVE OPERATIONS MARKET BY APPLICATION (USD BILLION) 2020-2029
TABLE 82 AUSTRALIA COGNITIVE OPERATIONS MARKET BY ENTERPRISE SIZE (USD BILLION) 2020-2029
TABLE 83 AUSTRALIA COGNITIVE OPERATIONS MARKET BY COMPONENT (USD BILLION) 2020-2029
TABLE 84 AUSTRALIA COGNITIVE OPERATIONS MARKET BY INDUSTRY VERTICAL (USD BILLION) 2020-2029
TABLE 85 SOUTH-EAST ASIA COGNITIVE OPERATIONS MARKET BY DEPLOYMENT TYPE (USD BILLION) 2020-2029
TABLE 86 SOUTH-EAST ASIA COGNITIVE OPERATIONS MARKET BY APPLICATION (USD BILLION) 2020-2029
TABLE 87 SOUTH-EAST ASIA COGNITIVE OPERATIONS MARKET BY ENTERPRISE SIZE (USD BILLION) 2020-2029
TABLE 88 SOUTH-EAST ASIA COGNITIVE OPERATIONS MARKET BY COMPONENT (USD BILLION) 2020-2029
TABLE 89 SOUTH-EAST ASIA COGNITIVE OPERATIONS MARKET BY INDUSTRY VERTICAL (USD BILLION) 2020-2029
TABLE 90 REST OF ASIA PACIFIC COGNITIVE OPERATIONS MARKET BY DEPLOYMENT TYPE (USD BILLION) 2020-2029
TABLE 91 REST OF ASIA PACIFIC COGNITIVE OPERATIONS MARKET BY APPLICATION (USD BILLION) 2020-2029
TABLE 92 REST OF ASIA PACIFIC COGNITIVE OPERATIONS MARKET BY ENTERPRISE SIZE (USD BILLION) 2020-2029
TABLE 93 REST OF ASIA PACIFIC COGNITIVE OPERATIONS MARKET BY COMPONENT (USD BILLION) 2020-2029
TABLE 94 REST OF ASIA PACIFIC COGNITIVE OPERATIONS MARKET BY INDUSTRY VERTICAL (USD BILLION) 2020-2029
TABLE 95 EUROPE COGNITIVE OPERATIONS MARKET BY COUNTRY (USD BILLION) 2020-2029
TABLE 96 ASIA-PACIFIC COGNITIVE OPERATIONS MARKET BY DEPLOYMENT TYPE (USD BILLION) 2020-2029
TABLE 97 ASIA-PACIFIC COGNITIVE OPERATIONS MARKET BY APPLICATION (USD BILLION) 2020-2029
TABLE 98 ASIA-PACIFIC COGNITIVE OPERATIONS MARKET BY ENTERPRISE SIZE (USD BILLION) 2020-2029
TABLE 99 ASIA-PACIFIC COGNITIVE OPERATIONS MARKET BY COMPONENT (USD BILLION) 2020-2029
TABLE 100 ASIA-PACIFIC COGNITIVE OPERATIONS MARKET BY INDUSTRY VERTICAL (USD BILLION) 2020-2029
TABLE 101 GERMANY COGNITIVE OPERATIONS MARKET BY DEPLOYMENT TYPE (USD BILLION) 2020-2029
TABLE 102 GERMANY COGNITIVE OPERATIONS MARKET BY APPLICATION (USD BILLION) 2020-2029
TABLE 103 GERMANY COGNITIVE OPERATIONS MARKET BY ENTERPRISE SIZE (USD BILLION) 2020-2029
TABLE 104 GERMANY COGNITIVE OPERATIONS MARKET BY COMPONENT (USD BILLION) 2020-2029
TABLE 105 GERMANY COGNITIVE OPERATIONS MARKET BY INDUSTRY VERTICAL (USD BILLION) 2020-2029
TABLE 106 UK COGNITIVE OPERATIONS MARKET BY DEPLOYMENT TYPE (USD BILLION) 2020-2029
TABLE 107 UK COGNITIVE OPERATIONS MARKET BY APPLICATION (USD BILLION) 2020-2029
TABLE 108 UK COGNITIVE OPERATIONS MARKET BY ENTERPRISE SIZE (USD BILLION) 2020-2029
TABLE 109 UK COGNITIVE OPERATIONS MARKET BY COMPONENT (USD BILLION) 2020-2029
TABLE 110 UK COGNITIVE OPERATIONS MARKET BY INDUSTRY VERTICAL (USD BILLION) 2020-2029
TABLE 111 FRANCE COGNITIVE OPERATIONS MARKET BY DEPLOYMENT TYPE (USD BILLION) 2020-2029
TABLE 112 FRANCE COGNITIVE OPERATIONS MARKET BY APPLICATION (USD BILLION) 2020-2029
TABLE 113 FRANCE COGNITIVE OPERATIONS MARKET BY ENTERPRISE SIZE (USD BILLION) 2020-2029
TABLE 114 FRANCE COGNITIVE OPERATIONS MARKET BY COMPONENT (USD BILLION) 2020-2029
TABLE 115 FRANCE COGNITIVE OPERATIONS MARKET BY INDUSTRY VERTICAL (USD BILLION) 2020-2029
TABLE 116 ITALY COGNITIVE OPERATIONS MARKET BY DEPLOYMENT TYPE (USD BILLION) 2020-2029
TABLE 117 ITALY COGNITIVE OPERATIONS MARKET BY APPLICATION (USD BILLION) 2020-2029
TABLE 118 ITALY COGNITIVE OPERATIONS MARKET BY ENTERPRISE SIZE (USD BILLION) 2020-2029
TABLE 119 ITALY COGNITIVE OPERATIONS MARKET BY COMPONENT (USD BILLION) 2020-2029
TABLE 120 ITALY COGNITIVE OPERATIONS MARKET BY INDUSTRY VERTICAL (USD BILLION) 2020-2029
TABLE 121 SPAIN COGNITIVE OPERATIONS MARKET BY DEPLOYMENT TYPE (USD BILLION) 2020-2029
TABLE 122 SPAIN COGNITIVE OPERATIONS MARKET BY APPLICATION (USD BILLION) 2020-2029
TABLE 123 SPAIN COGNITIVE OPERATIONS MARKET BY ENTERPRISE SIZE (USD BILLION) 2020-2029
TABLE 124 SPAIN COGNITIVE OPERATIONS MARKET BY COMPONENT (USD BILLION) 2020-2029
TABLE 125 SPAIN COGNITIVE OPERATIONS MARKET BY INDUSTRY VERTICAL (USD BILLION) 2020-2029
TABLE 126 RUSSIA COGNITIVE OPERATIONS MARKET BY DEPLOYMENT TYPE (USD BILLION) 2020-2029
TABLE 127 RUSSIA COGNITIVE OPERATIONS MARKET BY APPLICATION (USD BILLION) 2020-2029
TABLE 128 RUSSIA COGNITIVE OPERATIONS MARKET BY ENTERPRISE SIZE (USD BILLION) 2020-2029
TABLE 129 RUSSIA COGNITIVE OPERATIONS MARKET BY COMPONENT (USD BILLION) 2020-2029
TABLE 130 RUSSIA COGNITIVE OPERATIONS MARKET BY INDUSTRY VERTICAL (USD BILLION) 2020-2029
TABLE 131 REST OF EUROPE COGNITIVE OPERATIONS MARKET BY DEPLOYMENT TYPE (USD BILLION) 2020-2029
TABLE 132 REST OF EUROPE COGNITIVE OPERATIONS MARKET BY APPLICATION (USD BILLION) 2020-2029
TABLE 133 REST OF EUROPE COGNITIVE OPERATIONS MARKET BY ENTERPRISE SIZE (USD BILLION) 2020-2029
TABLE 134 REST OF EUROPE COGNITIVE OPERATIONS MARKET BY COMPONENT (USD BILLION) 2020-2029
TABLE 135 REST OF EUROPE COGNITIVE OPERATIONS MARKET BY INDUSTRY VERTICAL (USD BILLION) 2020-2029
TABLE 136 MIDDLE EAST AND AFRICA COGNITIVE OPERATIONS MARKET BY COUNTRY (USD BILLION) 2020-2029
TABLE 137 MIDDLE EAST AND AFRICA COGNITIVE OPERATIONS MARKET BY DEPLOYMENT TYPE (USD BILLION) 2020-2029
TABLE 138 MIDDLE EAST AND AFRICA COGNITIVE OPERATIONS MARKET BY APPLICATION (USD BILLION) 2020-2029
TABLE 139 MIDDLE EAST AND AFRICA COGNITIVE OPERATIONS MARKET BY ENTERPRISE SIZE (USD BILLION) 2020-2029
TABLE 140 MIDDLE EAST AND AFRICA COGNITIVE OPERATIONS MARKET BY COMPONENT (USD BILLION) 2020-2029
TABLE 141 MIDDLE EAST AND AFRICA COGNITIVE OPERATIONS MARKET BY INDUSTRY VERTICAL (USD BILLION) 2020-2029
TABLE 142 UAE COGNITIVE OPERATIONS MARKET BY DEPLOYMENT TYPE (USD BILLION) 2020-2029
TABLE 143 UAE COGNITIVE OPERATIONS MARKET BY APPLICATION (USD BILLION) 2020-2029
TABLE 144 UAE COGNITIVE OPERATIONS MARKET BY ENTERPRISE SIZE (USD BILLION) 2020-2029
TABLE 145 UAE COGNITIVE OPERATIONS MARKET BY COMPONENT (USD BILLION) 2020-2029
TABLE 146 UAE COGNITIVE OPERATIONS MARKET BY INDUSTRY VERTICAL (USD BILLION) 2020-2029
TABLE 147 SAUDI ARABIA COGNITIVE OPERATIONS MARKET BY DEPLOYMENT TYPE (USD BILLION) 2020-2029
TABLE 148 SAUDI ARABIA COGNITIVE OPERATIONS MARKET BY APPLICATION (USD BILLION) 2020-2029
TABLE 149 SAUDI ARABIA COGNITIVE OPERATIONS MARKET BY ENTERPRISE SIZE (USD BILLION) 2020-2029
TABLE 150 SAUDI ARABIA COGNITIVE OPERATIONS MARKET BY COMPONENT (USD BILLION) 2020-2029
TABLE 151 SAUDI ARABIA COGNITIVE OPERATIONS MARKET BY INDUSTRY VERTICAL (USD BILLION) 2020-2029
TABLE 152 SOUTH AFRICA COGNITIVE OPERATIONS MARKET BY DEPLOYMENT TYPE (USD BILLION) 2020-2029
TABLE 153 SOUTH AFRICA COGNITIVE OPERATIONS MARKET BY APPLICATION (USD BILLION) 2020-2029
TABLE 154 SOUTH AFRICA COGNITIVE OPERATIONS MARKET BY ENTERPRISE SIZE (USD BILLION) 2020-2029
TABLE 155 SOUTH AFRICA COGNITIVE OPERATIONS MARKET BY COMPONENT (USD BILLION) 2020-2029
TABLE 156 SOUTH AFRICA COGNITIVE OPERATIONS MARKET BY INDUSTRY VERTICAL (USD BILLION) 2020-2029
TABLE 157 REST OF MIDDLE EAST AND AFRICA COGNITIVE OPERATIONS MARKET BY DEPLOYMENT TYPE (USD BILLION) 2020-2029
TABLE 158 REST OF MIDDLE EAST AND AFRICA COGNITIVE OPERATIONS MARKET BY APPLICATION (USD BILLION) 2020-2029
TABLE 159 REST OF MIDDLE EAST AND AFRICA COGNITIVE OPERATIONS MARKET BY ENTERPRISE SIZE (USD BILLION) 2020-2029
TABLE 160 REST OF MIDDLE EAST AND AFRICA COGNITIVE OPERATIONS MARKET BY COMPONENT (USD BILLION) 2020-2029
TABLE 161 REST OF MIDDLE EAST AND AFRICA COGNITIVE OPERATIONS MARKET BY INDUSTRY VERTICAL (USD BILLION) 2020-2029
LIST OF FIGURES
FIGURE 1 MARKET DYNAMICS
FIGURE 2 MARKET SEGMENTATION
FIGURE 3 REPORT TIMELINES: YEARS CONSIDERED
FIGURE 4 DATA TRIANGULATION
FIGURE 5 BOTTOM-UP APPROACH
FIGURE 6 TOP-DOWN APPROACH
FIGURE 7 RESEARCH FLOW
FIGURE 8 GLOBAL COGNITIVE OPERATIONS MARKET BY DEPLOYMENT TYPE, USD BILLION, 2020-2029
FIGURE 9 GLOBAL COGNITIVE OPERATIONS MARKET BY APPLICATION, USD BILLION, 2020-2029
FIGURE 10 GLOBAL COGNITIVE OPERATIONS MARKET BY ENTERPRISE SIZE, USD BILLION, 2020-2029
FIGURE 11 GLOBAL COGNITIVE OPERATIONS MARKET BY COMPONENT, USD BILLION, 2020-2029
FIGURE 12 GLOBAL COGNITIVE OPERATIONS MARKET BY INDUSTRIAL VERTICAL, USD BILLION, 2020-2029
FIGURE 13 GLOBAL COGNITIVE OPERATIONS MARKET BY REGION, USD BILLION, 2020-2029
FIGURE 14 PORTER’S FIVE FORCES MODEL
FIGURE 15 GLOBAL COGNITIVE OPERATIONS MARKET BY DEPLOYMENT TYPE, USD BILLION, 2021
FIGURE 16 GLOBAL COGNITIVE OPERATIONS MARKET BY APPLICATION, USD BILLION, 2021
FIGURE 17 GLOBAL COGNITIVE OPERATIONS MARKET BY ENTERPRISE SIZE, USD BILLION, 2021
FIGURE 18 GLOBAL COGNITIVE OPERATIONS MARKET BY COMPONENT, USD BILLION, 2021
FIGURE 19 GLOBAL COGNITIVE OPERATIONS MARKET BY INDUSTRIAL VERTICAL, USD BILLION, 2021
FIGURE 20 GLOBAL COGNITIVE OPERATIONS MARKET BY REGION, USD BILLION, 2021
FIGURE 21 NORTH AMERICA COGNITIVE OPERATIONS MARKET SNAPSHOT
FIGURE 22 EUROPE COGNITIVE OPERATIONS MARKET SNAPSHOT
FIGURE 23 SOUTH AMERICA COGNITIVE OPERATIONS MARKET SNAPSHOT
FIGURE 24 ASIA PACIFIC COGNITIVE OPERATIONS MARKET SNAPSHOT
FIGURE 25 MIDDLE EAST ASIA AND AFRICA COGNITIVE OPERATIONS MARKET SNAPSHOT
FIGURE 26 MARKET SHARE ANALYSIS
FIGURE 27 IBM CORPORATION: COMPANY SNAPSHOT
FIGURE 28 MICRO FOCUS INTERNATIONAL PLC: COMPANY SNAPSHOT
FIGURE 29 BROADCOM CORPORATION: COMPANY SNAPSHOT
FIGURE 30 VMWARE INC.: COMPANY SNAPSHOT
FIGURE 31 SPLUNK INC.: COMPANY SNAPSHOT
FIGURE 32 CLOUDFABRIX: COMPANY SNAPSHOT
FIGURE 33 VERGE.IO: COMPANY SNAPSHOT
FIGURE 34 DAIKIN: COMPANY SNAPSHOT
FIGURE 35 HCL TECHNOLOGIES: COMPANY SNAPSHOT
FIGURE 36 CA TECHNOLOGIES: COMPANY SNAPSHOT
DOWNLOAD FREE SAMPLE REPORT
License Type
SPEAK WITH OUR ANALYST
Want to know more about the report or any specific requirement?
WANT TO CUSTOMIZE THE REPORT?
Our Clients Speak
We asked them to research ‘ Equipment market’ all over the world, and their whole arrangement was helpful to us. thehealthanalytics.com insightful analysis and reports contributed to our current analysis and in creating a future strategy. Besides, the te
Yosuke Mitsui
Senior Associate Construction Equipment Sales & Marketing
We asked them to research ‘Equipment market’ all over the world, and their whole arrangement was helpful to us. thehealthanalytics.com insightful analysis and reports contributed to our current analysis and in creating a future strategy. Besides, the te


