

Base Year Value ()
x.x %
x.x %
CAGR ()
x.x %
x.x %
Forecast Year Value ()
x.x %
x.x %
Historical Data Period
Largest Region
Forecast Period
バイオ殺虫剤市場:タイプ別(マクロビアル、微生物)、生物タイプ別(バキュロウイルス科、バチルス・チューリンゲンシス、ボーベリア・バシアナ)、用途別(土壌処理、葉面散布、種子処理)、地域別(北米、ヨーロッパ、アジア太平洋、南米、中東、アフリカ)2022年から2029年までの世界的な動向と予測
Instant access to hundreds of data points and trends
- Market estimates from 2014-2029
- Competitive analysis, industry segmentation, financial benchmarks
- Incorporates SWOT, Porter's Five Forces and risk management frameworks
- PDF report or online database with Word, Excel and PowerPoint export options
- 100% money back guarantee
生物殺虫剤市場の概要
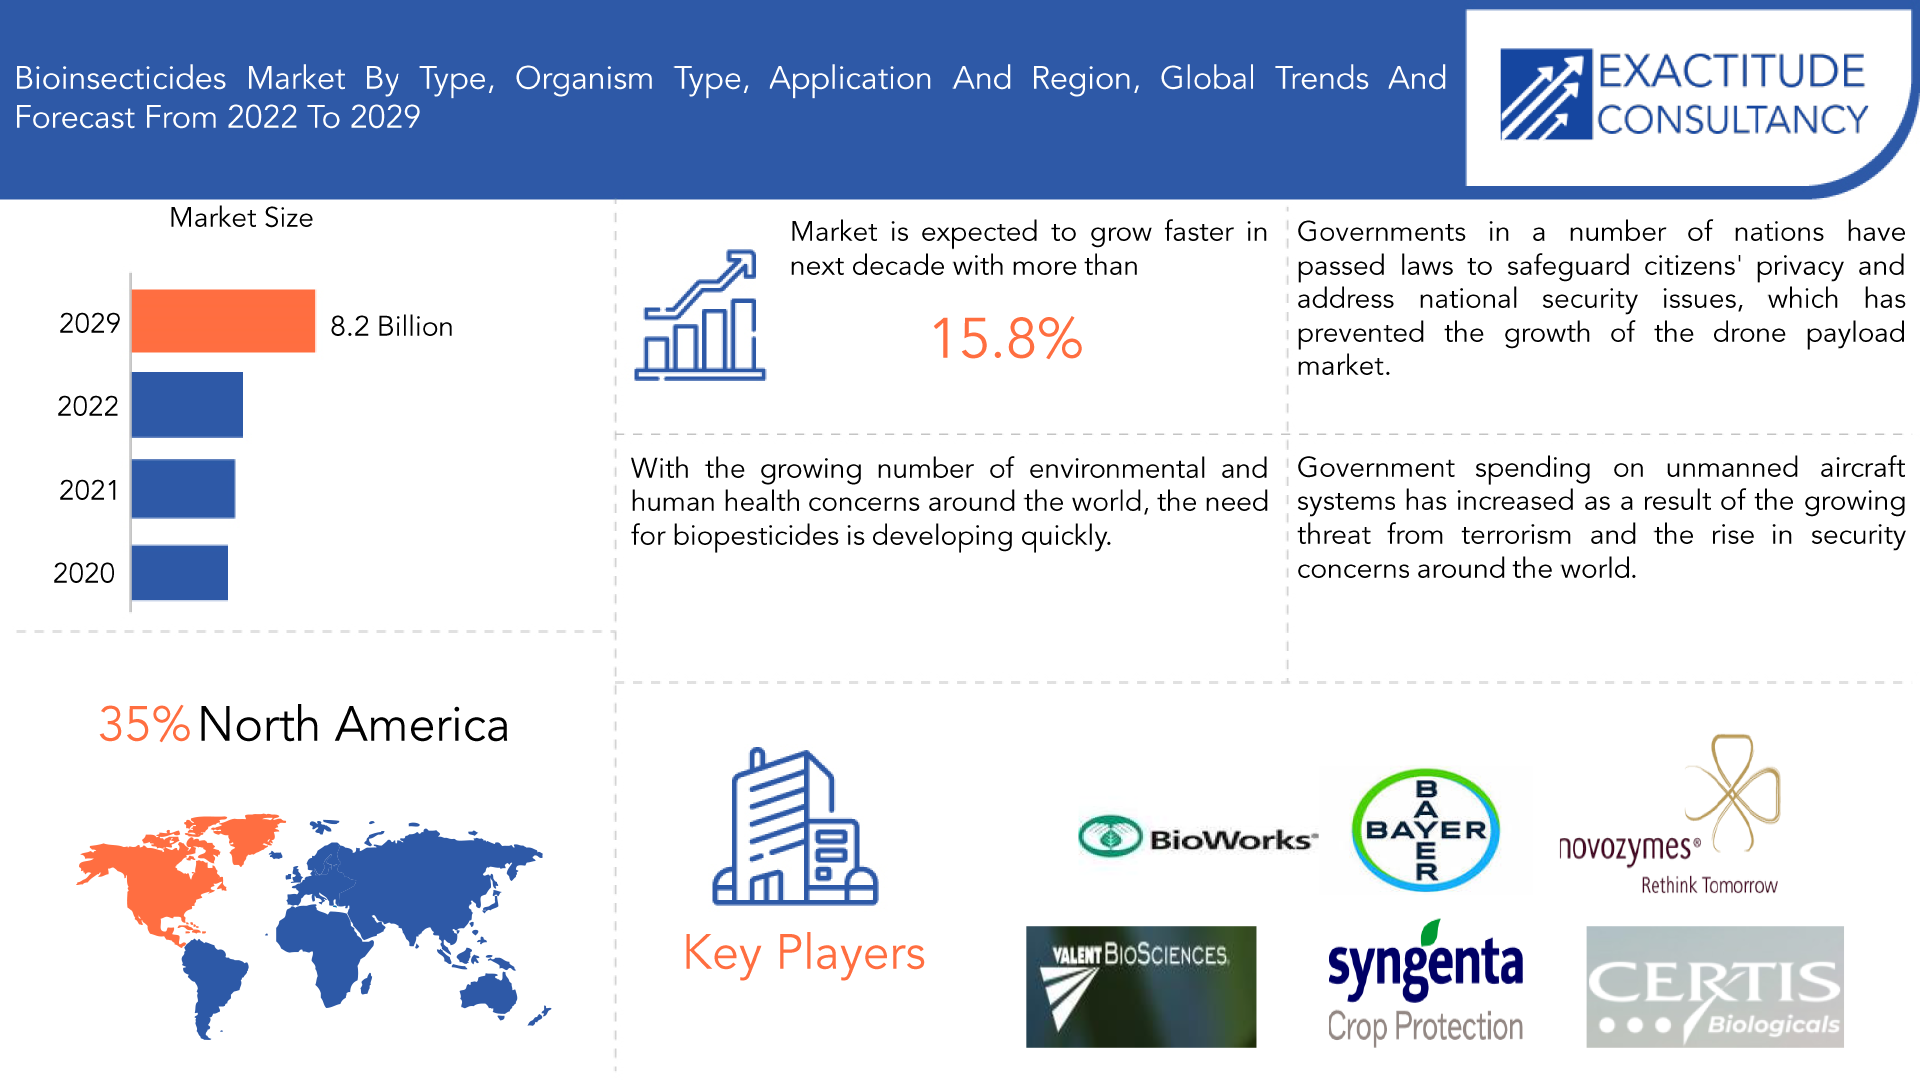
世界の生物殺虫剤市場は2022年に31億ドルと評価され、2029年には82億ドルに達すると予測されており、2022年から2029年にかけて年平均成長率15.8%で成長する。
バイオ殺虫剤は、昆虫を殺すために特別に設計された配合を持つバイオ農薬のサブクラスです。細菌、植物、動物、鉱物などの天然成分から作られています。収量と昆虫毒性を高めるために、合成または半合成の栄養培地も使用できます。合成培地は対象製品の収量を高めるために利用されるため、バイオ殺虫剤の製造コストは化学または従来のバイオ殺虫剤よりも高くなります。
バイオ殺虫剤 農作物の病気の増加、気候条件の変化による農作物への影響、従来の殺虫剤の悪影響によるバイオ殺虫剤の必要性など、さまざまな要因により、市場は大幅に拡大しています。化学殺虫剤は人間の健康に深刻な影響を与えます。化学殺虫剤が人に散布されると、目のかゆみ、水疱、発疹、失明、吐き気、めまい、下痢、さらには死に至ることもあります。農家や栽培者は、従来の殺虫剤の使用による悪影響についてより深く知るようになっています。その結果、彼らの大多数はバイオ殺虫剤に切り替えています。
| 属性 | 詳細 |
| 研究期間 | 2022-2029 |
| 基準年 | 2021 |
| 推定年 | 2022 |
| 予測年 | 2022-2029 |
| 歴史的時代 | 2018-2020 |
| ユニット | 金額(10億米ドル)、量(千リットル) |
| セグメンテーション | タイプ別、生物タイプ別、用途別、地域別。 |
| タイプ別 |
|
| 生物の種類別 |
|
| アプリケーション別 |
|
| 地域別 |
|
化学殺虫剤が人間の健康と環境に与える悪影響について、懸念が高まっています。バイオ殺虫剤は、天然資源から抽出され、非標的生物に対する毒性が低いことが多いため、より持続可能で環境に優しい代替品です。, 有機で持続可能な食品生産の需要が高まっており、農業におけるバイオ殺虫剤の使用が増加しています。消費者は、化学殺虫剤に関連する潜在的な健康リスクを認識するようになり、より安全で持続可能な方法で生産された食品を求めています。バイオテクノロジーと遺伝子工学の進歩により、新しい、より効果的なバイオ殺虫剤が開発されました。これらの新製品は、多くの場合、よりターゲットを絞って選択的であるため、非標的生物への危害のリスクを最小限に抑えながら、より効果的な害虫管理が可能になります。
全体として、より安全で持続可能な害虫管理ソリューションに対する需要の高まりとバイオテクノロジーの進歩が、生物殺虫剤市場の成長を促進しています。
[キャプション id="attachment_19863" align="aligncenter" width="1920"]
Frequently Asked Questions
What is the worth of the global bioinsecticides market?
The global bioinsecticides market was valued at 3.1 billion in 2022 and is projected to reach 8.2 billion by 2029, growing at a CAGR of 15.8% from 2022 to 2029
Which market segments are covered in the report on the bioinsecticides market?
Based on type, organism type, application, and region the bioinsecticides market reports divisions are broken down.
What is the CAGR of the bioinsecticides market?
The global bioinsecticides market registered a CAGR of 15.8% from 2022 to 2029. The industry segment was the highest revenue contributor to the market.
Which are the top companies to hold the market share in the bioinsecticides market?
Key players profiled in the report include BASF SE, BAYER AG, BIOBEST Group NV, Certis USA LLC, Novozymes A/S, Marrone Bio Innovations, Syngenta AG, NUFARM, Som Phytopharma India Ltd, Valent Biosciences LLC, BioWorks Inc., and others
Which is the largest regional market for the bioinsecticides market?
The North American region accounted for the majority of the bioinsecticides market. One of the top exporters of various fruits and vegetables is the US. Customers are switching to crop products without residues in their diets. The use of bioinsecticides is being pushed by an increase in public awareness of pesticide residue levels in crops. Additionally, the substantial business presence in the US has stimulated interest in and funding for the development of biological crop protection solutions.
Bioinsecticides Market Segment Analysis
Based on type, organism type, application, and region, the global market for bioinsecticides is divided into these categories.
On the basis of types, the bioinsecticides market is divided into Macrobials and Microbials. The Type segment of the Global bioinsecticides Market has increased levels of appeal. The largest market share in 2021 belongs to the microbial sector. By 2030, it is predicted to hold the largest market share. Microbial bioinsecticides are a type of bioinsecticide that are derived from naturally occurring microorganisms such as bacteria, fungi, and viruses. These bioinsecticides work by infecting and killing the target pest, either through direct toxicity or by inducing disease. One example of a microbial bioinsecticide is Bacillus thuringiensis (Bt), a bacterium that produces a toxin that is lethal to certain insect larvae. Bt has been used for many years as a bio insecticide in agriculture, particularly in organic farming, as it is considered safe for humans and non-target organisms. Microbial bioinsecticides offer several advantages over chemical pesticides, including being safer for humans and non-target organisms, more environmentally friendly, and less likely to lead to the development of pest resistance. However, they can be less effective than chemical pesticides and may require more frequent applications to achieve the same level of pest control.
The demand for biologically based pesticides to minimize pollution and toxic residue levels from the environment, as well as the growing farmer concern for human health and the environment, is what is causing the segment to rise. Microbial pesticides' active ingredient is a microorganism, such as a bacterium, fungus, virus, or protozoan.
Also, On the basis of organism type market is divided into three categories: Baculoviridae, Bacillus Thuringiensis, and Beauveria Bassiana. In 2021, the Baculoviridae category will hold the most market share. By 2030, it is predicted to hold the largest market share (34.16%).
Additionally, the section for bacillus thuringiensis is expanding at the quickest rate. The most popular type of bioinsecticide worldwide is produced by the bacterial species bacillus thringieensis (bt). Bt bioinsecticides based on the strain Bt subsp. kurstaki (Btk) is extensively used in agriculture to specifically kill pest lepidopteran larvae. Baculoviruses have been used in agriculture all over the world to control insects. Due to their broad use in biological production, they are increasingly being utilized in integrated agricultural production systems.
[caption id="attachment_19881" align="aligncenter" width="1920"]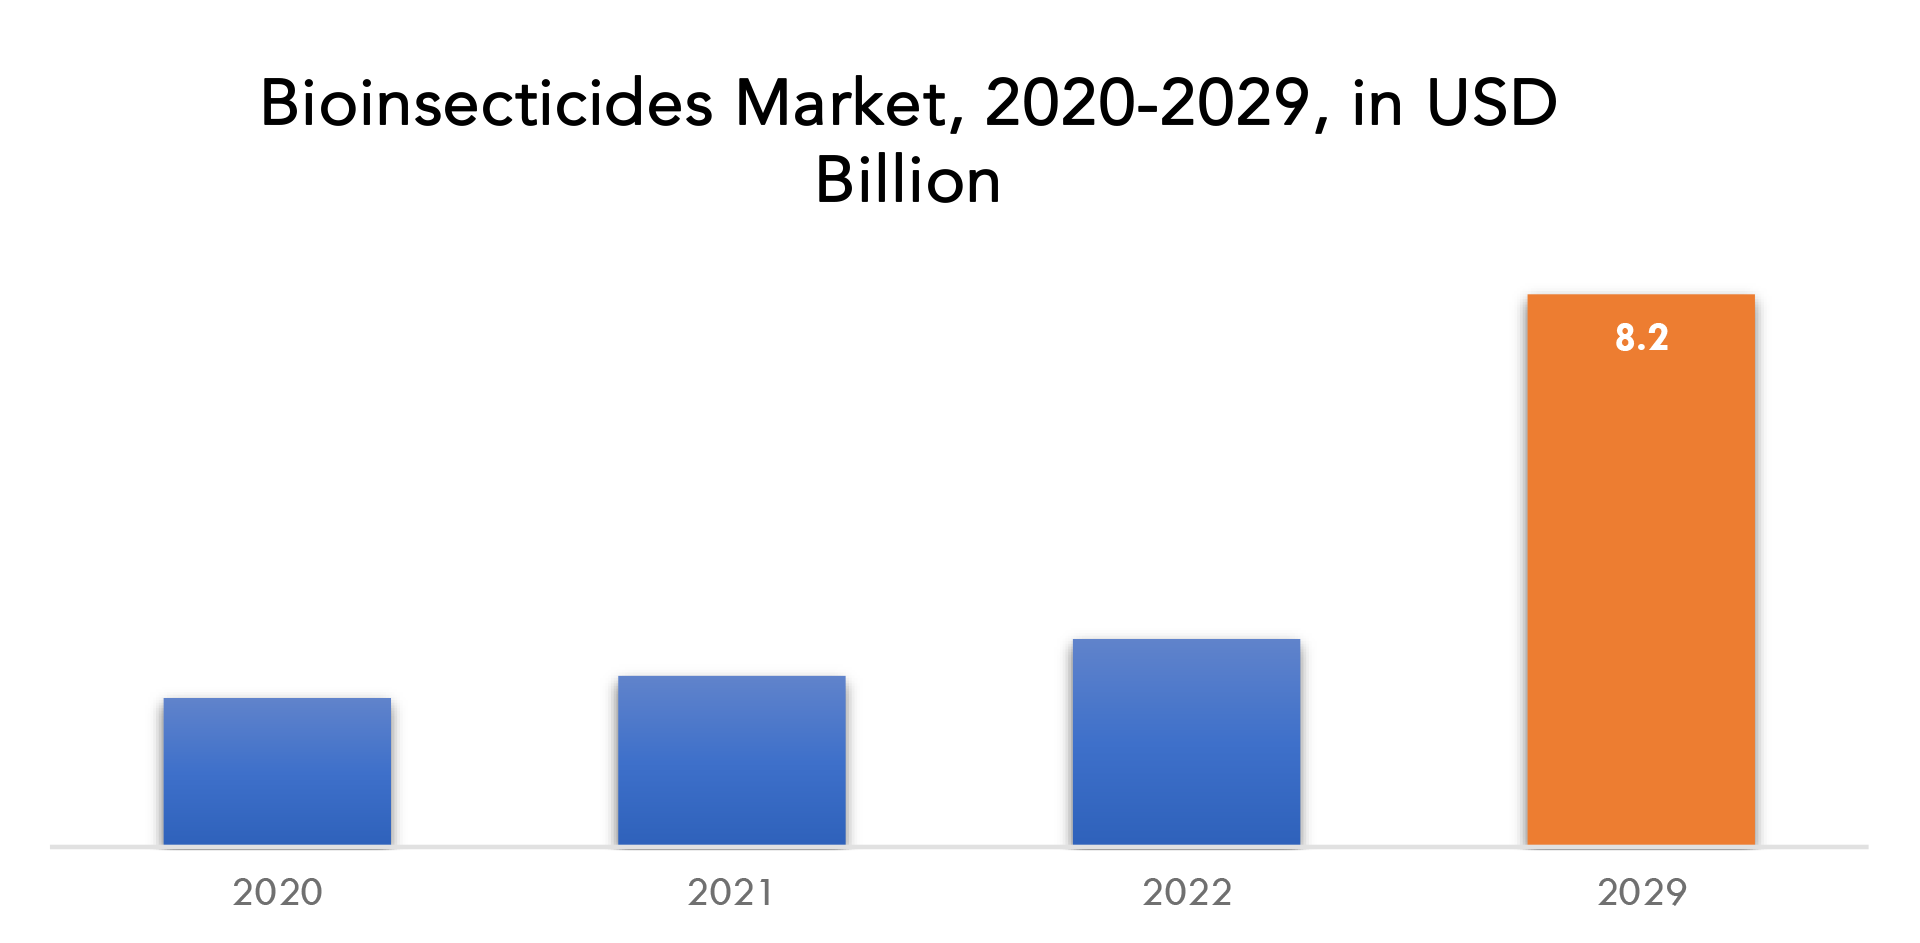
Bioinsecticides Market Players
The major players operating in the global Bioinsecticides industry include the major market players BASF SE, BAYER AG, BIOBEST Group NV, CERTIS USA LLC, Novozymes A/S, Marrone Bio Innovations, Syngenta AG, NUFARM, Som PHYTOPHARMA India Ltd, Valent Biosciences LLC, BIOWORKS Inc., and other. News:- 14 March 2023: Bayer collaborated with Microsoft to unveil new cloud-based enterprise solutions, advancing innovation and transparency in the agri-food industry.
- 13 February 2023: Bayer completed its acquisition of Blackford Analysis Ltd.
Who Should Buy? Or Key stakeholders
- Manufacturing
- End-Use Industries
- BFSI
- Mining & Metal
- Manufacturing & Construction
- Regulatory Authorities
- Research Organizations
- Metal Processing Industries
- Telecommunication
Bioinsecticides Market Regional Analysis
Geographically, the Bioinsecticides market is segmented into North America, South America, Europe, APAC, and MEA.
- North America: includes the US, Canada, Mexico
- Europe: includes the UK, Germany, France, Italy, Spain, Russia, and the Rest of Europe
- Asia Pacific: includes China, Japan, South Korea, India, Australia, ASEAN, and the Rest of APAC
- South America: includes Brazil, Argentina, and the Rest of South America
- Middle East & Africa: includes Turkey, UAE, Saudi Arabia, South Africa, and the Rest of MEA
The North American region accounted for the majority of the bioinsecticides market. One of the top exporters of various fruits and vegetables is the US. Customers are switching to crop products without residues in their diets. The use of bioinsecticides is being pushed by an increase in public awareness of pesticide residue levels in crops. Additionally, the substantial business presence in the US has stimulated interest in and funding for the development of biological crop protection solutions.
[caption id="attachment_19884" align="aligncenter" width="1920"]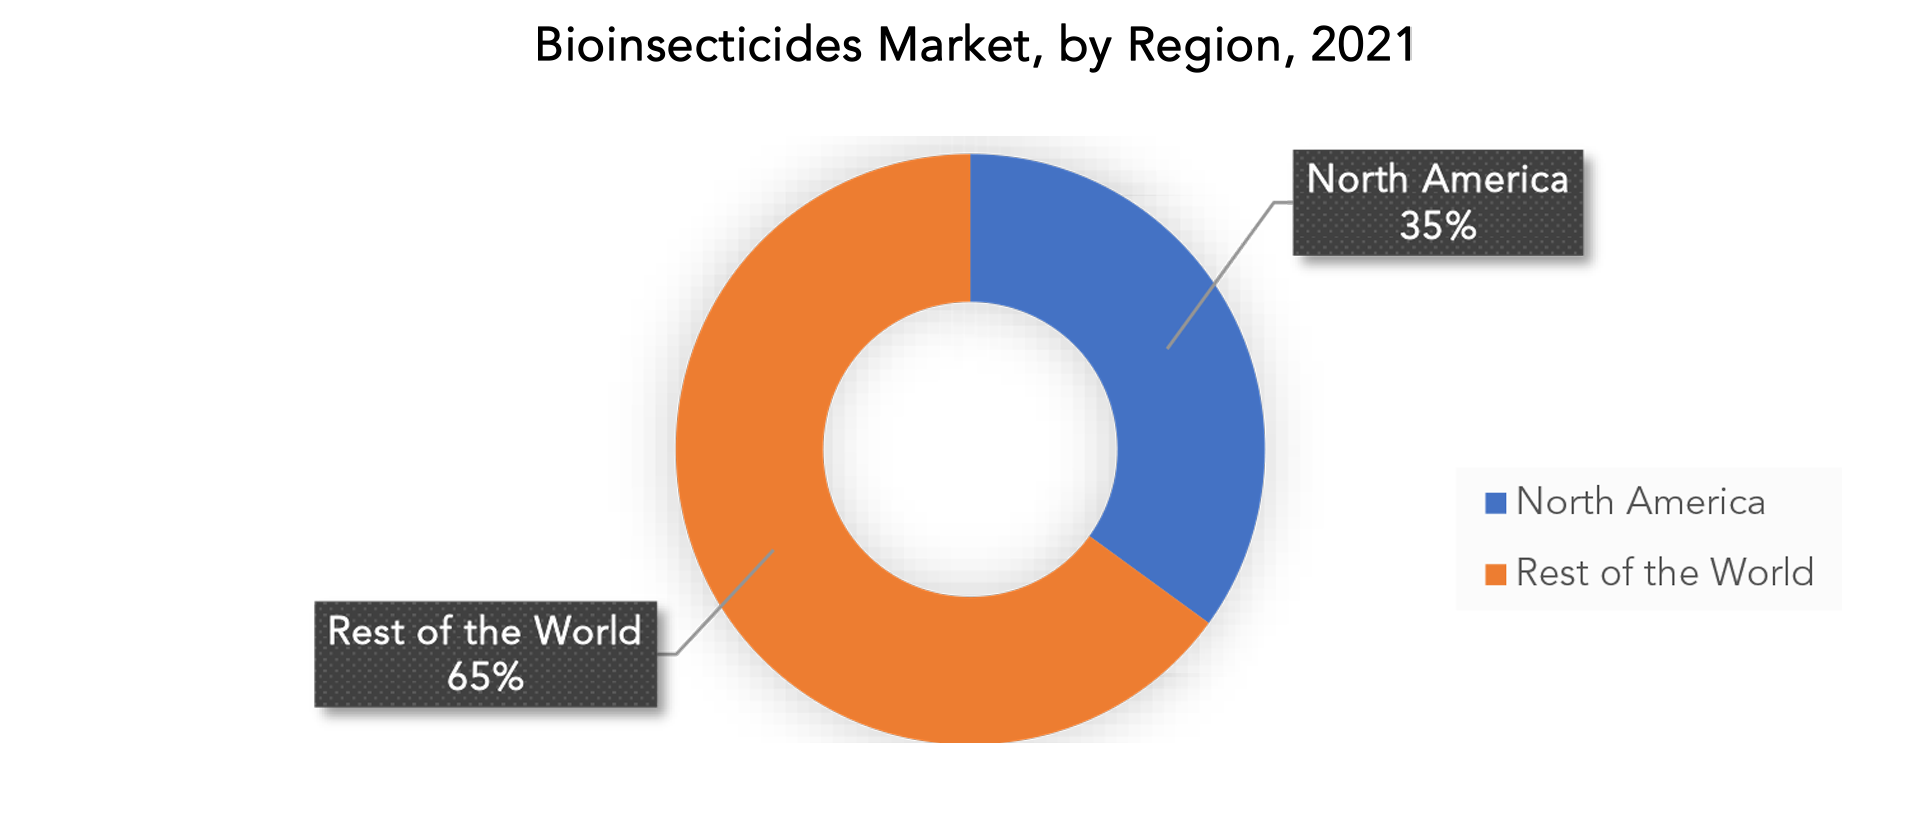
Key Market Segments: Bioinsecticides Market
Bioinsecticides Market By Type, 2020-2029, (USD Billion) (Thousand Liter)- Macrobials
- Microbials
- Baculoviridae
- Bacillus Thuringiensis
- Beauveria Bassiana
- Soil Treatment
- Foliar Spray
- Seed Treatment
- North America
- Europe
- Asia Pacific
- South America
- Middle East And Africa
Exactitude Consultancy Services Key Objectives
- Increasing sales and market share
- Developing new technology
- Improving profitability
- Entering new markets
- Enhancing brand reputation
Key Question Answered
- What is the expected growth rate of the bioinsecticides market over the next 7 years?
- Who are the major players in the bioinsecticides market and what is their market share?
- What are the end-user industries driving demand for the market and what is their outlook?
- What are the opportunities for growth in emerging markets such as Asia-Pacific, the Middle East, and Africa?
- How is the economic environment affecting the bioinsecticides market, including factors such as interest rates, inflation, and exchange rates?
- What is the expected impact of government policies and regulations on the bioinsecticides market?
- What is the current and forecasted size and growth rate of the global bioinsecticides market?
- What are the key drivers of growth in the bioinsecticides market?
- Who are the major players in the market and what is their market share?
- What are the distribution channels and supply chain dynamics in the bioinsecticides market?
- What are the technological advancements and innovations in the bioinsecticides market and their impact on product development and growth?
- What are the regulatory considerations and their impact on the market?
- What are the challenges faced by players in the bioinsecticides market and how are they addressing these challenges?
- What are the opportunities for growth and expansion in the bioinsecticides market?
- What are the product offerings and specifications of leading players in the market?
- 導入
- 市場の定義
- 市場セグメンテーション
- 研究タイムライン
- 前提と制限
- 研究方法
- データマイニング
- 二次調査
- 一次研究
- 専門家のアドバイス
- 品質チェック
- 最終レビュー
- データ三角測量
- ボトムアップアプローチ
- トップダウンアプローチ
- 研究の流れ
- データソース
- データマイニング
- エグゼクティブサマリー
- 市場概要
- 世界の生物殺虫剤市場の見通し
- 市場の推進要因
- 市場の制約
- 市場機会
- COVID-19が生物殺虫剤市場に与える影響
- ポーターの5つの力モデル
- 新規参入からの脅威
- 代替選手からの脅威
- サプライヤーの交渉力
- 顧客の交渉力
- 競争の度合い
- 業界バリューチェーン分析
- 世界の生物殺虫剤市場の見通し
- 世界の生物殺虫剤市場(タイプ別)、2020~2029年(10億米ドル)(千リットル)
- デコレーションペーパー
- 剥離紙
- 包装紙
- 印刷用紙
- 2020年~2029年の世界生物殺虫剤市場(生物種別、単位:10億米ドル)(千リットル)
- 建築・建設
- 工業用
- 包装とラベル
- 印刷と書き込み
- 世界の生物殺虫剤市場(用途別)、2020~2029年(10億米ドル)(千リットル)
- パルプ
- フィラーとバインダー
- 添加物
- コーティング
- 世界の生物殺虫剤市場(地域別)、2020~2029年(10億米ドル)(千リットル)
- 北米
- 私たち
- カナダ
- メキシコ
- 南アメリカ
- ブラジル
- アルゼンチン
- コロンビア
- 南米のその他の地域
- ヨーロッパ
- ドイツ
- 英国
- フランス
- イタリア
- スペイン
- ロシア
- その他のヨーロッパ
- アジア太平洋
- インド
- 中国
- 日本
- 韓国
- オーストラリア
- 東南アジア
- その他のアジア太平洋地域
- 中東・アフリカ
- アラブ首長国連邦
- サウジアラビア
- 南アフリカ
- その他の中東およびアフリカ
- 北米
- 会社概要*(事業概要、会社概要、提供製品、最近の動向)
- BASF SE.
- バイエルAG
- バイオベストグループNV
- CERTIS USA LLC
- ノボザイムズA/S
- マローネバイオイノベーション
- シンジェンタAG
- ニューファーム
- ソムフィトファーマインド株式会社
- ヴァレントバイオサイエンスLLC
- BIOWORKS INC. *THE COMPANY LIST IS INDICATIVE
LIST OF TABLES
TABLE 1 GLOBAL BIOINSECTICIDES MARKET BY TYPE (USD BILLION) 2020-2029
TABLE 2 GLOBAL BIOINSECTICIDES MARKET BY TYPE (THOUSAND LITER) 2020-2029
TABLE 3 GLOBAL BIOINSECTICIDES MARKET BY ORGANISM TYPE (USD BILLION) 2020-2029
TABLE 4 GLOBAL BIOINSECTICIDES MARKET BY ORGANISM TYPE (THOUSAND LITER) 2020-2029
TABLE 5 GLOBAL BIOINSECTICIDES MARKET BY APPLICATION (USD BILLION) 2020-2029
TABLE 6 GLOBAL BIOINSECTICIDES MARKET BY APPLICATION (THOUSAND LITER) 2020-2029
TABLE 7 GLOBAL BIOINSECTICIDES MARKET BY REGION (USD BILLION) 2020-2029
TABLE 8 GLOBAL BIOINSECTICIDES MARKET BY REGION (THOUSAND LITER) 2020-2029
TABLE 9 NORTH AMERICA BIOINSECTICIDES MARKET BY TYPE (USD BILLION) 2020-2029
TABLE 10 NORTH AMERICA BIOINSECTICIDES MARKET BY TYPE (THOUSAND LITER) 2020-2029
TABLE 11 NORTH AMERICA BIOINSECTICIDES MARKET BY ORGANISM TYPE (USD BILLION) 2020-2029
TABLE 12 NORTH AMERICA BIOINSECTICIDES MARKET BY ORGANISM TYPE (THOUSAND LITER) 2020-2029
TABLE 13 NORTH AMERICA BIOINSECTICIDES MARKET BY APPLICATION (USD BILLION) 2020-2029
TABLE 14 NORTH AMERICA BIOINSECTICIDES MARKET BY APPLICATION (THOUSAND LITER) 2020-2029
TABLE 15 NORTH AMERICA BIOINSECTICIDES MARKET BY COUNTRY (USD BILLION) 2020-2029
TABLE 16 NORTH AMERICA BIOINSECTICIDES MARKET BY COUNTRY (THOUSAND LITER) 2020-2029
TABLE 17 US BIOINSECTICIDES MARKET BY TYPE (USD BILLION) 2020-2029
TABLE 18 US BIOINSECTICIDES MARKET BY TYPE (THOUSAND LITER) 2020-2029
TABLE 19 US BIOINSECTICIDES MARKET BY ORGANISM TYPE (USD BILLION) 2020-2029
TABLE 20 US BIOINSECTICIDES MARKET BY ORGANISM TYPE (THOUSAND LITER) 2020-2029
TABLE 21 US BIOINSECTICIDES MARKET BY APPLICATION (USD BILLION) 2020-2029
TABLE 22 US BIOINSECTICIDES MARKET BY APPLICATION (THOUSAND LITER) 2020-2029
TABLE 23 CANADA BIOINSECTICIDES MARKET BY TYPE (USD BILLION) 2020-2029
TABLE 24 CANADA BIOINSECTICIDES MARKET BY TYPE (THOUSAND LITER) 2020-2029
TABLE 25 CANADA BIOINSECTICIDES MARKET BY ORGANISM TYPE (USD BILLION) 2020-2029
TABLE 26 CANADA BIOINSECTICIDES MARKET BY ORGANISM TYPE (THOUSAND LITER) 2020-2029
TABLE 27 CANADA BIOINSECTICIDES MARKET BY APPLICATION (USD BILLION) 2020-2029
TABLE 28 CANADA BIOINSECTICIDES MARKET BY APPLICATION (THOUSAND LITER) 2020-2029
TABLE 29 MEXICO BIOINSECTICIDES MARKET BY TYPE (USD BILLION) 2020-2029
TABLE 30 MEXICO BIOINSECTICIDES MARKET BY TYPE (THOUSAND LITER) 2020-2029
TABLE 31 MEXICO BIOINSECTICIDES MARKET BY ORGANISM TYPE (USD BILLION) 2020-2029
TABLE 32 MEXICO BIOINSECTICIDES MARKET BY ORGANISM TYPE (THOUSAND LITER) 2020-2029
TABLE 33 MEXICO BIOINSECTICIDES MARKET BY APPLICATION (USD BILLION) 2020-2029
TABLE 34 MEXICO BIOINSECTICIDES MARKET BY APPLICATION (THOUSAND LITER) 2020-2029
TABLE 35 SOUTH AMERICA BIOINSECTICIDES MARKET BY TYPE (USD BILLION) 2020-2029
TABLE 36 SOUTH AMERICA BIOINSECTICIDES MARKET BY TYPE (THOUSAND LITER) 2020-2029
TABLE 37 SOUTH AMERICA BIOINSECTICIDES MARKET BY ORGANISM TYPE (USD BILLION) 2020-2029
TABLE 38 SOUTH AMERICA BIOINSECTICIDES MARKET BY ORGANISM TYPE (THOUSAND LITER) 2020-2029
TABLE 39 SOUTH AMERICA BIOINSECTICIDES MARKET BY APPLICATION (USD BILLION) 2020-2029
TABLE 40 SOUTH AMERICA BIOINSECTICIDES MARKET BY APPLICATION (THOUSAND LITER) 2020-2029
TABLE 41 SOUTH AMERICA BIOINSECTICIDES MARKET BY COUNTRY (USD BILLION) 2020-2029
TABLE 42 SOUTH AMERICA BIOINSECTICIDES MARKET BY COUNTRY (THOUSAND LITER) 2020-2029
TABLE 43 BRAZIL BIOINSECTICIDES MARKET BY TYPE (USD BILLION) 2020-2029
TABLE 44 BRAZIL BIOINSECTICIDES MARKET BY TYPE (THOUSAND LITER) 2020-2029
TABLE 45 BRAZIL BIOINSECTICIDES MARKET BY ORGANISM TYPE (USD BILLION) 2020-2029
TABLE 46 BRAZIL BIOINSECTICIDES MARKET BY ORGANISM TYPE (THOUSAND LITER) 2020-2029
TABLE 47 BRAZIL BIOINSECTICIDES MARKET BY APPLICATION (USD BILLION) 2020-2029
TABLE 48 BRAZIL BIOINSECTICIDES MARKET BY APPLICATION (THOUSAND LITER) 2020-2029
TABLE 49 ARGENTINA BIOINSECTICIDES MARKET BY TYPE (USD BILLION) 2020-2029
TABLE 50 ARGENTINA BIOINSECTICIDES MARKET BY TYPE (THOUSAND LITER) 2020-2029
TABLE 51 ARGENTINA BIOINSECTICIDES MARKET BY ORGANISM TYPE (USD BILLION) 2020-2029
TABLE 52 ARGENTINA BIOINSECTICIDES MARKET BY ORGANISM TYPE (THOUSAND LITER) 2020-2029
TABLE 53 ARGENTINA BIOINSECTICIDES MARKET BY APPLICATION (USD BILLION) 2020-2029
TABLE 54 ARGENTINA BIOINSECTICIDES MARKET BY APPLICATION (THOUSAND LITER) 2020-2029
TABLE 55 COLOMBIA BIOINSECTICIDES MARKET BY TYPE (USD BILLION) 2020-2029
TABLE 56 COLOMBIA BIOINSECTICIDES MARKET BY TYPE (THOUSAND LITER) 2020-2029
TABLE 57 COLOMBIA BIOINSECTICIDES MARKET BY ORGANISM TYPE (USD BILLION) 2020-2029
TABLE 58 COLOMBIA BIOINSECTICIDES MARKET BY ORGANISM TYPE (THOUSAND LITER) 2020-2029
TABLE 59 COLOMBIA BIOINSECTICIDES MARKET BY APPLICATION (USD BILLION) 2020-2029
TABLE 60 COLOMBIA BIOINSECTICIDES MARKET BY APPLICATION (THOUSAND LITER) 2020-2029
TABLE 61 REST OF SOUTH AMERICA BIOINSECTICIDES MARKET BY TYPE (USD BILLION) 2020-2029
TABLE 62 REST OF SOUTH AMERICA BIOINSECTICIDES MARKET BY TYPE (THOUSAND LITER) 2020-2029
TABLE 63 REST OF SOUTH AMERICA BIOINSECTICIDES MARKET BY ORGANISM TYPE (USD BILLION) 2020-2029
TABLE 64 REST OF SOUTH AMERICA BIOINSECTICIDES MARKET BY ORGANISM TYPE (THOUSAND LITER) 2020-2029
TABLE 65 REST OF SOUTH AMERICA BIOINSECTICIDES MARKET BY APPLICATION (USD BILLION) 2020-2029
TABLE 66 REST OF SOUTH AMERICA BIOINSECTICIDES MARKET BY APPLICATION (THOUSAND LITER) 2020-2029
TABLE 67 ASIA-PACIFIC BIOINSECTICIDES MARKET BY TYPE (USD BILLION) 2020-2029
TABLE 68 ASIA-PACIFIC BIOINSECTICIDES MARKET BY TYPE (THOUSAND LITER) 2020-2029
TABLE 69 ASIA-PACIFIC BIOINSECTICIDES MARKET BY ORGANISM TYPE (USD BILLION) 2020-2029
TABLE 70 ASIA-PACIFIC BIOINSECTICIDES MARKET BY ORGANISM TYPE (THOUSAND LITER) 2020-2029
TABLE 71 ASIA-PACIFIC BIOINSECTICIDES MARKET BY APPLICATION (USD BILLION) 2020-2029
TABLE 72 ASIA-PACIFIC BIOINSECTICIDES MARKET BY APPLICATION (THOUSAND LITER) 2020-2029
TABLE 73 ASIA-PACIFIC BIOINSECTICIDES MARKET BY COUNTRY (USD BILLION) 2020-2029
TABLE 74 ASIA-PACIFIC BIOINSECTICIDES MARKET BY COUNTRY (THOUSAND LITER) 2020-2029
TABLE 75 INDIA BIOINSECTICIDES MARKET BY TYPE (USD BILLION) 2020-2029
TABLE 76 INDIA BIOINSECTICIDES MARKET BY TYPE (THOUSAND LITER) 2020-2029
TABLE 77 INDIA BIOINSECTICIDES MARKET BY ORGANISM TYPE (USD BILLION) 2020-2029
TABLE 78 INDIA BIOINSECTICIDES MARKET BY ORGANISM TYPE (THOUSAND LITER) 2020-2029
TABLE 79 INDIA BIOINSECTICIDES MARKET BY APPLICATION (USD BILLION) 2020-2029
TABLE 80 INDIA BIOINSECTICIDES MARKET BY APPLICATION (THOUSAND LITER) 2020-2029
TABLE 81 CHINA BIOINSECTICIDES MARKET BY TYPE (USD BILLION) 2020-2029
TABLE 82 CHINA BIOINSECTICIDES MARKET BY TYPE (THOUSAND LITER) 2020-2029
TABLE 83 CHINA BIOINSECTICIDES MARKET BY ORGANISM TYPE (USD BILLION) 2020-2029
TABLE 84 CHINA BIOINSECTICIDES MARKET BY ORGANISM TYPE (THOUSAND LITER) 2020-2029
TABLE 85 CHINA BIOINSECTICIDES MARKET BY APPLICATION (USD BILLION) 2020-2029
TABLE 86 CHINA BIOINSECTICIDES MARKET BY APPLICATION (THOUSAND LITER) 2020-2029
TABLE 87 JAPAN BIOINSECTICIDES MARKET BY TYPE (USD BILLION) 2020-2029
TABLE 88 JAPAN BIOINSECTICIDES MARKET BY TYPE (THOUSAND LITER) 2020-2029
TABLE 89 JAPAN BIOINSECTICIDES MARKET BY ORGANISM TYPE (USD BILLION) 2020-2029
TABLE 90 JAPAN BIOINSECTICIDES MARKET BY ORGANISM TYPE (THOUSAND LITER) 2020-2029
TABLE 91 JAPAN BIOINSECTICIDES MARKET BY APPLICATION (USD BILLION) 2020-2029
TABLE 92 JAPAN BIOINSECTICIDES MARKET BY APPLICATION (THOUSAND LITER) 2020-2029
TABLE 93 SOUTH KOREA BIOINSECTICIDES MARKET BY TYPE (USD BILLION) 2020-2029
TABLE 94 SOUTH KOREA BIOINSECTICIDES MARKET BY TYPE (THOUSAND LITER) 2020-2029
TABLE 95 SOUTH KOREA BIOINSECTICIDES MARKET BY ORGANISM TYPE (USD BILLION) 2020-2029
TABLE 96 SOUTH KOREA BIOINSECTICIDES MARKET BY ORGANISM TYPE (THOUSAND LITER) 2020-2029
TABLE 97 SOUTH KOREA BIOINSECTICIDES MARKET BY APPLICATION (USD BILLION) 2020-2029
TABLE 98 SOUTH KOREA BIOINSECTICIDES MARKET BY APPLICATION (THOUSAND LITER) 2020-2029
TABLE 99 AUSTRALIA BIOINSECTICIDES MARKET BY TYPE (USD BILLION) 2020-2029
TABLE 100 AUSTRALIA BIOINSECTICIDES MARKET BY TYPE (THOUSAND LITER) 2020-2029
TABLE 101 AUSTRALIA BIOINSECTICIDES MARKET BY ORGANISM TYPE (USD BILLION) 2020-2029
TABLE 102 AUSTRALIA BIOINSECTICIDES MARKET BY ORGANISM TYPE (THOUSAND LITER) 2020-2029
TABLE 103 AUSTRALIA BIOINSECTICIDES MARKET BY APPLICATION (USD BILLION) 2020-2029
TABLE 104 AUSTRALIA BIOINSECTICIDES MARKET BY APPLICATION (THOUSAND LITER) 2020-2029
TABLE 105 SOUTH-EAST ASIA BIOINSECTICIDES MARKET BY TYPE (USD BILLION) 2020-2029
TABLE 106 SOUTH-EAST ASIA BIOINSECTICIDES MARKET BY TYPE (THOUSAND LITER) 2020-2029
TABLE 107 SOUTH-EAST ASIA BIOINSECTICIDES MARKET BY ORGANISM TYPE (USD BILLION) 2020-2029
TABLE 108 SOUTH-EAST ASIA BIOINSECTICIDES MARKET BY ORGANISM TYPE (THOUSAND LITER) 2020-2029
TABLE 109 SOUTH-EAST ASIA BIOINSECTICIDES MARKET BY APPLICATION (USD BILLION) 2020-2029
TABLE 110 SOUTH-EAST ASIA BIOINSECTICIDES MARKET BY APPLICATION (THOUSAND LITER) 2020-2029
TABLE 111 REST OF ASIA PACIFIC BIOINSECTICIDES MARKET BY TYPE (USD BILLION) 2020-2029
TABLE 112 REST OF ASIA PACIFIC BIOINSECTICIDES MARKET BY TYPE (THOUSAND LITER) 2020-2029
TABLE 113 REST OF ASIA PACIFIC BIOINSECTICIDES MARKET BY ORGANISM TYPE (USD BILLION) 2020-2029
TABLE 114 REST OF ASIA PACIFIC BIOINSECTICIDES MARKET BY ORGANISM TYPE (THOUSAND LITER) 2020-2029
TABLE 115 REST OF ASIA PACIFIC BIOINSECTICIDES MARKET BY APPLICATION (USD BILLION) 2020-2029
TABLE 116 REST OF ASIA PACIFIC BIOINSECTICIDES MARKET BY APPLICATION (THOUSAND LITER) 2020-2029
TABLE 117 EUROPE BIOINSECTICIDES MARKET BY TYPE (USD BILLION) 2020-2029
TABLE 118 EUROPE BIOINSECTICIDES MARKET BY TYPE (THOUSAND LITER) 2020-2029
TABLE 119 EUROPE BIOINSECTICIDES MARKET BY ORGANISM TYPE (USD BILLION) 2020-2029
TABLE 120 EUROPE BIOINSECTICIDES MARKET BY ORGANISM TYPE (THOUSAND LITER) 2020-2029
TABLE 121 EUROPE BIOINSECTICIDES MARKET BY APPLICATION (USD BILLION) 2020-2029
TABLE 122 EUROPE BIOINSECTICIDES MARKET BY APPLICATION (THOUSAND LITER) 2020-2029
TABLE 123 EUROPE BIOINSECTICIDES MARKET BY COUNTRY (USD BILLION) 2020-2029
TABLE 124 EUROPE BIOINSECTICIDES MARKET BY COUNTRY (THOUSAND LITER) 2020-2029
TABLE 125 GERMANY BIOINSECTICIDES MARKET BY TYPE (USD BILLION) 2020-2029
TABLE 126 GERMANY BIOINSECTICIDES MARKET BY TYPE (THOUSAND LITER) 2020-2029
TABLE 127 GERMANY BIOINSECTICIDES MARKET BY ORGANISM TYPE (USD BILLION) 2020-2029
TABLE 128 GERMANY BIOINSECTICIDES MARKET BY ORGANISM TYPE (THOUSAND LITER) 2020-2029
TABLE 129 GERMANY BIOINSECTICIDES MARKET BY APPLICATION (USD BILLION) 2020-2029
TABLE 130 GERMANY BIOINSECTICIDES MARKET BY APPLICATION (THOUSAND LITER) 2020-2029
TABLE 131 UK BIOINSECTICIDES MARKET BY TYPE (USD BILLION) 2020-2029
TABLE 132 UK BIOINSECTICIDES MARKET BY TYPE (THOUSAND LITER) 2020-2029
TABLE 133 UK BIOINSECTICIDES MARKET BY ORGANISM TYPE (USD BILLION) 2020-2029
TABLE 134 UK BIOINSECTICIDES MARKET BY ORGANISM TYPE (THOUSAND LITER) 2020-2029
TABLE 135 UK BIOINSECTICIDES MARKET BY APPLICATION (USD BILLION) 2020-2029
TABLE 136 UK BIOINSECTICIDES MARKET BY APPLICATION (THOUSAND LITER) 2020-2029
TABLE 137 FRANCE BIOINSECTICIDES MARKET BY TYPE (USD BILLION) 2020-2029
TABLE 138 FRANCE BIOINSECTICIDES MARKET BY TYPE (THOUSAND LITER) 2020-2029
TABLE 139 FRANCE BIOINSECTICIDES MARKET BY ORGANISM TYPE (USD BILLION) 2020-2029
TABLE 140 FRANCE BIOINSECTICIDES MARKET BY ORGANISM TYPE (THOUSAND LITER) 2020-2029
TABLE 141 FRANCE BIOINSECTICIDES MARKET BY APPLICATION (USD BILLION) 2020-2029
TABLE 142 FRANCE BIOINSECTICIDES MARKET BY APPLICATION (THOUSAND LITER) 2020-2029
TABLE 143 ITALY BIOINSECTICIDES MARKET BY TYPE (USD BILLION) 2020-2029
TABLE 144 ITALY BIOINSECTICIDES MARKET BY TYPE (THOUSAND LITER) 2020-2029
TABLE 145 ITALY BIOINSECTICIDES MARKET BY ORGANISM TYPE (USD BILLION) 2020-2029
TABLE 146 ITALY BIOINSECTICIDES MARKET BY ORGANISM TYPE (THOUSAND LITER) 2020-2029
TABLE 147 ITALY BIOINSECTICIDES MARKET BY APPLICATION (USD BILLION) 2020-2029
TABLE 148 ITALY BIOINSECTICIDES MARKET BY APPLICATION (THOUSAND LITER) 2020-2029
TABLE 149 SPAIN BIOINSECTICIDES MARKET BY TYPE (USD BILLION) 2020-2029
TABLE 150 SPAIN BIOINSECTICIDES MARKET BY TYPE (THOUSAND LITER) 2020-2029
TABLE 151 SPAIN BIOINSECTICIDES MARKET BY ORGANISM TYPE (USD BILLION) 2020-2029
TABLE 152 SPAIN BIOINSECTICIDES MARKET BY ORGANISM TYPE (THOUSAND LITER) 2020-2029
TABLE 153 SPAIN BIOINSECTICIDES MARKET BY APPLICATION (USD BILLION) 2020-2029
TABLE 154 SPAIN BIOINSECTICIDES MARKET BY APPLICATION (THOUSAND LITER) 2020-2029
TABLE 155 RUSSIA BIOINSECTICIDES MARKET BY TYPE (USD BILLION) 2020-2029
TABLE 156 RUSSIA BIOINSECTICIDES MARKET BY TYPE (THOUSAND LITER) 2020-2029
TABLE 157 RUSSIA BIOINSECTICIDES MARKET BY ORGANISM TYPE (USD BILLION) 2020-2029
TABLE 158 RUSSIA BIOINSECTICIDES MARKET BY ORGANISM TYPE (THOUSAND LITER) 2020-2029
TABLE 159 RUSSIA BIOINSECTICIDES MARKET BY APPLICATION (USD BILLION) 2020-2029
TABLE 160 RUSSIA BIOINSECTICIDES MARKET BY APPLICATION (THOUSAND LITER) 2020-2029
TABLE 161 REST OF EUROPE BIOINSECTICIDES MARKET BY TYPE (USD BILLION) 2020-2029
TABLE 162 REST OF EUROPE BIOINSECTICIDES MARKET BY TYPE (THOUSAND LITER) 2020-2029
TABLE 163 REST OF EUROPE BIOINSECTICIDES MARKET BY ORGANISM TYPE (USD BILLION) 2020-2029
TABLE 164 REST OF EUROPE BIOINSECTICIDES MARKET BY ORGANISM TYPE (THOUSAND LITER) 2020-2029
TABLE 165 REST OF EUROPE BIOINSECTICIDES MARKET BY APPLICATION (USD BILLION) 2020-2029
TABLE 166 REST OF EUROPE BIOINSECTICIDES MARKET BY APPLICATION (THOUSAND LITER) 2020-2029
TABLE 167 MIDDLE EAST AND AFRICA BIOINSECTICIDES MARKET BY TYPE (USD BILLION) 2020-2029
TABLE 168 MIDDLE EAST AND AFRICA BIOINSECTICIDES MARKET BY TYPE (THOUSAND LITER) 2020-2029
TABLE 169 MIDDLE EAST AND AFRICA BIOINSECTICIDES MARKET BY ORGANISM TYPE (USD BILLION) 2020-2029
TABLE 170 MIDDLE EAST AND AFRICA BIOINSECTICIDES MARKET BY ORGANISM TYPE (THOUSAND LITER) 2020-2029
TABLE 171 MIDDLE EAST AND AFRICA BIOINSECTICIDES MARKET BY APPLICATION (USD BILLION) 2020-2029
TABLE 172 MIDDLE EAST AND AFRICA BIOINSECTICIDES MARKET BY APPLICATION (THOUSAND LITER) 2020-2029
TABLE 173 MIDDLE EAST AND AFRICA BIOINSECTICIDES MARKET BY COUNTRY (USD BILLION) 2020-2029
TABLE 174 MIDDLE EAST AND AFRICA BIOINSECTICIDES MARKET BY COUNTRY (THOUSAND LITER) 2020-2029
TABLE 175 UAE BIOINSECTICIDES MARKET BY TYPE (USD BILLION) 2020-2029
TABLE 176 UAE BIOINSECTICIDES MARKET BY TYPE (THOUSAND LITER) 2020-2029
TABLE 177 UAE BIOINSECTICIDES MARKET BY ORGANISM TYPE (USD BILLION) 2020-2029
TABLE 178 UAE BIOINSECTICIDES MARKET BY ORGANISM TYPE (THOUSAND LITER) 2020-2029
TABLE 179 UAE BIOINSECTICIDES MARKET BY APPLICATION (USD BILLION) 2020-2029
TABLE 180 UAE BIOINSECTICIDES MARKET BY APPLICATION (THOUSAND LITER) 2020-2029
TABLE 181 SAUDI ARABIA BIOINSECTICIDES MARKET BY TYPE (USD BILLION) 2020-2029
TABLE 182 SAUDI ARABIA BIOINSECTICIDES MARKET BY TYPE (THOUSAND LITER) 2020-2029
TABLE 183 SAUDI ARABIA BIOINSECTICIDES MARKET BY ORGANISM TYPE (USD BILLION) 2020-2029
TABLE 184 SAUDI ARABIA BIOINSECTICIDES MARKET BY ORGANISM TYPE (THOUSAND LITER) 2020-2029
TABLE 185 SAUDI ARABIA BIOINSECTICIDES MARKET BY APPLICATION (USD BILLION) 2020-2029
TABLE 186 SAUDI ARABIA BIOINSECTICIDES MARKET BY APPLICATION (THOUSAND LITER) 2020-2029
TABLE 187 SOUTH AFRICA BIOINSECTICIDES MARKET BY TYPE (USD BILLION) 2020-2029
TABLE 188 SOUTH AFRICA BIOINSECTICIDES MARKET BY TYPE (THOUSAND LITER) 2020-2029
TABLE 189 SOUTH AFRICA BIOINSECTICIDES MARKET BY ORGANISM TYPE (USD BILLION) 2020-2029
TABLE 190 SOUTH AFRICA BIOINSECTICIDES MARKET BY ORGANISM TYPE (THOUSAND LITER) 2020-2029
TABLE 191 SOUTH AFRICA BIOINSECTICIDES MARKET BY APPLICATION (USD BILLION) 2020-2029
TABLE 192 SOUTH AFRICA BIOINSECTICIDES MARKET BY APPLICATION (THOUSAND LITER) 2020-2029
TABLE 193 REST OF MIDDLE EAST AND AFRICA BIOINSECTICIDES MARKET BY TYPE (USD BILLION) 2020-2029
TABLE 194 REST OF MIDDLE EAST AND AFRICA BIOINSECTICIDES MARKET BY TYPE (THOUSAND LITER) 2020-2029
TABLE 195 REST OF MIDDLE EAST AND AFRICA BIOINSECTICIDES MARKET BY ORGANISM TYPE (USD BILLION) 2020-2029
TABLE 196 REST OF MIDDLE EAST AND AFRICA BIOINSECTICIDES MARKET BY ORGANISM TYPE (THOUSAND LITER) 2020-2029
TABLE 197 REST OF MIDDLE EAST AND AFRICA BIOINSECTICIDES MARKET BY APPLICATION (USD BILLION) 2020-2029
TABLE 198 REST OF MIDDLE EAST AND AFRICA BIOINSECTICIDES MARKET BY APPLICATION (THOUSAND LITER) 2020-2029
LIST OF FIGURES
FIGURE 1 MARKET DYNAMICS
FIGURE 2 MARKET SEGMENTATION
FIGURE 3 REPORT TIMELINES: YEARS CONSIDERED
FIGURE 4 DATA TRIANGULATION
FIGURE 5 BOTTOM-UP APPROACH
FIGURE 6 TOP-DOWN APPROACH
FIGURE 7 RESEARCH FLOW
FIGURE 8 GLOBAL BIOINSECTICIDES MARKET BY TYPE, USD BILLION, 2020-2029
FIGURE 9 GLOBAL BIOINSECTICIDES MARKET BY APPLICATION, USD BILLION, 2020-2029
FIGURE 10 GLOBAL BIOINSECTICIDES MARKET BY REGION, USD BILLION, 2020-2029
FIGURE 11 PORTER’S FIVE FORCES MODEL
FIGURE 12 GLOBAL BIOINSECTICIDES MARKET BY TYPE, USD BILLION, 2021
FIGURE 13 GLOBAL BIOINSECTICIDES MARKET BY APPLICATION, USD BILLION, 2021
FIGURE 14 GLOBAL BIOINSECTICIDES MARKET BY REGION, USD BILLION 2021
FIGURE 15 MARKET SHARE ANALYSIS
FIGURE 16 BASF SE: COMPANY SNAPSHOT
FIGURE 17 BAYER AG: COMPANY SNAPSHOT
FIGURE 18 BIOBEST GROUP NV: COMPANY SNAPSHOT
FIGURE 19 CERTIS USA LLC: COMPANY SNAPSHOT
FIGURE 20 NOVOZYMES A/S: COMPANY SNAPSHOT
FIGURE 21 MARRONE BIO INNOVATIONS: COMPANY SNAPSHOT
FIGURE 22 SYNGENTA AG: COMPANY SNAPSHOT
FIGURE 23 NUFARM: COMPANY SNAPSHOT
FIGURE 24 SOM PHYTOPHARMA INDIA LTD: COMPANY SNAPSHOT
FIGURE 25 VALENT BIOSCIENCES LLC: COMPANY SNAPSHOT
FIGURE 26 BIOWORKS INC.: COMPANY SNAPSHOT
DOWNLOAD FREE SAMPLE REPORT
License Type
SPEAK WITH OUR ANALYST
Want to know more about the report or any specific requirement?
WANT TO CUSTOMIZE THE REPORT?
Our Clients Speak
We asked them to research ‘ Equipment market’ all over the world, and their whole arrangement was helpful to us. thehealthanalytics.com insightful analysis and reports contributed to our current analysis and in creating a future strategy. Besides, the te
Yosuke Mitsui
Senior Associate Construction Equipment Sales & Marketing
We asked them to research ‘Equipment market’ all over the world, and their whole arrangement was helpful to us. thehealthanalytics.com insightful analysis and reports contributed to our current analysis and in creating a future strategy. Besides, the te


