

Base Year Value ()
x.x %
x.x %
CAGR ()
x.x %
x.x %
Forecast Year Value ()
x.x %
x.x %
Historical Data Period
Largest Region
Forecast Period
スマート ビルディング市場 (コンポーネント (ソリューション、サービス)、ビルディング タイプ (住宅、商業、工業)、および地域 (北米、アジア太平洋、ヨーロッパ、ラテン アメリカ、中東、アフリカ) 別)。2022 年から 2029 年までの世界的な傾向と予測。
Instant access to hundreds of data points and trends
- Market estimates from 2014-2029
- Competitive analysis, industry segmentation, financial benchmarks
- Incorporates SWOT, Porter's Five Forces and risk management frameworks
- PDF report or online database with Word, Excel and PowerPoint export options
- 100% money back guarantee
スマートビルディング市場の概要
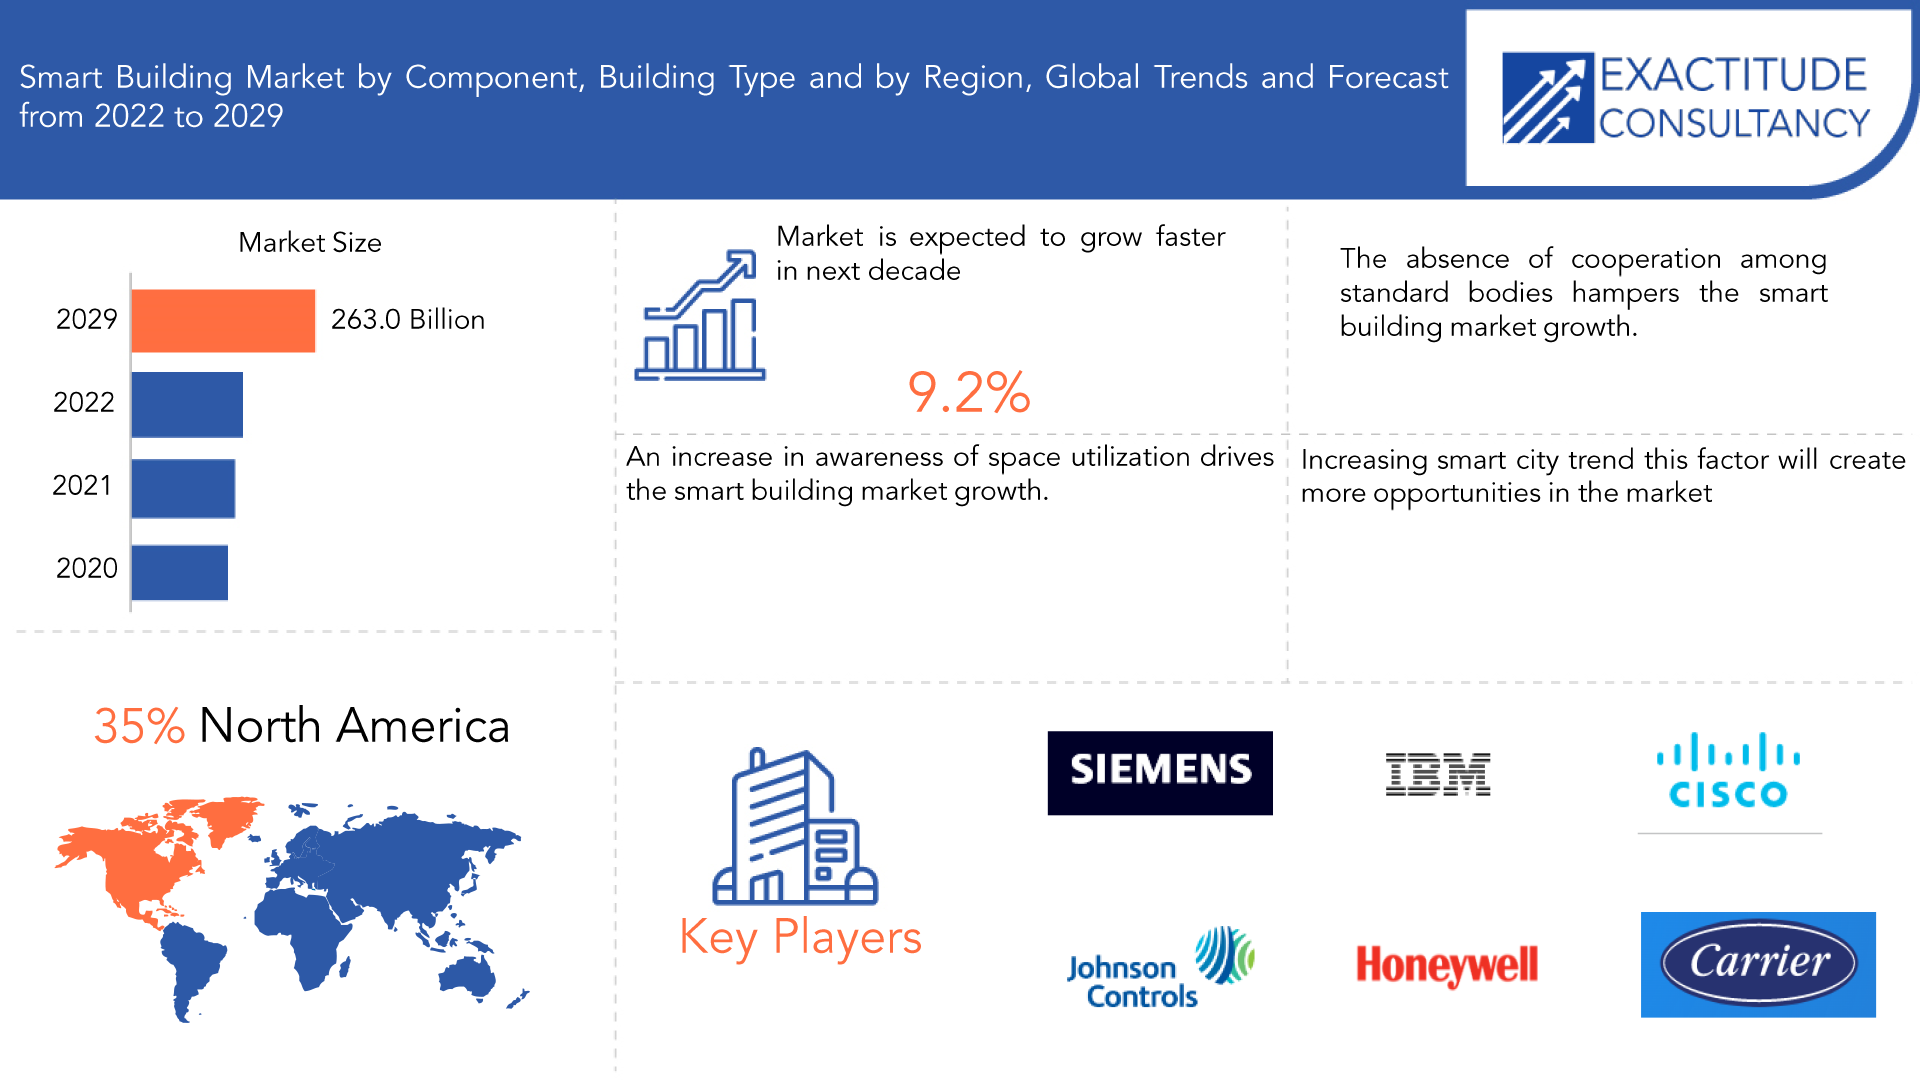
世界のスマートビルディング市場は、2020年から2029年にかけて9.2%のCAGRで成長すると予想されています。2020年の657億米ドルから2029年には2,630億米ドルを超えると予想されています。
スマートビルディングとは、建物をより効率的で快適かつ居住者にとって安全なものにするために、高度なテクノロジーと自動化システムを組み込んだ建物です。スマートビルディングは、センサー、データ分析、通信ネットワークを使用して、照明、暖房、換気、空調、セキュリティ、エネルギー管理などのさまざまな建物システムを監視および制御します。スマートビルディングは、センサーと分析を使用してエネルギー使用を最適化し、無駄を減らします。たとえば、占有レベル、時間帯、気象条件に基づいて照明と温度を調整できます。スマートビルディングは、自動化システムを使用して、照明、HVAC、セキュリティなどのさまざまな建物システムを制御および監視します。これにより、手動による介入が減り、効率が向上します。スマートビルディングはインターネットに接続されているため、建物システムをリアルタイムで監視およびリモート制御できます。これにより、より優れたデータ収集と分析も可能になります。スマート ビルディングには、緑の屋根、ソーラー パネル、雨水収集システムなど、持続可能な設計原則とテクノロジーが組み込まれていることがよくあります。スマート ビルディングは、高度なテクノロジーを使用して、居住者にとってより快適で生産性の高い環境を作り出します。たとえば、個人の好みに基づいて照明と温度を調整し、室内の空気の質に関するリアルタイムのフィードバックを提供できます。全体として、スマート ビルディングは、建物の効率、持続可能性、快適性を向上させると同時に、運用コストを削減し、建物全体のパフォーマンスを向上させるように設計されています。スマート ハウスは、居住者の快適性と安全性を高め、多くの家庭用機器のリモート管理、家のメンテナンス ルーチンの自動化、エネルギー消費の追跡、およびホーム セキュリティ システムの管理を可能にするために構築されています。スマート ビルディングの急速な導入は、大都市圏でのより良い建物 (および建物の敷地) の利用とリソース管理の改善に対する需要の高まりによって推進されています。さらに、公共の安全とセキュリティに対する要望が、スマート ビルディング市場の成長を促進しています。
| 属性 | 詳細 |
| 研究期間 | 2020-2029 |
| 基準年 | 2021 |
| 推定年 | 2022 |
| 予測年 | 2022-2029 |
| 歴史的時代 | 2018-2020 |
| ユニット | 価値(10億米ドル) |
| セグメンテーション | コンポーネント別、建物タイプ別、地域別 |
| コンポーネント別 |
|
| 建物タイプ別 |
|
| 地域別 |
|
スマート ビルディングは、高度なテクノロジーを使用して、エネルギー消費を最適化し、無駄を減らし、ユーティリティのコストを節約します。これは、運用コストを削減する方法を常に模索しているビルの所有者や施設管理者にとって特に魅力的です。スマート ビルディングは、再生可能エネルギー源、エネルギー効率の高い照明、高度な暖房、換気、空調 ( HVAC ) システムなどの機能を通じて、環境への影響を軽減するように設計されています。これは、持続可能性を促進し、二酸化炭素排出量を削減したい多くのビル所有者にとって重要な考慮事項です。スマート ビルディングは、居住者に優れた快適さと利便性を提供します。ユーザーの好み、占有パターン、その他の要因に基づいて、温度、照明、その他の機能を自動的に調整できます。これにより、ユーザー エクスペリエンスが向上し、生産性と満足度が向上します。多くの政府が、二酸化炭素排出量を削減し、持続可能な開発を促進するための規制を導入しています。スマート ビルディングは、ビルの所有者と施設管理者がこれらの規制を遵守し、罰金を回避するのに役立ちます。モノのインターネット ( IoT )、人工知能( AI )、クラウド コンピューティングなどの新しいテクノロジーの開発により、これまで以上に効率的でコスト効率が高く、ユーザー フレンドリーなスマート ビルディング システムを作成できるようになりました。これにより、スマート ビルディング ソリューションの需要が増加しました。これらは、スマート ビルディング市場の成長を促進する要因です。[caption id="attachment_21756" align="aligncenter" width="1920"]
Frequently Asked Questions
• What is the worth of global Smart Building market?
The global smart building market is expected to grow at 9.2 % CAGR from 2020 to 2029. It is expected to reach above USD 263.0 billion by 2029 from USD 65.7 billion in 2020.
• What is the size of the North America Smart Building Market?
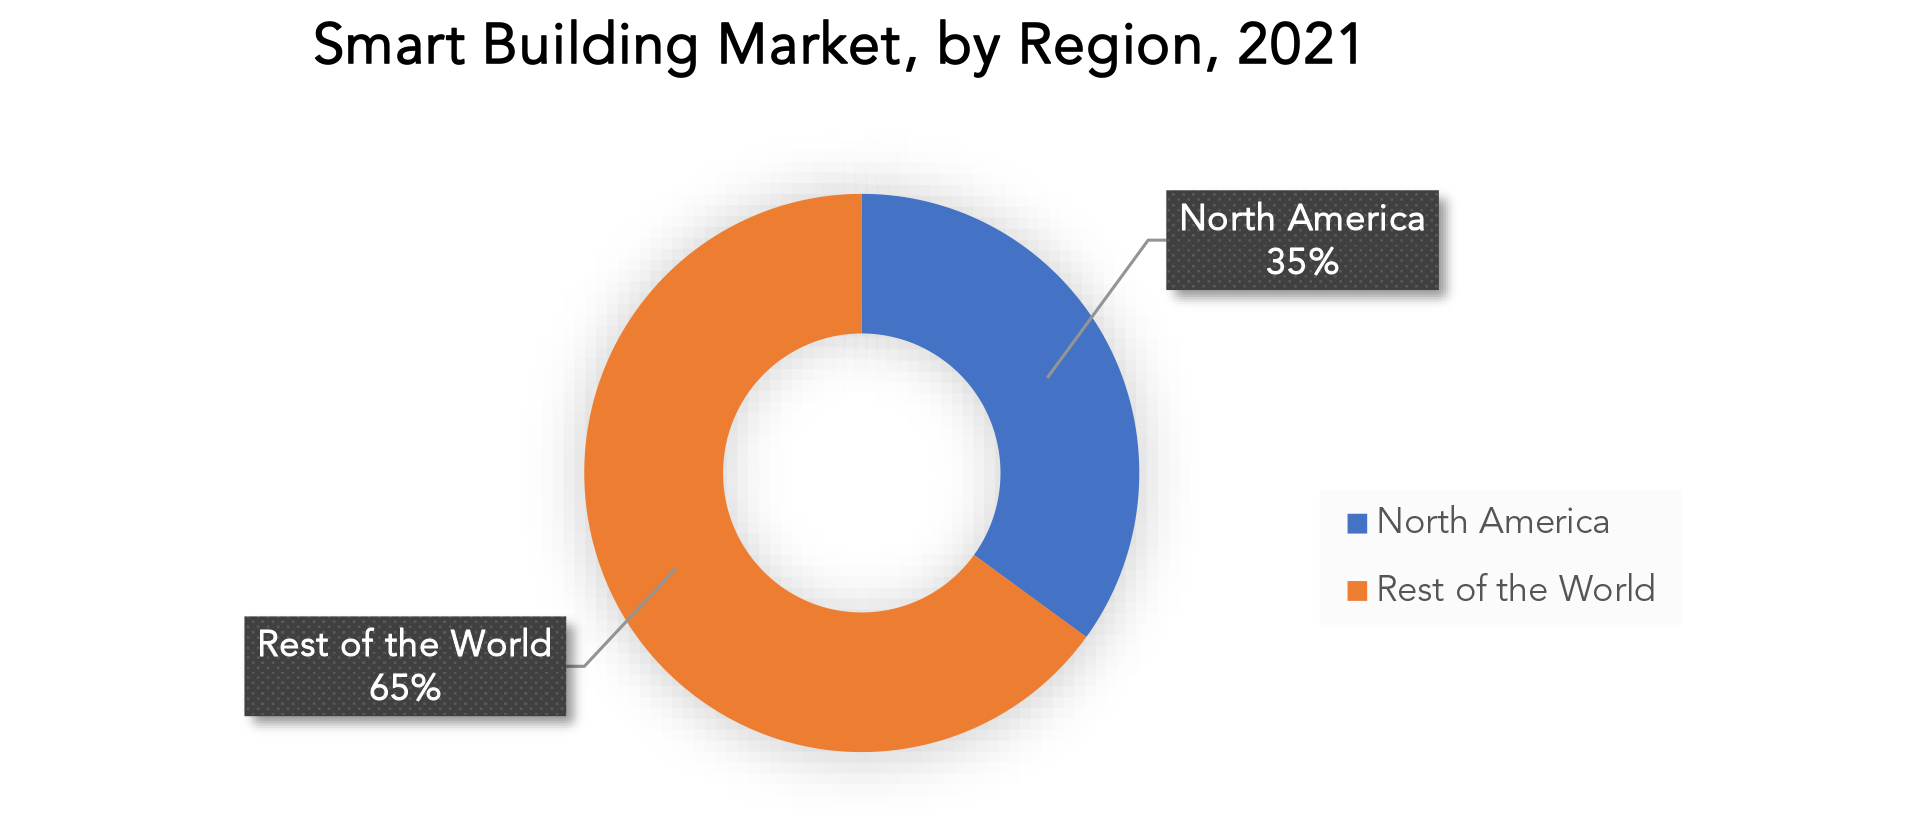
North America held more than 35% of the Smart Building market revenue share in 2021. North America has been at the forefront of technological advancements in the smart building industry. The region is home to many leading technology companies, which have developed advanced smart building solutions based on the Internet of Things (IoT), artificial intelligence (AI), and cloud computing.
• What are some of the market's driving forces?
Increase in adoption of IoT-enabled BMS, growing in awareness of space utilization, growth in industry standards and regulations drives the smart building market growth.
• Which are the top companies to hold the market share in Smart Building market?
The Smart Building market key players include Cisco, IBM, Honeywell, Siemens, Johnson Controls, Huawei, Intel, PTC, Abb, 10 Hitachi, Schneider Electric, Telit, Legrand, Bosch, KMC Controls, Verdigris Technologies, Aquicore, 75f, Buildingiq, Entouch, Gaia, Softdel, Coppertree Analytics, Spaceti, Igor, Efacility, Spacewell.
• What are the opportunities in the smart building market?
Development of the 5G technology, increase in the smart city trend, Government initiatives and incentives this factor creates more opportunities in the smart building market.
Smart Building Market Segment Analysis
The global Smart Building market is segmented based on component building type and region. By component, the services segment is dominating the market. Smart building systems involve complex technologies such as IoT, AI, and cloud computing. Building owners and facility managers may lack the expertise required to design, install, and maintain these systems. Service providers with specialized knowledge and experience are therefore needed to help them implement and manage smart building solutions. Smart building solutions must be customized to meet the specific needs of each building and its occupants. Service providers can offer tailor-made solutions based on factors such as building size, occupancy patterns, and energy usage. This ensures that the smart building system is optimized for maximum efficiency and cost savings. Smart building systems require ongoing maintenance and support to ensure optimal performance. Service providers can offer regular maintenance, upgrades, and troubleshooting services to ensure that the system runs smoothly and any issues are quickly resolved. Service providers can offer a range of services such as consulting, design, installation, and maintenance, which can generate recurring revenue streams. This business model is attractive to investors and can provide a steady stream of income over the life of the smart building system. Building owners and facility managers are looking for competitive advantages in terms of energy efficiency, sustainability, and user experience. Smart building systems can provide these advantages, and service providers are well-positioned to offer the expertise and support required to implement them. Based on building type commercial building segment is dominating in the smart building market. Commercial buildings consume a significant amount of energy, and building owners and facility managers are looking for ways to reduce energy usage and lower operating costs. Smart building solutions can optimize energy usage by automatically adjusting lighting, heating, ventilation, and air conditioning based on occupancy patterns and user preferences. Many commercial building owners and facility managers are committed to reducing their environmental impact and promoting sustainability. Smart building solutions can help achieve these goals by incorporating renewable energy sources, improving indoor air quality, and reducing carbon emissions. Smart building solutions can help reduce operational costs by optimizing energy usage, automating processes, and reducing maintenance costs. This is particularly attractive to commercial building owners and facility managers who are looking for ways to maximize profitability. Commercial buildings are designed to attract and retain tenants, and smart building solutions can enhance the user experience by providing features such as automated lighting, temperature control, and security systems. Many governments are introducing regulations to reduce carbon emissions and promote sustainable development. Smart building solutions can help building owners and facility managers comply with these regulations and avoid penalties. [caption id="attachment_21760" align="aligncenter" width="1920"]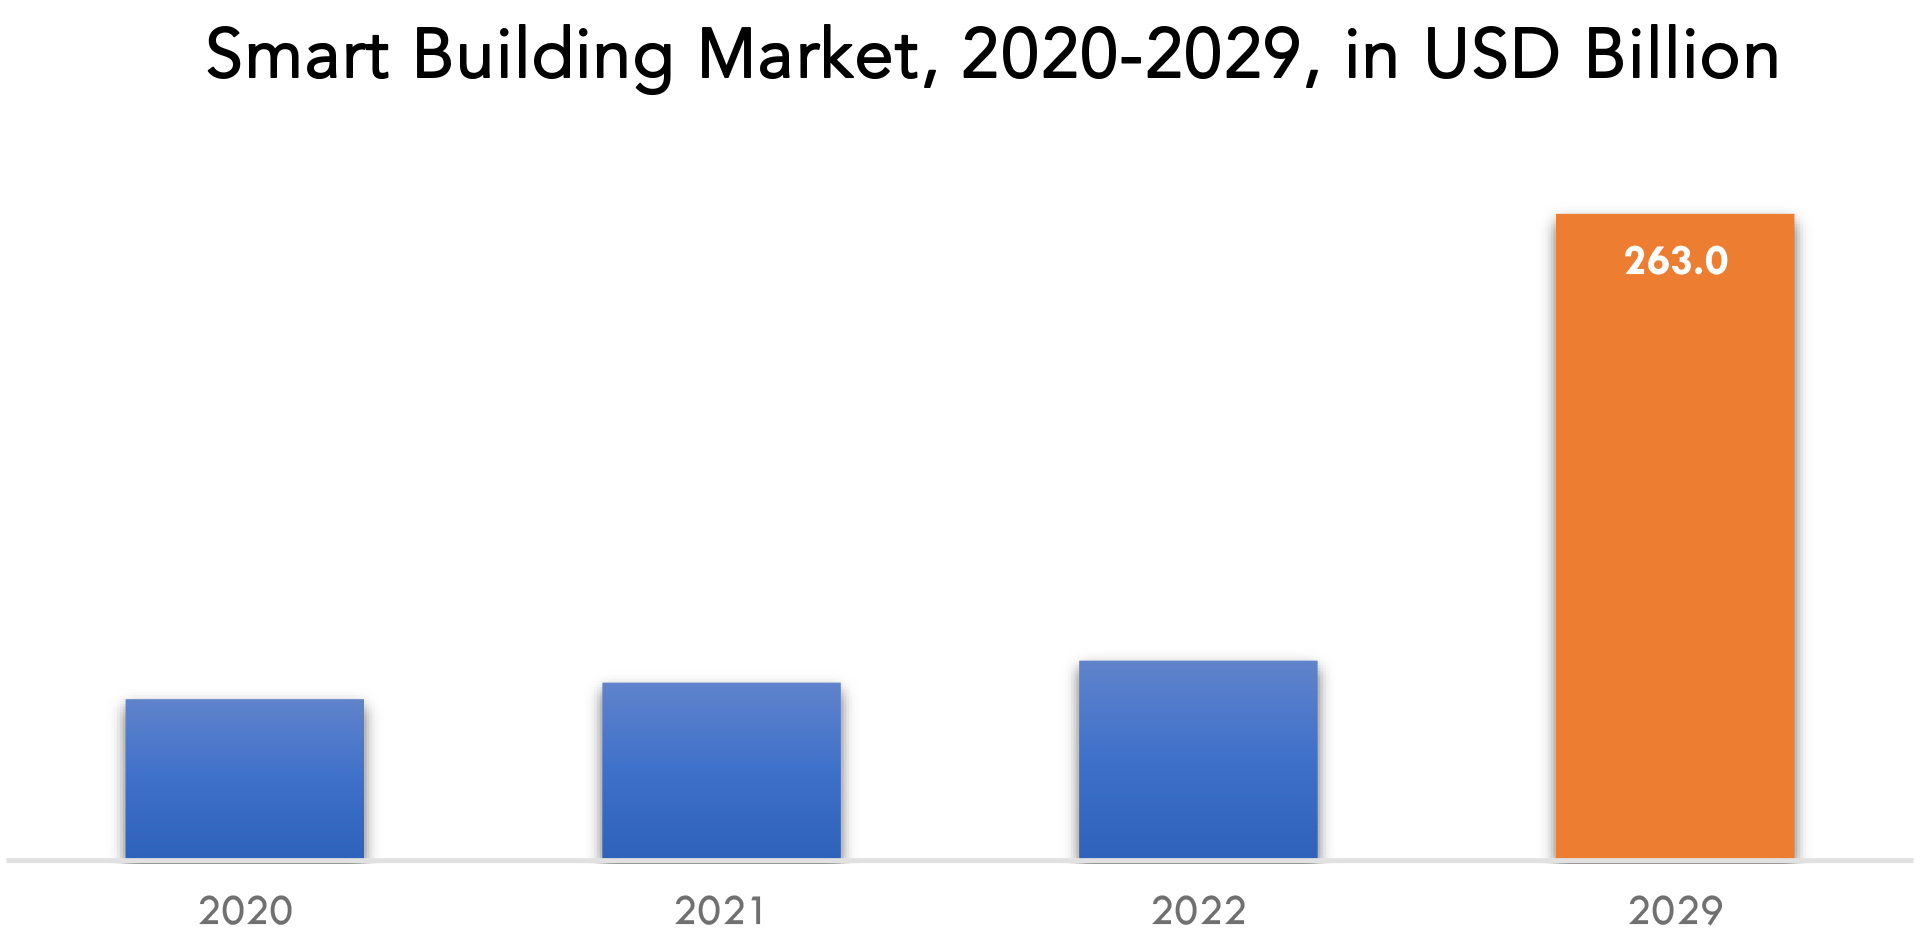
Smart Building Market Key Players
The Smart Building market key players include Cisco, IBM, Honeywell, Siemens, Johnson Controls, Huawei, Intel, PTC, Abb, 10 Hitachi, Schneider Electric, Telit, Legrand, Bosch, KMC Controls, Verdigris Technologies, Aquicore, 75f, Buildingiq, Entouch, Gaia, Softdel, Coppertree Analytics, Spaceti, Igor, Efacility, Spacewell. Industry News: 11th August 2022 - Johnson Controls and Microsoft Beijing Campus worked together to continuously renovate the building and optimize operations in August 2022, resulting in energy savings of 27.9% and a 98% uptime guarantee for essential equipment. In February 2022, Legrand and URC, a reputable provider of smart home automation and control systems, joined partners to expand Smart Home Control. Through this arrangement, the companies work together to provide seamless control of Legrand's Vantage lighting and temperature solutions.Who Should Buy? Or Key stakeholders
- Smart Building Supplier
- Raw Materials Manufacturers
- Research Organizations
- Investors
- Regulatory Authorities
- Others
Smart Building Market Regional Analysis
The smart building market by region includes North America, Asia-Pacific (APAC), Europe, South America, and Middle East & Africa (MEA).- North America: includes the US, Canada, Mexico
- Asia Pacific: includes China, Japan, South Korea, India, Australia, ASEAN and Rest of APAC
- Europe: includes UK, Germany, France, Italy, Spain, Russia, and Rest of Europe
- South America: includes Brazil, Argentina and Rest of South America
- Middle East & Africa: includes Turkey, UAE, Saudi Arabia, South Africa, and Rest of MEA
Key Market Segments: Smart Building Market
Smart Building Market by Component, 2020-2029, (USD Billion)- Solution
- Services
- Residential
- Commercial
- Industrial
- North America
- Asia Pacific
- Europe
- South America
- Middle East and Africa
Key Question Answered
- What is the current size of the smart building positioning market?
- What is the expected growth rate of the smart building positioning market over the next 5 years?
- Who are the major players in the automotive high precision positioning market and what is their market share?
- What are the end-user industries driving demand for the market and what is their outlook?
- What are the opportunities for growth in emerging markets such as the Asia-pacific, the middle east, and Africa?
- How is the economic environment affecting the automotive high precision positioning market, including factors such as interest rates, inflation, and exchange rates?
- What is the expected impact of government policies and regulations on the smart building positioning market?
- What is the current and forecasted size and growth rate of the global smart building positioning market?
- What are the key drivers of growth in the smart building positioning market?
- Who are the major players in the market and what is their market share?
- What are the distribution channels and supply chain dynamics in the smart building positioning market?
- What are the technological advancements and innovations in the smart building positioning market and their impact on product development and growth?
- What are the regulatory considerations and their impact on the market?
- What are the challenges faced by players in the smart building positioning market and how are they addressing these challenges?
- What are the opportunities for growth and expansion in the smart building positioning market?
- What are the service offerings specifications of leading players in the market?
- What is the pricing trend of smart building positioning in the market?
- 導入
- 市場の定義
- 市場セグメンテーション
- 研究タイムライン
- 前提と制限
- 研究方法
- データマイニング
- 二次調査
- 一次研究
- 専門家のアドバイス
- 品質チェック
- 最終レビュー
- データ三角測量
- ボトムアップアプローチ
- トップダウンアプローチ
- 研究の流れ
- データソース
- データマイニング
- エグゼクティブサマリー
- 市場概要
- 世界のスマートビルディング市場の展望
- 市場の推進要因
- 市場の制約
- 市場機会
- COVID-19がスマートビルディング市場に与える影響
- ポーターの5つの力モデル
- 新規参入からの脅威
- 代替選手からの脅威
- サプライヤーの交渉力
- 顧客の交渉力
- 競争の度合い
- 業界バリューチェーン分析
- 世界のスマートビルディング市場の展望
- 世界のスマートビルディング市場(コンポーネント別)、2020~2029年(10億米ドル)
- 解決
- サービス
- 世界のスマートビルディング市場(建物タイプ別)、2020年~2029年(10億米ドル)
- 居住の
- コマーシャル
- 工業用
- 2020年~2029年の世界スマートビルディング市場(地域別、10億米ドル)
- 北米
- 私たち
- カナダ
- メキシコ
- 南アメリカ
- ブラジル
- アルゼンチン
- コロンビア
- 南米のその他の地域
- ヨーロッパ
- ドイツ
- 英国
- フランス
- イタリア
- スペイン
- ロシア
- その他のヨーロッパ
- アジア太平洋
- インド
- CHINA
- JAPAN
- SOUTH KOREA
- AUSTRALIA
- SOUTH-EAST ASIA
- REST OF ASIA PACIFIC
- MIDDLE EAST AND AFRICA
- UAE
- SAUDI ARABIA
- SOUTH AFRICA
- REST OF MIDDLE EAST AND AFRICA
- 北米
- COMPANY PROFILES*
(BUSINESS OVERVIEW, COMPANY SNAPSHOT, PRODUCTS OFFERED, RECENT DEVELOPMENTS)
8.1. CISCO
8.2. IBM
8.3. HONEYWELL
8.4. SIEMENS
8.5. JOHNSON CONTROLS
8.6. HUAWEI
8.7. INTEL
8.8. PTC
8.9. ABB
8.10. HITACHI
LIST OF TABLES
TABLE 1 GLOBAL SMART BUILDING MARKET BY TYPE (USD BILLION) 2020-2029
TABLE 2 GLOBAL SMART BUILDING MARKET BY COMPONENT (USD BILLION) 2020-2029
TABLE 3 GLOBAL SMART BUILDING MARKET BY BUILDING TYPE (USD BILLION) 2020-2029
TABLE 4 GLOBAL SMART BUILDING MARKET BY REGION (USD BILLION) 2020-2029
TABLE 5 NORTH AMERICA SMART BUILDING MARKET BY COUNTRY (USD BILLION) 2020-2029
TABLE 6 NORTH AMERICA SMART BUILDING MARKET BY COMPONENT (USD BILLION) 2020-2029
TABLE 7 NORTH AMERICA SMART BUILDING MARKET BY BUILDING TYPE (USD BILLION) 2020-2029
TABLE 8 US SMART BUILDING MARKET BY COMPONENT (USD BILLION) 2020-2029
TABLE 9 US SMART BUILDING MARKET BY BUILDING TYPE (USD BILLION) 2020-2029
TABLE 10 CANADA SMART BUILDING MARKET BY COMPONENT (USD BILLION) 2020-2029
TABLE 11 CANADA SMART BUILDING MARKET BY BUILDING TYPE (USD BILLION) 2020-2029
TABLE 12 MEXICO SMART BUILDING MARKET BY COMPONENT (USD BILLION) 2020-2029
TABLE 13 MEXICO SMART BUILDING MARKET BY BUILDING TYPE (USD BILLION) 2020-2029
TABLE 14 SOUTH AMERICA SMART BUILDING MARKET BY COUNTRY (USD BILLION) 2020-2029
TABLE 15 SOUTH AMERICA SMART BUILDING MARKET BY COMPONENT (USD BILLION) 2020-2029
TABLE 16 SOUTH AMERICA SMART BUILDING MARKET BY BUILDING TYPE (USD BILLION) 2020-2029
TABLE 17 BRAZIL SMART BUILDING MARKET BY COMPONENT (USD BILLION) 2020-2029
TABLE 18 BRAZIL SMART BUILDING MARKET BY BUILDING TYPE (USD BILLION) 2020-2029
TABLE 19 ARGENTINA SMART BUILDING MARKET BY COMPONENT (USD BILLION) 2020-2029
TABLE 20 ARGENTINA SMART BUILDING MARKET BY BUILDING TYPE (USD BILLION) 2020-2029
TABLE 21 COLOMBIA SMART BUILDING MARKET BY COMPONENT (USD BILLION) 2020-2029
TABLE 22 COLOMBIA SMART BUILDING MARKET BY BUILDING TYPE (USD BILLION) 2020-2029
TABLE 23 REST OF THE SOUTH AMERICA SMART BUILDING MARKET BY COMPONENT (USD BILLION) 2020-2029
TABLE 24 REST OF THE SOUTH AMERICA SMART BUILDING MARKET BY BUILDING TYPE (USD BILLION) 2020-2029
TABLE 25 ASIA-PACIFIC SMART BUILDING MARKET BY COUNTRY (USD BILLION) 2020-2029
TABLE 26 ASIA-PACIFIC SMART BUILDING MARKET BY COMPONENT (USD BILLION) 2020-2029
TABLE 27 ASIA-PACIFIC SMART BUILDING MARKET BY BUILDING TYPE (USD BILLION) 2020-2029
TABLE 28 INDIA SMART BUILDING MARKET BY COMPONENT (USD BILLION) 2020-2029
TABLE 29 INDIA SMART BUILDING MARKET BY BUILDING TYPE (USD BILLION) 2020-2029
TABLE 30 CHINA SMART BUILDING MARKET BY COMPONENT (USD BILLION) 2020-2029
TABLE 31 CHINA SMART BUILDING MARKET BY BUILDING TYPE (USD BILLION) 2020-2029
TABLE 32 JAPAN SMART BUILDING MARKET BY COMPONENT (USD BILLION) 2020-2029
TABLE 33 JAPAN SMART BUILDING MARKET BY BUILDING TYPE (USD BILLION) 2020-2029
TABLE 34 SOUTH KOREA SMART BUILDING MARKET BY COMPONENT (USD BILLION) 2020-2029
TABLE 35 SOUTH KOREA SMART BUILDING MARKET BY BUILDING TYPE (USD BILLION) 2020-2029
TABLE 36 AUSTRALIA SMART BUILDING MARKET BY COMPONENT (USD BILLION) 2020-2029
TABLE 37 AUSTRALIA SMART BUILDING MARKET BY BUILDING TYPE (USD BILLION) 2020-2029
TABLE 38 SOUTH-EAST ASIA SMART BUILDING MARKET BY COMPONENT (USD BILLION) 2020-2029
TABLE 39 SOUTH-EAST ASIA SMART BUILDING MARKET BY BUILDING TYPE (USD BILLION) 2020-2029
TABLE 40 REST OF ASIA PACIFIC SMART BUILDING MARKET BY COMPONENT (USD BILLION) 2020-2029
TABLE 41 REST OF ASIA PACIFIC SMART BUILDING MARKET BY BUILDING TYPE (USD BILLION) 2020-2029
TABLE 42 EUROPE SMART BUILDING MARKET BY COUNTRY (USD BILLION) 2020-2029
TABLE 43 EUROPE SMART BUILDING MARKET BY COMPONENT (USD BILLION) 2020-2029
TABLE 44 EUROPE SMART BUILDING MARKET BY BUILDING TYPE (USD BILLION) 2020-2029
TABLE 45 GERMANY SMART BUILDING MARKET BY COMPONENT (USD BILLION) 2020-2029
TABLE 46 GERMANY SMART BUILDING MARKET BY BUILDING TYPE (USD BILLION) 2020-2029
TABLE 47 UK SMART BUILDING MARKET BY COMPONENT (USD BILLION) 2020-2029
TABLE 48 UK SMART BUILDING MARKET BY BUILDING TYPE (USD BILLION) 2020-2029
TABLE 49 FRANCE SMART BUILDING MARKET BY COMPONENT (USD BILLION) 2020-2029
TABLE 50 FRANCE SMART BUILDING MARKET BY BUILDING TYPE (USD BILLION) 2020-2029
TABLE 51 ITALY SMART BUILDING MARKET BY COMPONENT (USD BILLION) 2020-2029
TABLE 52 ITALY SMART BUILDING MARKET BY BUILDING TYPE (USD BILLION) 2020-2029
TABLE 53 SPAIN SMART BUILDING MARKET BY COMPONENT (USD BILLION) 2020-2029
TABLE 54 SPAIN SMART BUILDING MARKET BY BUILDING TYPE (USD BILLION) 2020-2029
TABLE 55 RUSSIA SMART BUILDING MARKET BY COMPONENT (USD BILLION) 2020-2029
TABLE 56 RUSSIA SMART BUILDING MARKET BY BUILDING TYPE (USD BILLION) 2020-2029
TABLE 57 REST OF EUROPE SMART BUILDING MARKET BY COMPONENT (USD BILLION) 2020-2029
TABLE 58 REST OF EUROPE SMART BUILDING MARKET BY BUILDING TYPE (USD BILLION) 2020-2029
TABLE 59 MIDDLE EAST AND AFRICA SMART BUILDING MARKET BY COUNTRY (USD BILLION) 2020-2029
TABLE 60 MIDDLE EAST AND AFRICA SMART BUILDING MARKET BY COMPONENT (USD BILLION) 2020-2029
TABLE 61 MIDDLE EAST AND AFRICA SMART BUILDING MARKET BY BUILDING TYPE (USD BILLION) 2020-2029
TABLE 62 UAE SMART BUILDING MARKET BY COMPONENT (USD BILLION) 2020-2029
TABLE 63 UAE SMART BUILDING MARKET BY BUILDING TYPE (USD BILLION) 2020-2029
TABLE 64 SAUDI ARABIA SMART BUILDING MARKET BY COMPONENT (USD BILLION) 2020-2029
TABLE 65 SAUDI ARABIA SMART BUILDING MARKET BY BUILDING TYPE (USD BILLION) 2020-2029
TABLE 66 SOUTH AFRICA SMART BUILDING MARKET BY COMPONENT (USD BILLION) 2020-2029
TABLE 67 SOUTH AFRICA SMART BUILDING MARKET BY BUILDING TYPE (USD BILLION) 2020-2029
TABLE 68 REST OF THE MIDDLE EAST AND AFRICA SMART BUILDING MARKET BY COMPONENT (USD BILLION) 2020-2029
TABLE 69 REST OF THE MIDDLE EAST AND AFRICA SMART BUILDING MARKET BY BUILDING TYPE (USD BILLION) 2020-2029
LIST OF FIGURES
FIGURE 1 MARKET DYNAMICS
FIGURE 2 MARKET SEGMENTATION
FIGURE 3 REPORT TIMELINES: YEARS CONSIDERED
FIGURE 4 DATA TRIANGULATION
FIGURE 5 BOTTOM-UP APPROACH
FIGURE 6 TOP-DOWN APPROACH
FIGURE 7 RESEARCH FLOW
FIGURE 8 GLOBAL SMART BUILDING MARKET BY COMPONENT, USD BILLION, 2020-2029
FIGURE 9 GLOBAL SMART BUILDING MARKET BY BUILDING TYPE, USD BILLION, 2020-2029
FIGURE 10 GLOBAL SMART BUILDING MARKET BY REGION, USD BILLION, 2020-2029
FIGURE 11 PORTER’S FIVE FORCES MODEL
FIGURE 12 GLOBAL SMART BUILDING MARKET BY COMPONENT, USD BILLION, 20201
FIGURE 13 GLOBAL SMART BUILDING MARKET BY BUILDING TYPE, USD BILLION, 2021
FIGURE 14 GLOBAL SMART BUILDING MARKET BY REGION, USD BILLION, 2021
FIGURE 15 NORTH AMERICA SMART BUILDING MARKET SNAPSHOT
FIGURE 16 EUROPE SMART BUILDING MARKET SNAPSHOT
FIGURE 17 SOUTH AMERICA SMART BUILDING MARKET SNAPSHOT
FIGURE 18 ASIA PACIFIC SMART BUILDING MARKET SNAPSHOT
FIGURE 19 MIDDLE EAST ASIA AND AFRICA SMART BUILDING MARKET SNAPSHOT
FIGURE 20 MARKET SHARE ANALYSIS
FIGURE 21 CARRIER: COMPANY SNAPSHOT
FIGURE 22 CISCO: COMPANY SNAPSHOT
FIGURE 23 IBM: COMPANY SNAPSHOT
FIGURE 24 HONEYWELL: COMPANY SNAPSHOT
FIGURE 25 SIEMENS: COMPANY SNAPSHOT
FIGURE 26 JOHNSON CONTROLS: COMPANY SNAPSHOT
FIGURE 27 HUAWEI: COMPANY SNAPSHOT
FIGURE 28 INTEL: COMPANY SNAPSHOT
FIGURE 29 PTC: COMPANY SNAPSHOT
FIGURE 30 ABB: COMPANY SNAPSHOT
DOWNLOAD FREE SAMPLE REPORT
License Type
SPEAK WITH OUR ANALYST
Want to know more about the report or any specific requirement?
WANT TO CUSTOMIZE THE REPORT?
Our Clients Speak
We asked them to research ‘ Equipment market’ all over the world, and their whole arrangement was helpful to us. thehealthanalytics.com insightful analysis and reports contributed to our current analysis and in creating a future strategy. Besides, the te
Yosuke Mitsui
Senior Associate Construction Equipment Sales & Marketing
We asked them to research ‘Equipment market’ all over the world, and their whole arrangement was helpful to us. thehealthanalytics.com insightful analysis and reports contributed to our current analysis and in creating a future strategy. Besides, the te


