

Base Year Value ()
x.x %
x.x %
CAGR ()
x.x %
x.x %
Forecast Year Value ()
x.x %
x.x %
Historical Data Period
Largest Region
Forecast Period
3Dプリントサービスビューロー市場:サービス別(プラスチック3Dプリントサービス、金属3Dプリントサービス、樹脂3Dプリントサービス、その他)、アプリケーション別(LED 3Dプリントサービスビューロー、放送ビデオ通信、リアルタイムビデオ通信、ビデオコンテンツ管理、その他)、技術別(熱溶解積層法(FDM)、直接金属レーザー焼結法(DMLS)、レーザー焼結法(LS)、マルチジェットフュージョン(MJF)、バインダージェッティング、光造形法(SL))および地域別、2023年から2030年までの世界的動向と予測
Instant access to hundreds of data points and trends
- Market estimates from 2014-2029
- Competitive analysis, industry segmentation, financial benchmarks
- Incorporates SWOT, Porter's Five Forces and risk management frameworks
- PDF report or online database with Word, Excel and PowerPoint export options
- 100% money back guarantee
3Dプリントサービスビューロー市場概要
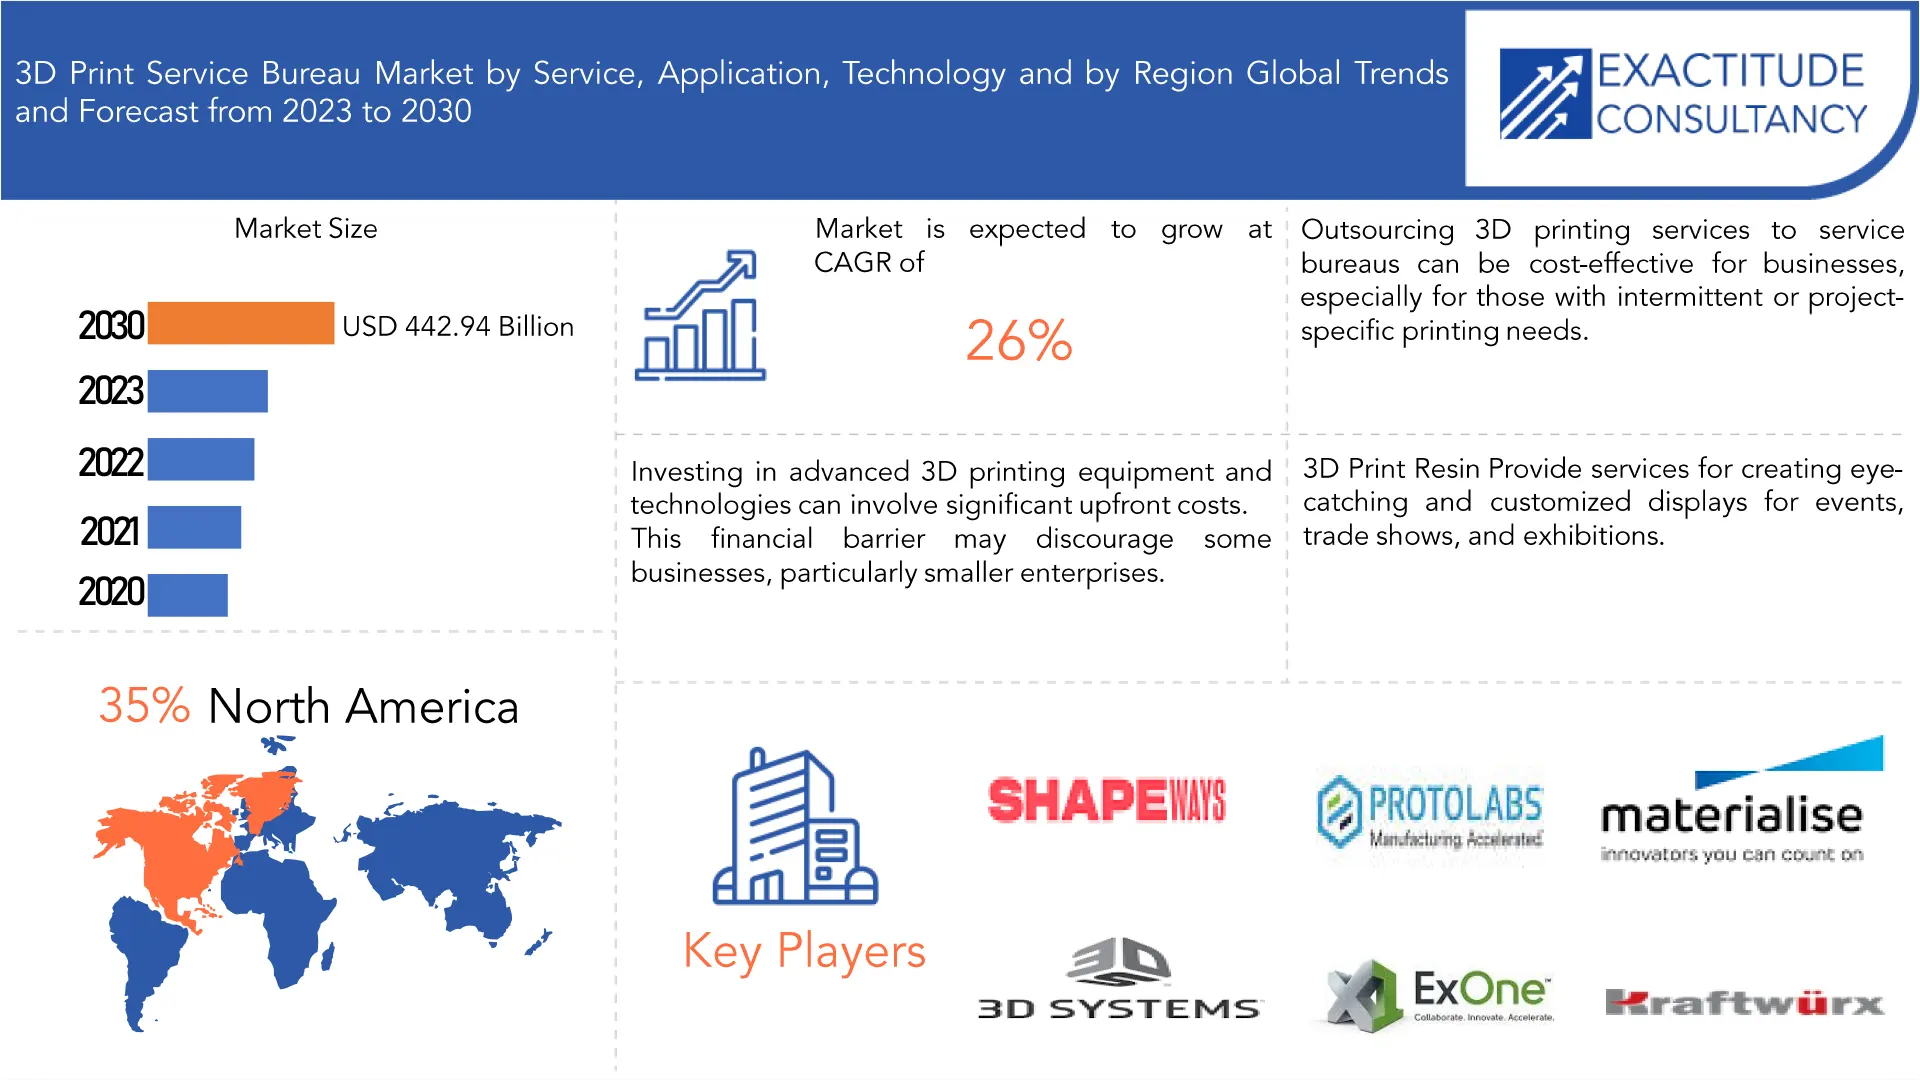
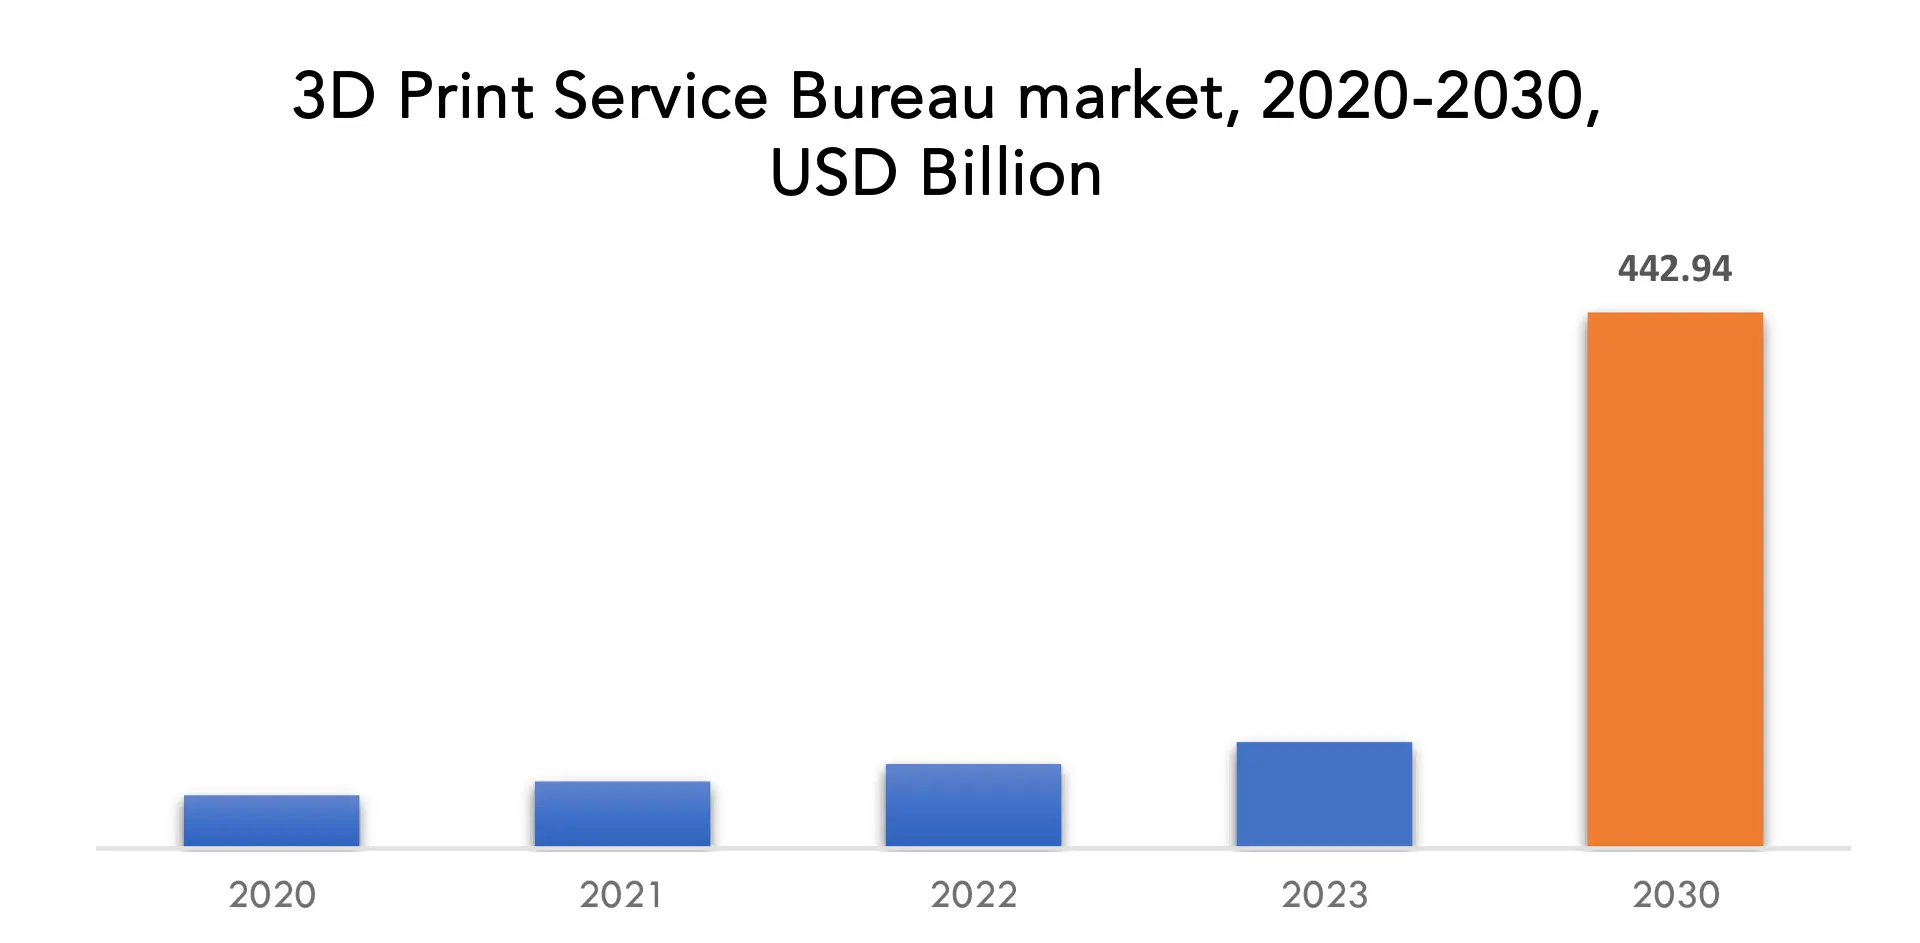
世界の 3D プリント サービス ビューロー市場は、予測期間中に 26 % の CAGR で成長し、2023 年の 878.6 億米ドルから 2030 年までに 4,429.4 億米ドルに達すると予想されています。
「3Dプリント サービス ビューロー市場」という用語は、企業またはサービス プロバイダーが外部クライアントに 3D プリント サービスの料金を請求する、積層造形業界のニッチを表します。企業や人々が、機器、材料、経験に多額の先行投資をすることなく最先端の 3D プリント技術を利用できるようにすることで、これらのサービス ビューローは、より大きなエコシステムで重要な役割を果たします。これらのサービス ビューローは、基本的に、アウトソーシングされた製造のパートナーとして機能し、インフラストラクチャと知識を活用して、さまざまな 3D プリントの要件を満たします。3D プリント サービス ビューローの市場では、顧客はデジタルファイルまたは設計仕様を提供でき、サービス プロバイダーは、材料の選択やプリントの設定から実際の有形製品の製造まで、3D プリント プロセスのすべてのステップを処理します。この戦略は、スタートアップ企業、中小規模の組織、および特殊なまたは断続的な 3D 印刷ニーズを持つ企業にとって特に魅力的です。なぜなら、企業は社内設備を維持することなく 3D 印刷技術を活用できるからです。単純な 3D 印刷を超えて、3D 印刷サービス ビューローは幅広いサービスを提供します。多くのビューローが提供する追加の付加価値サービスには、設計の最適化、後処理 (塗装や仕上げなど)、配送、フルフィルメントなどがあります。この包括的な戦略は、生産、試作、またはカスタム製造の要件を円滑かつ効果的に処理する方法を求めている顧客に役立ちます。新しいテクノロジーにより、幅広い材料、より優れた印刷解像度、および消費者製品、ヘルスケア、自動車、航空宇宙などの業界にわたるアプリケーションの増加が可能になり、3D 印刷サービス ビューロー業界はダイナミックで常に変化しています。[caption id="attachment_32027" align="aligncenter" width="1920"]
| 属性 | 詳細 |
| 研究期間 | 2020-2030 |
| 基準年 | 2022 |
| 推定年 | 2023 |
| 予測年 | 2023-2030 |
| 歴史的時代 | 2019-2021 |
| ユニット | 金額(10億米ドル) 数量(千個) |
| セグメンテーション | サービス、アプリケーション、テクノロジー、地域別 |
| サービス別 |
|
| アプリケーション別 |
|
| テクノロジー別 |
|
| 地域別 |
|
Frequently Asked Questions
What is the market size for the 3D Print Service Bureau market?
The global 3D Print Service Bureau market is anticipated to grow from USD 87.86 Billion in 2023 to USD 442.94 Billion by 2030, at a CAGR of 26 % during the forecast period
Which region is dominating in the 3D Print Service Bureau market?
North America accounted for the largest market in the 3D Print Service Bureau market. North America accounted for 35 % market share of the global market value.
Who are the major key players in the 3D Print Service Bureau market?
Protolabs, Materialise NV, Stratasys Direct Manufacturing, Sculpteo, i.materialise, 3D Systems, Xometry, ExOne, Forecast 3D, Voodoo Manufacturing, Hubs
What are the key trends in the 3D Print Service Bureau market?
Businesses needing low-volume production runs were finding service bureaus to be useful partners. This tendency was noteworthy in sectors of the economy where tiny quantities produced using conventional production techniques would be too expensive. With the advent of cutting-edge materials for 3D printing, service providers are now able to provide improved qualities such greater biocompatibility, strength, and flexibility. Numerous industries saw an increase in applications as a result of this trend. Automation, the Internet of Things, and digital connectivity are examples of Industry 4.0 technology that many service bureaus have been implementing to improve manufacturing process efficiency. The goal of this integration was to increase overall operational effectiveness by optimizing workflows.
3D Print Service Bureau market Dynamics
Driver 3D print service bureaus offer rapid prototyping services, allowing businesses to quickly iterate and refine designs which drives 3D Print Service Bureau market. Businesses can swiftly produce physical prototypes based on digital ideas by using fast prototyping services. This allows for several design cycles in shorter amounts of time by enabling rapid iteration and refining of product designs. Cutting the time it takes for new products to reach the market is directly impacted by the capacity to prototype and iterate concepts quickly. Companies can gain a competitive edge and promptly respond to changing customer needs by bringing innovative products to market faster. Businesses can test and confirm designs through rapid prototyping before committing to large-scale production. This helps prevent expensive changes in later phases of development by identifying design defects, functional concerns, or places for improvement early in the process. The tangible models that physical prototypes offer improve stakeholder, engineering, and design team collaboration. Businesses that use rapid prototyping are more likely to foster an innovative culture. Engineers and designers are free to experiment with original and creative ideas since they know how rapidly they can turn concepts into working prototypes for testing and assessment. Companies can build individualized and customized items by using rapid prototyping. This is especially important in fields like healthcare, where highly precise designs, prototypes, and production processes can be used to create medical devices or implants tailored to the needs of individual patients. Early in the design phase, rapid prototyping aids in identifying possible manufacturing process issues. This makes it possible for designers to maximize their designs for manufacturing, which lowers the possibility of production problems and guarantees economical manufacture. Iterative testing is made easier by rapid prototyping, which enables companies to get input from stakeholders or end users at different phases of development.Restraint
Service bureaus using a particular printing technology may face constraints in offering a wide range of material options. Liquid photopolymer resins are used in SLA, and they cure when exposed to UV light. SLA is flexible, but in comparison to other technologies, its material selection could be a little more constrained. Several photopolymer resins are materials that are frequently used with SLA; these resins can be specifically designed for uses like casting, prototyping, or dental models. SLS sinters powdered materials, usually metals or polymers, using a laser. With a range of materials, such as nylon, thermoplastic elastomers, and even some metals, SLS is renowned for its adaptability. Comparing the material alternatives to other technologies such as multi-jet fusion or conventional production techniques, however, might still be more restrictive. MJF is a powder-based method that selectively fused portions of a powdered bed using agents and a heating element. This method is frequently linked to materials with strong mechanical qualities based on nylon. When compared to conventional production techniques, the selection of materials could be more constrained. DMLS sinters metal particles layer by layer using a laser. It works effectively for creating extremely precise metal components. Different metal alloys are usually available as material possibilities, albeit the selection may be more constrained than with conventional metalworking techniques. In order to bind the particles together specifically, binder jetting entails spraying a liquid binder onto a powder bed.Opportunities
3D Print Service Bureau Offer rapid prototyping services to product designers and engineers looking to iterate and test their designs quickly which creates new avenues for 3D Print Service Bureau market. To assure precise and high-quality prototypes, we use state-of-the-art 3D printing technologies, such as Stereo lithography (SLA), Selective Laser Sintering (SLS), or Fused Deposition Modeling (FDM). Select from a large selection of materials, including as ABS, PLA, PETG, nylon, metals, resins, and more, that are appropriate for a variety of uses. Our choice of materials guarantees that your prototypes will satisfy particular functional and visual specifications. Our quick turnaround times are a feature of our rapid prototyping services, which let you test and iterate on your designs quickly. Quicken the process of developing new products without sacrificing quality. Customize your prototypes with a range of features, including as surface textures, material finishes, and color selections. We are aware of how crucial tactile and visual accuracy are to the prototyping process. Send us your 3D design files using our easy-to-use web platform in common formats (STL, OBJ, etc.). If necessary, our staff can provide help with filing preparation. Based on the specifications for your project, select the right material for your prototype. To help you choose, we offer thorough material specifications and suggestions. Your prototypes will be expertly produced by our state-of-the-art 3D printers. To guarantee precision and conformity to requirements, every prototype is put through stringent quality assurance inspections. With our extra finishing services, which include painting, surface treatments, and post-processing, you can improve the prototypes' visual attractiveness.3D Print Service Bureau Market Trends
- The technology, materials, and post-processing services offered by 3D print service bureaus were expanding to become more diverse. The goal of this trend was to meet the various needs of customers from various industries.
- A growing number of service bureaus were customizing their offerings to meet the needs of particular sectors, including consumer products, healthcare, aerospace, and automotive. This required gaining knowledge of materials and applications unique to the sector.
- Rapid prototyping services have become more and more in demand, especially in sectors where time-to-market and rapid iterations are crucial. Service bureaus were essential in helping engineers and product designers throughout the prototyping stage.
- Businesses needing low-volume production runs were finding service bureaus to be useful partners. This tendency was noteworthy in sectors of the economy where tiny quantities produced using conventional production techniques would be too expensive.
- With the advent of cutting-edge materials for 3D printing, service providers are now able to provide improved qualities such greater biocompatibility, strength, and flexibility. Numerous industries saw an increase in applications as a result of this trend.
- Automation, the Internet of Things, and digital connectivity are examples of Industry 4.0 technology that many service bureaus have been implementing to improve manufacturing process efficiency. The goal of this integration was to increase overall operational effectiveness by optimizing workflows.
- In order to provide their clients broader services, service bureaus were growing their presence throughout the world by establishing alliances and networks. This tendency made a variety of marketplaces and skill sets more accessible.
- The trend toward personalization and customization persisted, with service bureaus providing solutions that are specifically catered to each client. This was especially important for the consumer products and healthcare industries.
- Service bureaus gave certification and quality assurance procedures more attention, particularly in sectors with strict regulatory requirements. Adherence to industry norms and accreditations emerged as a crucial point of differentiation.
Competitive Landscape
The competitive landscape of the 3D Print Service Bureau market was dynamic, with several prominent companies competing to provide innovative.- Shapeways
- Protolabs
- Materialise NV
- Stratasys Direct Manufacturing
- Sculpteo
- materialise
- 3D Systems
- Xometry
- ExOne
- Forecast 3D
- Voodoo Manufacturing
- Hubs
- Spectra3D Technologies
- FATHOM
- Fast Radius
- Jabil
- Star Rapid
- BigRep
- Kraftwurx
- PrintForm
Recent Developments:
October 23, 2023: 3D Systems (NYSE:DDD) announced Icon Technologies Limited, a thermoforming and rotational molding company based in Winkler, Manitoba (Canada), has purchased an EXT 1270 Titan Pellet 3D printer. The company is renowned for providing innovative custom thermoformed solutions to its OEM customers for a variety of industrial applications including recreational vehicles, building products, and HVAC systems. With the addition of the EXT 1270 Titan Pellet 3D printer to its manufacturing floor, Icon believes they will produce large thermoforming molds with dramatically increased speed and significantly lower costs. September 20, 2023: Binder jetting technology (BJT) stands apart from other additive manufacturing methods. Recognized by ASTM, BJT is the future of mass production for highly dense and functional precision parts, offering numerous significant advantages that conventional manufacturing methods can't deliver. Increasing number of foundries worldwide, also in India, have been integrating the simple binder jet 3D printing process into their mold and core productions. Watch this exclusive on-demand webinar to learn about the power of BJT, the multiple benefits your casting business can get from this groundbreaking technology, and examples of sand 3D printing applications from ExOne's sand 3D printing expert who is also a former foundryman, Aldo Randazzo, In this video, you'll also learn about the business model of digital casting in India from a local sand 3D printing expert, Sanjay K. Gupta of Global Axis India.Regional Analysis
North America accounted for the largest market in the 3D Print Service Bureau market. North America accounted for 35 % of the worldwide market value. North America's aerospace and defense industries have adopted 3D printing technology, which includes the use of specialty resins to create intricate and lightweight components. The requirement for improved performance and efficiency in military and aerospace systems is what is driving this trend. Companies in North America are actively developing new materials for resins used in 3D printing. In order to satisfy the various demands of industries, research and development efforts are concentrated on producing materials with increased strength, durability, and flexibility. In North America, there is fierce competition in the 3D print resin business, with both well-established companies and creative newcomers fighting for market dominance. Businesses frequently set themselves apart with their content offerings, technological compatibility, and customer service. Sustainability is becoming more and more important in manufacturing processes, especially 3D printing. [caption id="attachment_32042" align="aligncenter" width="1920"]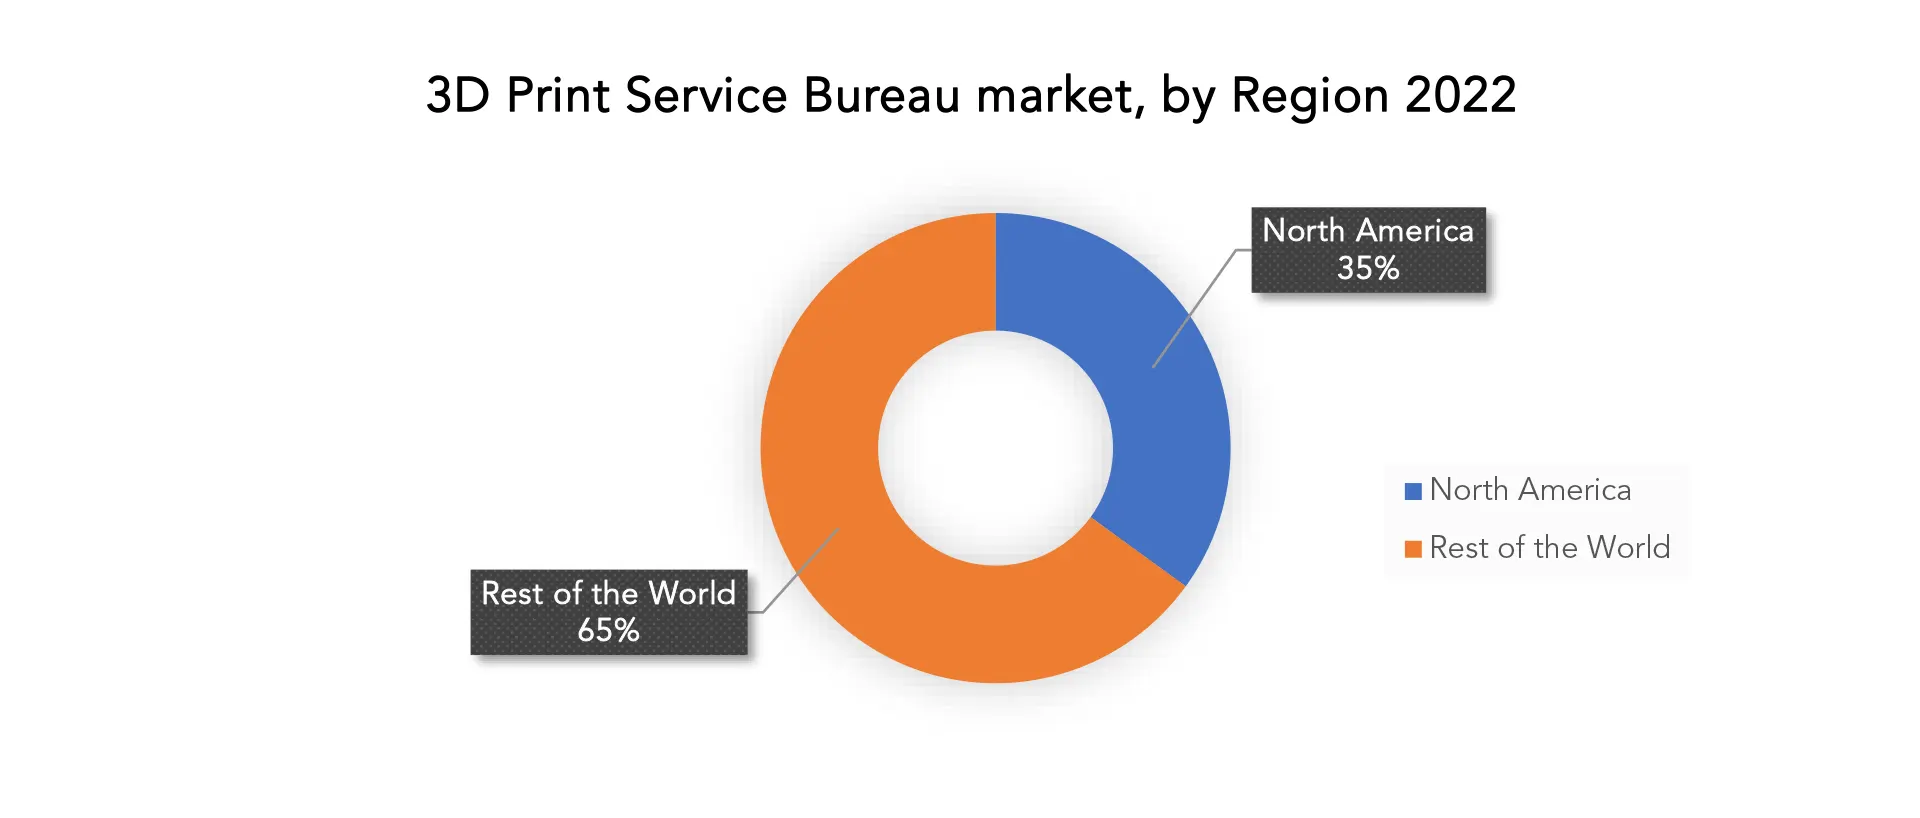
Target Audience for 3D Print Service Bureau market
- Product Designers
- Engineers
- Architects
- Healthcare Professionals
- Automotive Industry
- Aerospace Industry
- Consumer Goods Manufacturers
- Educational Institutions
- Research and Development Teams
- Startups
- Prototyping Services
- Art and Design Studios
- Jewelry Manufacturers
- Manufacturing Companies
- Technology Companies
- Entrepreneurs
- Industrial Designers
- Government Organizations
- Defense Contractors
- Innovators and Inventors
Import & Export Data for 3D Print Service Bureau market
Exactitude consultancy provides import and export data for the recent years. It also offers insights on production and consumption volume of the product. Understanding the import and export data is pivotal for any player in the 3D Print Service Bureau market. This knowledge equips businesses with strategic advantages, such as:- Identifying emerging markets with untapped potential.
- Adapting supply chain strategies to optimize cost-efficiency and market responsiveness.
- Navigating competition by assessing major players' trade dynamics.
Key insights
- Trade volume trends: our report dissects import and export data spanning the last five years to reveal crucial trends and growth patterns within the global 3D Print Service Bureau market. This data-driven exploration empowers readers with a deep understanding of the market's trajectory.
- Market players: gain insights into the leading players driving the network analyzer trade. From established giants to emerging contenders, our analysis highlights the key contributors to the import and export landscape.
- Geographical dynamics: delve into the geographical distribution of trade activities. Uncover which regions dominate exports and which ones hold the reins on imports, painting a comprehensive picture of the industry's global footprint.
- Product breakdown: by segmenting data based on network analyzer types –– we provide a granular view of trade preferences and shifts, enabling businesses to align strategies with the evolving technological landscape.
Segments Covered in the 3D Print Service Bureau Market Report
3D Print Service Bureau Market by Service, 2020-2030, (USD Million) (Thousand Units)- Plastic 3D Printing Services
- Metal 3D Printing Services
- Resin 3D Printing Services
- Others
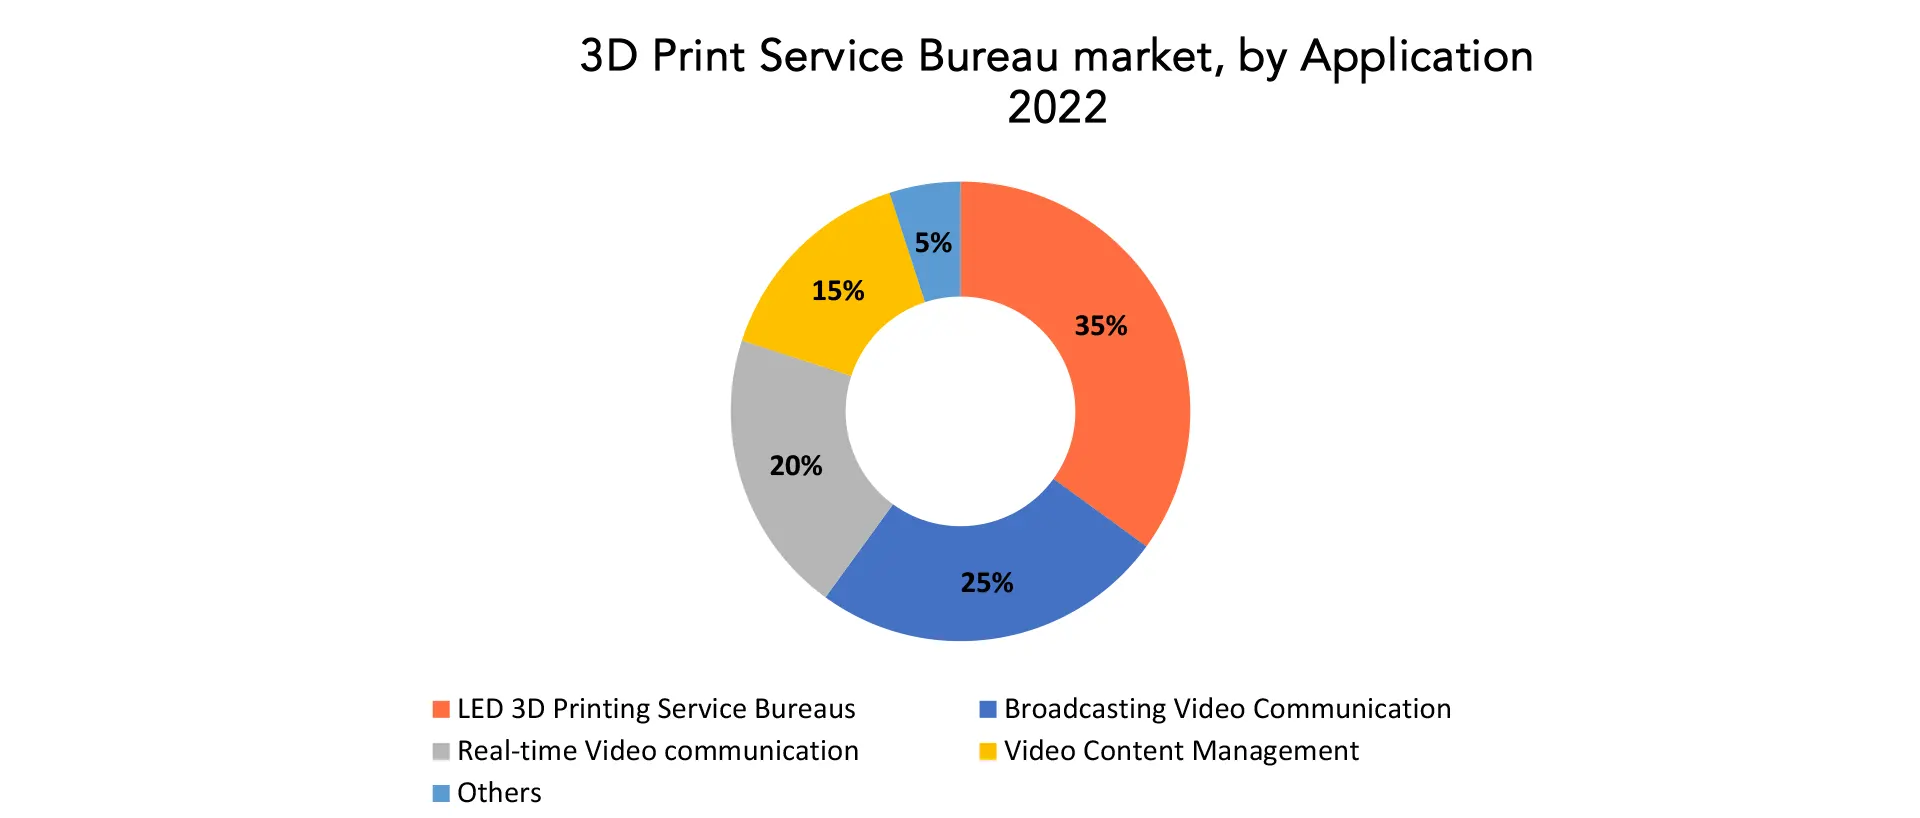
- LED 3D Printing Service Bureaus
- Broadcasting Video Communication
- Real-time Video communication
- Video Content Management
- Others
- Fused Deposition Modelling (FDM)
- Direct Metal Laser Sintering (DMLS)
- Laser Sintering (LS)
- Multi Jet Fusion (MJF)
- Binder Jetting
- Stereolithography (SL)
- North America
- Europe
- Asia Pacific
- South America
- Middle East and Africa
Key Question Answered
- What is the expected growth rate of the 3D Print Service Bureau market over the next 7 years?
- Who are the major players in the 3D Print Service Bureau market and what is their market share?
- What are the end-user industries driving market demand and what is their outlook?
- What are the opportunities for growth in emerging markets such as Asia-Pacific, the middle east, and Africa?
- How is the economic environment affecting the 3D Print Service Bureau market, including factors such as interest rates, inflation, and exchange rates?
- What is the expected impact of government policies and regulations on the 3D Print Service Bureau market?
- What is the current and forecasted size and growth rate of the global 3D Print Service Bureau market?
- What are the key drivers of growth in the 3D Print Service Bureau market?
- Who are the major players in the market and what is their market share?
- What are the distribution channels and supply chain dynamics in the 3D Print Service Bureau market?
- What are the technological advancements and innovations in the 3D Print Service Bureau market and their impact on product development and growth?
- What are the regulatory considerations and their impact on the market?
- What are the challenges faced by players in the 3D Print Service Bureau market and how are they addressing these challenges?
- What are the opportunities for growth and expansion in the 3D Print Service Bureau market?
- What are the product offerings and specifications of leading players in the market?
3D Print Service Bureau Market Segmentation Analysis
The global 3D Print Service Bureau market is divided into three segments, service, application, technology and region. By Service it is divided as Plastic 3D Printing Services, Metal 3D Printing Services, Resin 3D Printing Services, Others. [caption id="attachment_32036" align="aligncenter" width="1920"]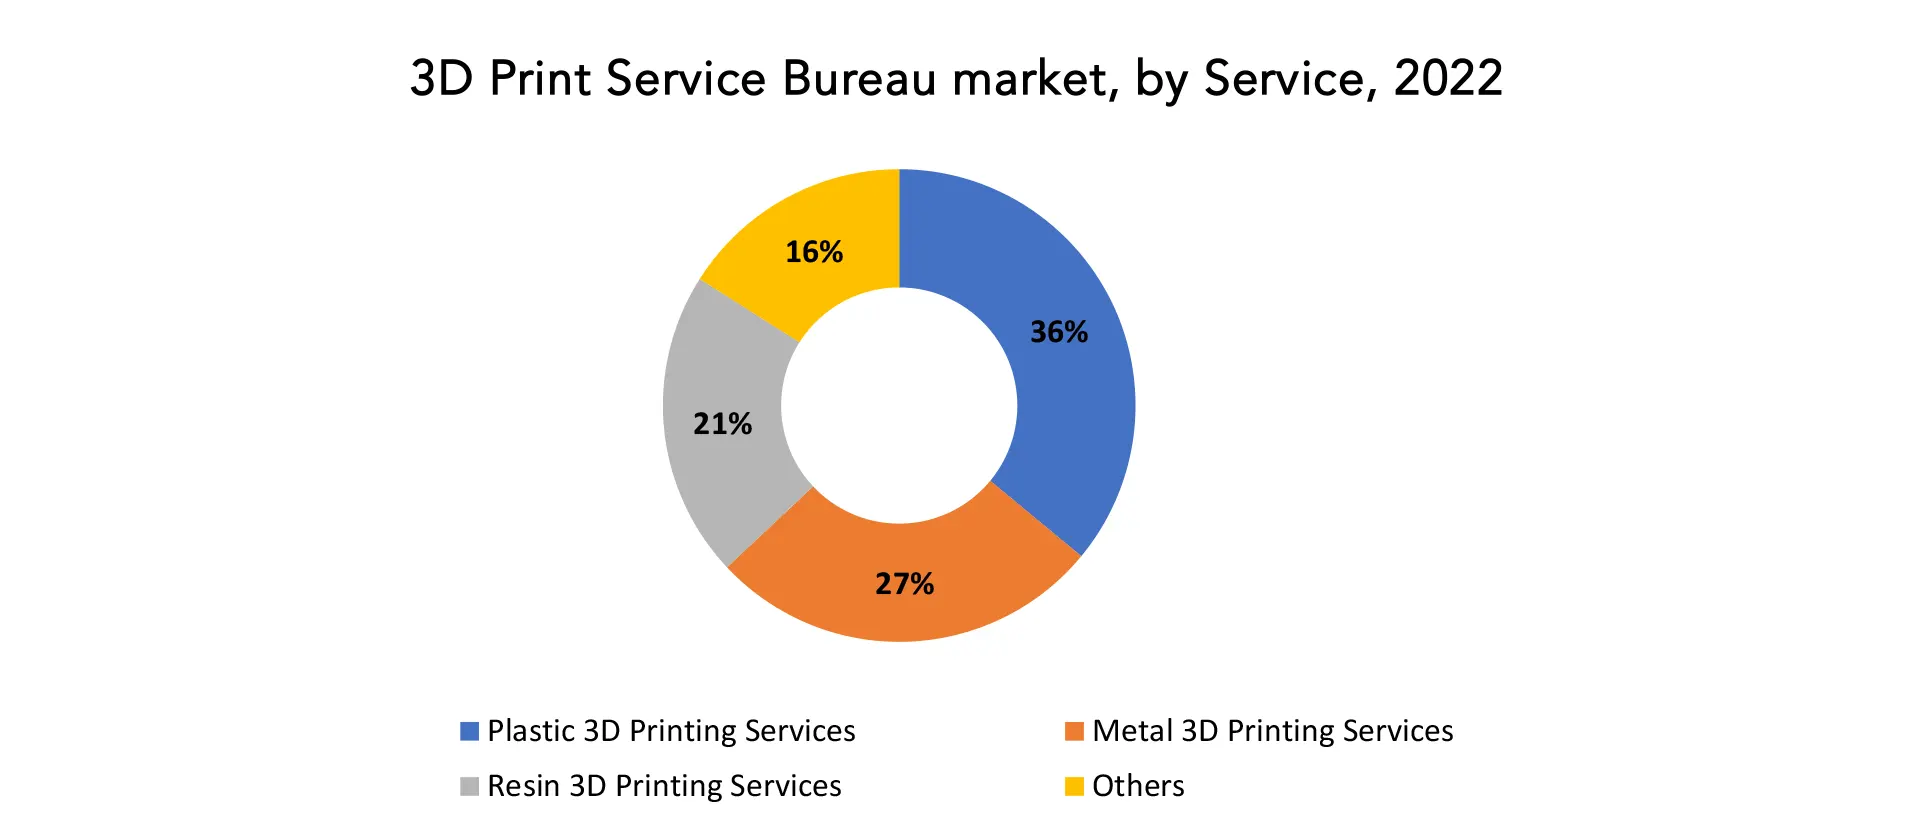
- 導入
- 市場の定義
- 市場セグメンテーション
- 研究タイムライン
- 前提と制限
- 研究方法
- データマイニング
- 二次調査
- 一次研究
- 専門家のアドバイス
- 品質チェック
- 最終レビュー
- データ三角測量
- ボトムアップアプローチ
- トップダウンアプローチ
- 研究の流れ
- データ型
- データマイニング
- エグゼクティブサマリー
- 市場概要
- グローバルネットワークアナライザー市場の展望
- 市場の推進要因
- 市場の制約
- 市場機会
- COVID-19 が 3D プリント サービス ビューロー市場に与える影響
- ポーターの5つの力モデル
- 新規参入からの脅威
- 代替選手からの脅威
- サプライヤーの交渉力
- 顧客の交渉力
- 競争の度合い
- 業界バリューチェーン分析
- グローバルネットワークアナライザー市場の展望
- GLOBAL 3D PRINT SERVICE BUREAU MARKET BY SERVICE, 2020-2030, (USD BILLION) (THOUSAND UNITS)
- BELOW 1.5GHZ
- 5 TO 4GHZ
- 4 TO 10GHZ
- ABOVE 10GHZ
- GLOBAL 3D PRINT SERVICE BUREAU MARKET BY APPLICATION, 2020-2030, (USD BILLION) (THOUSAND UNITS)
- COMMUNICATIONS
- AEROSPACE & MILITARY/DEFENSE
- ELECTRONICS
- AUTOMOTIVE
- GLOBAL 3D PRINT SERVICE BUREAU MARKET BY TECHNOLOGY, 2020-2030, (USD BILLION) (THOUSAND UNITS)
- SCALAR 3D PRINT SERVICE BUREAU (SNA)
- VECTOR 3D PRINT SERVICE BUREAU (VNA)
- GLOBAL 3D PRINT SERVICE BUREAU MARKET BY REGION, 2020-2030, (USD BILLION) (THOUSAND UNITS)
- NORTH AMERICA
- US
- CANADA
- MEXICO
- SOUTH AMERICA
- BRAZIL
- ARGENTINA
- COLOMBIA
- REST OF SOUTH AMERICA
- EUROPE
- GERMANY
- UK
- FRANCE
- ITALY
- SPAIN
- RUSSIA
- REST OF EUROPE
- ASIA PACIFIC
- INDIA
- CHINA
- JAPAN
- SOUTH KOREA
- AUSTRALIA
- SOUTH-EAST ASIA
- REST OF ASIA PACIFIC
- MIDDLE EAST AND AFRICA
- UAE
- SAUDI ARABIA
- SOUTH AFRICA
- REST OF MIDDLE EAST AND AFRICA
- NORTH AMERICA
- COMPANY PROFILES* (BUSINESS OVERVIEW, COMPANY SNAPSHOT, PRODUCT OFFERED, RECENT DEVELOPMENTS)
- SHAPEWAYS
- PROTOLABS
- MATERIALISE NV
- STRATASYS DIRECT MANUFACTURING
- SCULPTEO
- MATERIALISE
- 3D SYSTEMS
- XOMETRY
- EXONE
- FORECAST 3D
- VOODOO MANUFACTURING
- HUBS
- SPECTRA3D TECHNOLOGIES
- FATHOM
- FAST RADIUS
- JABIL
- STAR RAPID
- BIGREP
- KRAFTWURX
- PRINTFORM *THE COMPANY LIST IS INDICATIVE
LIST OF TABLES
TABLE 1 GLOBAL 3D PRINT SERVICE BUREAU MARKET BY SERVICE (USD BILLION) 2020-2030
TABLE 2 GLOBAL 3D PRINT SERVICE BUREAU MARKET BY SERVICE (THOUSAND UNITS) 2020-2030
TABLE 3 GLOBAL 3D PRINT SERVICE BUREAU MARKET BY APPLICATION (USD BILLION) 2020-2030
TABLE 4 GLOBAL 3D PRINT SERVICE BUREAU MARKET BY APPLICATION (THOUSAND UNITS) 2020-2030
TABLE 5 GLOBAL 3D PRINT SERVICE BUREAU MARKET BY TECHNOLOGY (USD BILLION) 2020-2030
TABLE 6 GLOBAL 3D PRINT SERVICE BUREAU MARKET BY TECHNOLOGY (THOUSAND UNITS) 2020-2030
TABLE 7 GLOBAL 3D PRINT SERVICE BUREAU MARKET BY REGION (USD BILLION) 2020-2030
TABLE 8 GLOBAL 3D PRINT SERVICE BUREAU MARKET BY REGION (THOUSAND UNITS) 2020-2030
TABLE 9 NORTH AMERICA 3D PRINT SERVICE BUREAU MARKET BY COUNTRY (USD BILLION) 2020-2030
TABLE 10 NORTH AMERICA 3D PRINT SERVICE BUREAU MARKET BY COUNTRY (THOUSAND UNITS) 2020-2030
TABLE 11 NORTH AMERICA 3D PRINT SERVICE BUREAU MARKET BY SERVICE (USD BILLION) 2020-2030
TABLE 12 NORTH AMERICA 3D PRINT SERVICE BUREAU MARKET BY SERVICE (THOUSAND UNITS) 2020-2030
TABLE 13 NORTH AMERICA 3D PRINT SERVICE BUREAU MARKET BY APPLICATION (USD BILLION) 2020-2030
TABLE 14 NORTH AMERICA 3D PRINT SERVICE BUREAU MARKET BY APPLICATION (THOUSAND UNITS) 2020-2030
TABLE 15 NORTH AMERICA 3D PRINT SERVICE BUREAU MARKET BY TECHNOLOGY (USD BILLION) 2020-2030
TABLE 16 NORTH AMERICA 3D PRINT SERVICE BUREAU MARKET BY TECHNOLOGY (THOUSAND UNITS) 2020-2030
TABLE 17 US 3D PRINT SERVICE BUREAU MARKET BY SERVICE (USD BILLION) 2020-2030
TABLE 18 US 3D PRINT SERVICE BUREAU MARKET BY SERVICE (THOUSAND UNITS) 2020-2030
TABLE 19 US 3D PRINT SERVICE BUREAU MARKET BY APPLICATION (USD BILLION) 2020-2030
TABLE 20 US 3D PRINT SERVICE BUREAU MARKET BY APPLICATION (THOUSAND UNITS) 2020-2030
TABLE 21 US 3D PRINT SERVICE BUREAU MARKET BY TECHNOLOGY (USD BILLION) 2020-2030
TABLE 22 US 3D PRINT SERVICE BUREAU MARKET BY TECHNOLOGY (THOUSAND UNITS) 2020-2030
TABLE 23 CANADA 3D PRINT SERVICE BUREAU MARKET BY SERVICE (USD BILLION) 2020-2030
TABLE 24 CANADA 3D PRINT SERVICE BUREAU MARKET BY SERVICE (THOUSAND UNITS) 2020-2030
TABLE 25 CANADA 3D PRINT SERVICE BUREAU MARKET BY APPLICATION (USD BILLION) 2020-2030
TABLE 26 CANADA 3D PRINT SERVICE BUREAU MARKET BY APPLICATION (THOUSAND UNITS) 2020-2030
TABLE 27 CANADA 3D PRINT SERVICE BUREAU MARKET BY TECHNOLOGY (USD BILLION) 2020-2030
TABLE 28 CANADA 3D PRINT SERVICE BUREAU MARKET BY TECHNOLOGY (THOUSAND UNITS) 2020-2030
TABLE 29 MEXICO 3D PRINT SERVICE BUREAU MARKET BY SERVICE (USD BILLION) 2020-2030
TABLE 30 MEXICO 3D PRINT SERVICE BUREAU MARKET BY SERVICE (THOUSAND UNITS) 2020-2030
TABLE 31 MEXICO 3D PRINT SERVICE BUREAU MARKET BY APPLICATION (USD BILLION) 2020-2030
TABLE 32 MEXICO 3D PRINT SERVICE BUREAU MARKET BY APPLICATION (THOUSAND UNITS) 2020-2030
TABLE 33 MEXICO 3D PRINT SERVICE BUREAU MARKET BY TECHNOLOGY (USD BILLION) 2020-2030
TABLE 34 MEXICO 3D PRINT SERVICE BUREAU MARKET BY TECHNOLOGY (THOUSAND UNITS) 2020-2030
TABLE 35 SOUTH AMERICA 3D PRINT SERVICE BUREAU MARKET BY COUNTRY (USD BILLION) 2020-2030
TABLE 36 SOUTH AMERICA 3D PRINT SERVICE BUREAU MARKET BY COUNTRY (THOUSAND UNITS) 2020-2030
TABLE 37 SOUTH AMERICA 3D PRINT SERVICE BUREAU MARKET BY SERVICE (USD BILLION) 2020-2030
TABLE 38 SOUTH AMERICA 3D PRINT SERVICE BUREAU MARKET BY SERVICE (THOUSAND UNITS) 2020-2030
TABLE 39 SOUTH AMERICA 3D PRINT SERVICE BUREAU MARKET BY APPLICATION (USD BILLION) 2020-2030
TABLE 40 SOUTH AMERICA 3D PRINT SERVICE BUREAU MARKET BY APPLICATION (THOUSAND UNITS) 2020-2030
TABLE 41 SOUTH AMERICA 3D PRINT SERVICE BUREAU MARKET BY TECHNOLOGY (USD BILLION) 2020-2030
TABLE 42 SOUTH AMERICA 3D PRINT SERVICE BUREAU MARKET BY TECHNOLOGY (THOUSAND UNITS) 2020-2030
TABLE 43 BRAZIL 3D PRINT SERVICE BUREAU MARKET BY SERVICE (USD BILLION) 2020-2030
TABLE 44 BRAZIL 3D PRINT SERVICE BUREAU MARKET BY SERVICE (THOUSAND UNITS) 2020-2030
TABLE 45 BRAZIL 3D PRINT SERVICE BUREAU MARKET BY APPLICATION (USD BILLION) 2020-2030
TABLE 46 BRAZIL 3D PRINT SERVICE BUREAU MARKET BY APPLICATION (THOUSAND UNITS) 2020-2030
TABLE 47 BRAZIL 3D PRINT SERVICE BUREAU MARKET BY TECHNOLOGY (USD BILLION) 2020-2030
TABLE 48 BRAZIL 3D PRINT SERVICE BUREAU MARKET BY TECHNOLOGY (THOUSAND UNITS) 2020-2030
TABLE 49 ARGENTINA 3D PRINT SERVICE BUREAU MARKET BY SERVICE (USD BILLION) 2020-2030
TABLE 50 ARGENTINA 3D PRINT SERVICE BUREAU MARKET BY SERVICE (THOUSAND UNITS) 2020-2030
TABLE 51 ARGENTINA 3D PRINT SERVICE BUREAU MARKET BY APPLICATION (USD BILLION) 2020-2030
TABLE 52 ARGENTINA 3D PRINT SERVICE BUREAU MARKET BY APPLICATION (THOUSAND UNITS) 2020-2030
TABLE 53 ARGENTINA 3D PRINT SERVICE BUREAU MARKET BY TECHNOLOGY (USD BILLION) 2020-2030
TABLE 54 ARGENTINA 3D PRINT SERVICE BUREAU MARKET BY TECHNOLOGY (THOUSAND UNITS) 2020-2030
TABLE 55 COLOMBIA 3D PRINT SERVICE BUREAU MARKET BY SERVICE (USD BILLION) 2020-2030
TABLE 56 COLOMBIA 3D PRINT SERVICE BUREAU MARKET BY SERVICE (THOUSAND UNITS) 2020-2030
TABLE 57 COLOMBIA 3D PRINT SERVICE BUREAU MARKET BY APPLICATION (USD BILLION) 2020-2030
TABLE 58 COLOMBIA 3D PRINT SERVICE BUREAU MARKET BY APPLICATION (THOUSAND UNITS) 2020-2030
TABLE 59 COLOMBIA 3D PRINT SERVICE BUREAU MARKET BY TECHNOLOGY (USD BILLION) 2020-2030
TABLE 60 COLOMBIA 3D PRINT SERVICE BUREAU MARKET BY TECHNOLOGY (THOUSAND UNITS) 2020-2030
TABLE 61 REST OF SOUTH AMERICA 3D PRINT SERVICE BUREAU MARKET BY SERVICE (USD BILLION) 2020-2030
TABLE 62 REST OF SOUTH AMERICA 3D PRINT SERVICE BUREAU MARKET BY SERVICE (THOUSAND UNITS) 2020-2030
TABLE 63 REST OF SOUTH AMERICA 3D PRINT SERVICE BUREAU MARKET BY APPLICATION (USD BILLION) 2020-2030
TABLE 64 REST OF SOUTH AMERICA 3D PRINT SERVICE BUREAU MARKET BY APPLICATION (THOUSAND UNITS) 2020-2030
TABLE 65 REST OF SOUTH AMERICA 3D PRINT SERVICE BUREAU MARKET BY TECHNOLOGY (USD BILLION) 2020-2030
TABLE 66 REST OF SOUTH AMERICA 3D PRINT SERVICE BUREAU MARKET BY TECHNOLOGY (THOUSAND UNITS) 2020-2030
TABLE 67 ASIA-PACIFIC 3D PRINT SERVICE BUREAU MARKET BY COUNTRY (USD BILLION) 2020-2030
TABLE 68 ASIA-PACIFIC 3D PRINT SERVICE BUREAU MARKET BY COUNTRY (THOUSAND UNITS) 2020-2030
TABLE 69 ASIA-PACIFIC 3D PRINT SERVICE BUREAU MARKET BY SERVICE (USD BILLION) 2020-2030
TABLE 70 ASIA-PACIFIC 3D PRINT SERVICE BUREAU MARKET BY SERVICE (THOUSAND UNITS) 2020-2030
TABLE 71 ASIA-PACIFIC 3D PRINT SERVICE BUREAU MARKET BY APPLICATION (USD BILLION) 2020-2030
TABLE 72 ASIA-PACIFIC 3D PRINT SERVICE BUREAU MARKET BY APPLICATION (THOUSAND UNITS) 2020-2030
TABLE 73 ASIA-PACIFIC 3D PRINT SERVICE BUREAU MARKET BY TECHNOLOGY (USD BILLION) 2020-2030
TABLE 74 ASIA-PACIFIC 3D PRINT SERVICE BUREAU MARKET BY TECHNOLOGY (THOUSAND UNITS) 2020-2030
TABLE 75 INDIA 3D PRINT SERVICE BUREAU MARKET BY SERVICE (USD BILLION) 2020-2030
TABLE 76 INDIA 3D PRINT SERVICE BUREAU MARKET BY SERVICE (THOUSAND UNITS) 2020-2030
TABLE 77 INDIA 3D PRINT SERVICE BUREAU MARKET BY APPLICATION (USD BILLION) 2020-2030
TABLE 78 INDIA 3D PRINT SERVICE BUREAU MARKET BY APPLICATION (THOUSAND UNITS) 2020-2030
TABLE 79 INDIA 3D PRINT SERVICE BUREAU MARKET BY TECHNOLOGY (USD BILLION) 2020-2030
TABLE 80 INDIA 3D PRINT SERVICE BUREAU MARKET BY TECHNOLOGY (THOUSAND UNITS) 2020-2030
TABLE 81 CHINA 3D PRINT SERVICE BUREAU MARKET BY SERVICE (USD BILLION) 2020-2030
TABLE 82 CHINA 3D PRINT SERVICE BUREAU MARKET BY SERVICE (THOUSAND UNITS) 2020-2030
TABLE 83 CHINA 3D PRINT SERVICE BUREAU MARKET BY APPLICATION (USD BILLION) 2020-2030
TABLE 84 CHINA 3D PRINT SERVICE BUREAU MARKET BY APPLICATION (THOUSAND UNITS) 2020-2030
TABLE 85 CHINA 3D PRINT SERVICE BUREAU MARKET BY TECHNOLOGY (USD BILLION) 2020-2030
TABLE 86 CHINA 3D PRINT SERVICE BUREAU MARKET BY TECHNOLOGY (THOUSAND UNITS) 2020-2030
TABLE 87 JAPAN 3D PRINT SERVICE BUREAU MARKET BY SERVICE (USD BILLION) 2020-2030
TABLE 88 JAPAN 3D PRINT SERVICE BUREAU MARKET BY SERVICE (THOUSAND UNITS) 2020-2030
TABLE 89 JAPAN 3D PRINT SERVICE BUREAU MARKET BY APPLICATION (USD BILLION) 2020-2030
TABLE 90 JAPAN 3D PRINT SERVICE BUREAU MARKET BY APPLICATION (THOUSAND UNITS) 2020-2030
TABLE 91 JAPAN 3D PRINT SERVICE BUREAU MARKET BY TECHNOLOGY (USD BILLION) 2020-2030
TABLE 92 JAPAN 3D PRINT SERVICE BUREAU MARKET BY TECHNOLOGY (THOUSAND UNITS) 2020-2030
TABLE 93 SOUTH KOREA 3D PRINT SERVICE BUREAU MARKET BY SERVICE (USD BILLION) 2020-2030
TABLE 94 SOUTH KOREA 3D PRINT SERVICE BUREAU MARKET BY SERVICE (THOUSAND UNITS) 2020-2030
TABLE 95 SOUTH KOREA 3D PRINT SERVICE BUREAU MARKET BY APPLICATION (USD BILLION) 2020-2030
TABLE 96 SOUTH KOREA 3D PRINT SERVICE BUREAU MARKET BY APPLICATION (THOUSAND UNITS) 2020-2030
TABLE 97 SOUTH KOREA 3D PRINT SERVICE BUREAU MARKET BY TECHNOLOGY (USD BILLION) 2020-2030
TABLE 98 SOUTH KOREA 3D PRINT SERVICE BUREAU MARKET BY TECHNOLOGY (THOUSAND UNITS) 2020-2030
TABLE 99 AUSTRALIA 3D PRINT SERVICE BUREAU MARKET BY SERVICE (USD BILLION) 2020-2030
TABLE 100 AUSTRALIA 3D PRINT SERVICE BUREAU MARKET BY SERVICE (THOUSAND UNITS) 2020-2030
TABLE 101 AUSTRALIA 3D PRINT SERVICE BUREAU MARKET BY APPLICATION (USD BILLION) 2020-2030
TABLE 102 AUSTRALIA 3D PRINT SERVICE BUREAU MARKET BY APPLICATION (THOUSAND UNITS) 2020-2030
TABLE 103 AUSTRALIA 3D PRINT SERVICE BUREAU MARKET BY TECHNOLOGY (USD BILLION) 2020-2030
TABLE 104 AUSTRALIA 3D PRINT SERVICE BUREAU MARKET BY TECHNOLOGY (THOUSAND UNITS) 2020-2030
TABLE 105 SOUTH-EAST ASIA 3D PRINT SERVICE BUREAU MARKET BY SERVICE (USD BILLION) 2020-2030
TABLE 106 SOUTH-EAST ASIA 3D PRINT SERVICE BUREAU MARKET BY SERVICE (THOUSAND UNITS) 2020-2030
TABLE 107 SOUTH-EAST ASIA 3D PRINT SERVICE BUREAU MARKET BY APPLICATION (USD BILLION) 2020-2030
TABLE 108 SOUTH-EAST ASIA 3D PRINT SERVICE BUREAU MARKET BY APPLICATION (THOUSAND UNITS) 2020-2030
TABLE 109 SOUTH-EAST ASIA 3D PRINT SERVICE BUREAU MARKET BY TECHNOLOGY (USD BILLION) 2020-2030
TABLE 110 SOUTH-EAST ASIA 3D PRINT SERVICE BUREAU MARKET BY TECHNOLOGY (THOUSAND UNITS) 2020-2030
TABLE 111 REST OF ASIA PACIFIC 3D PRINT SERVICE BUREAU MARKET BY SERVICE (USD BILLION) 2020-2030
TABLE 112 REST OF ASIA PACIFIC 3D PRINT SERVICE BUREAU MARKET BY SERVICE (THOUSAND UNITS) 2020-2030
TABLE 113 REST OF ASIA PACIFIC 3D PRINT SERVICE BUREAU MARKET BY APPLICATION (USD BILLION) 2020-2030
TABLE 114 REST OF ASIA PACIFIC 3D PRINT SERVICE BUREAU MARKET BY APPLICATION (THOUSAND UNITS) 2020-2030
TABLE 115 REST OF ASIA PACIFIC 3D PRINT SERVICE BUREAU MARKET BY TECHNOLOGY (USD BILLION) 2020-2030
TABLE 116 REST OF ASIA PACIFIC 3D PRINT SERVICE BUREAU MARKET BY TECHNOLOGY (THOUSAND UNITS) 2020-2030
TABLE 117 EUROPE 3D PRINT SERVICE BUREAU MARKET BY COUNTRY (USD BILLION) 2020-2030
TABLE 118 EUROPE 3D PRINT SERVICE BUREAU MARKET BY COUNTRY (THOUSAND UNITS) 2020-2030
TABLE 119 EUROPE 3D PRINT SERVICE BUREAU MARKET BY SERVICE (USD BILLION) 2020-2030
TABLE 120 EUROPE 3D PRINT SERVICE BUREAU MARKET BY SERVICE (THOUSAND UNITS) 2020-2030
TABLE 121 EUROPE 3D PRINT SERVICE BUREAU MARKET BY APPLICATION (USD BILLION) 2020-2030
TABLE 122 EUROPE 3D PRINT SERVICE BUREAU MARKET BY APPLICATION (THOUSAND UNITS) 2020-2030
TABLE 123 EUROPE 3D PRINT SERVICE BUREAU MARKET BY TECHNOLOGY (USD BILLION) 2020-2030
TABLE 124 EUROPE 3D PRINT SERVICE BUREAU MARKET BY TECHNOLOGY (THOUSAND UNITS) 2020-2030
TABLE 125 GERMANY 3D PRINT SERVICE BUREAU MARKET BY SERVICE (USD BILLION) 2020-2030
TABLE 126 GERMANY 3D PRINT SERVICE BUREAU MARKET BY SERVICE (THOUSAND UNITS) 2020-2030
TABLE 127 GERMANY 3D PRINT SERVICE BUREAU MARKET BY APPLICATION (USD BILLION) 2020-2030
TABLE 128 GERMANY 3D PRINT SERVICE BUREAU MARKET BY APPLICATION (THOUSAND UNITS) 2020-2030
TABLE 129 GERMANY 3D PRINT SERVICE BUREAU MARKET BY TECHNOLOGY (USD BILLION) 2020-2030
TABLE 130 GERMANY 3D PRINT SERVICE BUREAU MARKET BY TECHNOLOGY (THOUSAND UNITS) 2020-2030
TABLE 131 UK 3D PRINT SERVICE BUREAU MARKET BY SERVICE (USD BILLION) 2020-2030
TABLE 132 UK 3D PRINT SERVICE BUREAU MARKET BY SERVICE (THOUSAND UNITS) 2020-2030
TABLE 133 UK 3D PRINT SERVICE BUREAU MARKET BY APPLICATION (USD BILLION) 2020-2030
TABLE 134 UK 3D PRINT SERVICE BUREAU MARKET BY APPLICATION (THOUSAND UNITS) 2020-2030
TABLE 135 UK 3D PRINT SERVICE BUREAU MARKET BY TECHNOLOGY (USD BILLION) 2020-2030
TABLE 136 UK 3D PRINT SERVICE BUREAU MARKET BY TECHNOLOGY (THOUSAND UNITS) 2020-2030
TABLE 137 FRANCE 3D PRINT SERVICE BUREAU MARKET BY SERVICE (USD BILLION) 2020-2030
TABLE 138 FRANCE 3D PRINT SERVICE BUREAU MARKET BY SERVICE (THOUSAND UNITS) 2020-2030
TABLE 139 FRANCE 3D PRINT SERVICE BUREAU MARKET BY APPLICATION (USD BILLION) 2020-2030
TABLE 140 FRANCE 3D PRINT SERVICE BUREAU MARKET BY APPLICATION (THOUSAND UNITS) 2020-2030
TABLE 141 FRANCE 3D PRINT SERVICE BUREAU MARKET BY TECHNOLOGY (USD BILLION) 2020-2030
TABLE 142 FRANCE 3D PRINT SERVICE BUREAU MARKET BY TECHNOLOGY (THOUSAND UNITS) 2020-2030
TABLE 143 ITALY 3D PRINT SERVICE BUREAU MARKET BY SERVICE (USD BILLION) 2020-2030
TABLE 144 ITALY 3D PRINT SERVICE BUREAU MARKET BY SERVICE (THOUSAND UNITS) 2020-2030
TABLE 145 ITALY 3D PRINT SERVICE BUREAU MARKET BY APPLICATION (USD BILLION) 2020-2030
TABLE 146 ITALY 3D PRINT SERVICE BUREAU MARKET BY APPLICATION (THOUSAND UNITS) 2020-2030
TABLE 147 ITALY 3D PRINT SERVICE BUREAU MARKET BY TECHNOLOGY (USD BILLION) 2020-2030
TABLE 148 ITALY 3D PRINT SERVICE BUREAU MARKET BY TECHNOLOGY (THOUSAND UNITS) 2020-2030
TABLE 149 SPAIN 3D PRINT SERVICE BUREAU MARKET BY SERVICE (USD BILLION) 2020-2030
TABLE 150 SPAIN 3D PRINT SERVICE BUREAU MARKET BY SERVICE (THOUSAND UNITS) 2020-2030
TABLE 151 SPAIN 3D PRINT SERVICE BUREAU MARKET BY APPLICATION (USD BILLION) 2020-2030
TABLE 152 SPAIN 3D PRINT SERVICE BUREAU MARKET BY APPLICATION (THOUSAND UNITS) 2020-2030
TABLE 153 SPAIN 3D PRINT SERVICE BUREAU MARKET BY TECHNOLOGY (USD BILLION) 2020-2030
TABLE 154 SPAIN 3D PRINT SERVICE BUREAU MARKET BY TECHNOLOGY (THOUSAND UNITS) 2020-2030
TABLE 155 RUSSIA 3D PRINT SERVICE BUREAU MARKET BY SERVICE (USD BILLION) 2020-2030
TABLE 156 RUSSIA 3D PRINT SERVICE BUREAU MARKET BY SERVICE (THOUSAND UNITS) 2020-2030
TABLE 157 RUSSIA 3D PRINT SERVICE BUREAU MARKET BY APPLICATION (USD BILLION) 2020-2030
TABLE 158 RUSSIA 3D PRINT SERVICE BUREAU MARKET BY APPLICATION (THOUSAND UNITS) 2020-2030
TABLE 159 RUSSIA 3D PRINT SERVICE BUREAU MARKET BY TECHNOLOGY (USD BILLION) 2020-2030
TABLE 160 RUSSIA 3D PRINT SERVICE BUREAU MARKET BY TECHNOLOGY (THOUSAND UNITS) 2020-2030
TABLE 161 REST OF EUROPE 3D PRINT SERVICE BUREAU MARKET BY SERVICE (USD BILLION) 2020-2030
TABLE 162 REST OF EUROPE 3D PRINT SERVICE BUREAU MARKET BY SERVICE (THOUSAND UNITS) 2020-2030
TABLE 163 REST OF EUROPE 3D PRINT SERVICE BUREAU MARKET BY APPLICATION (USD BILLION) 2020-2030
TABLE 164 REST OF EUROPE 3D PRINT SERVICE BUREAU MARKET BY APPLICATION (THOUSAND UNITS) 2020-2030
TABLE 165 REST OF EUROPE 3D PRINT SERVICE BUREAU MARKET BY TECHNOLOGY (USD BILLION) 2020-2030
TABLE 166 REST OF EUROPE 3D PRINT SERVICE BUREAU MARKET BY TECHNOLOGY (THOUSAND UNITS) 2020-2030
TABLE 167 MIDDLE EAST AND AFRICA 3D PRINT SERVICE BUREAU MARKET BY COUNTRY (USD BILLION) 2020-2030
TABLE 168 MIDDLE EAST AND AFRICA 3D PRINT SERVICE BUREAU MARKET BY COUNTRY (THOUSAND UNITS) 2020-2030
TABLE 169 MIDDLE EAST AND AFRICA 3D PRINT SERVICE BUREAU MARKET BY SERVICE (USD BILLION) 2020-2030
TABLE 170 MIDDLE EAST AND AFRICA 3D PRINT SERVICE BUREAU MARKET BY SERVICE (THOUSAND UNITS) 2020-2030
TABLE 171 MIDDLE EAST AND AFRICA 3D PRINT SERVICE BUREAU MARKET BY APPLICATION (USD BILLION) 2020-2030
TABLE 172 MIDDLE EAST AND AFRICA 3D PRINT SERVICE BUREAU MARKET BY APPLICATION (THOUSAND UNITS) 2020-2030
TABLE 173 MIDDLE EAST AND AFRICA 3D PRINT SERVICE BUREAU MARKET BY TECHNOLOGY (USD BILLION) 2020-2030
TABLE 174 MIDDLE EAST AND AFRICA 3D PRINT SERVICE BUREAU MARKET BY TECHNOLOGY (THOUSAND UNITS) 2020-2030
TABLE 175 UAE 3D PRINT SERVICE BUREAU MARKET BY SERVICE (USD BILLION) 2020-2030
TABLE 176 UAE 3D PRINT SERVICE BUREAU MARKET BY SERVICE (THOUSAND UNITS) 2020-2030
TABLE 177 UAE 3D PRINT SERVICE BUREAU MARKET BY APPLICATION (USD BILLION) 2020-2030
TABLE 178 UAE 3D PRINT SERVICE BUREAU MARKET BY APPLICATION (THOUSAND UNITS) 2020-2030
TABLE 179 UAE 3D PRINT SERVICE BUREAU MARKET BY TECHNOLOGY (USD BILLION) 2020-2030
TABLE 180 UAE 3D PRINT SERVICE BUREAU MARKET BY TECHNOLOGY (THOUSAND UNITS) 2020-2030
TABLE 181 SAUDI ARABIA 3D PRINT SERVICE BUREAU MARKET BY SERVICE (USD BILLION) 2020-2030
TABLE 182 SAUDI ARABIA 3D PRINT SERVICE BUREAU MARKET BY SERVICE (THOUSAND UNITS) 2020-2030
TABLE 183 SAUDI ARABIA 3D PRINT SERVICE BUREAU MARKET BY APPLICATION (USD BILLION) 2020-2030
TABLE 184 SAUDI ARABIA 3D PRINT SERVICE BUREAU MARKET BY APPLICATION (THOUSAND UNITS) 2020-2030
TABLE 185 SAUDI ARABIA 3D PRINT SERVICE BUREAU MARKET BY TECHNOLOGY (USD BILLION) 2020-2030
TABLE 186 SAUDI ARABIA 3D PRINT SERVICE BUREAU MARKET BY TECHNOLOGY (THOUSAND UNITS) 2020-2030
TABLE 187 SOUTH AFRICA 3D PRINT SERVICE BUREAU MARKET BY SERVICE (USD BILLION) 2020-2030
TABLE 188 SOUTH AFRICA 3D PRINT SERVICE BUREAU MARKET BY SERVICE (THOUSAND UNITS) 2020-2030
TABLE 189 SOUTH AFRICA 3D PRINT SERVICE BUREAU MARKET BY APPLICATION (USD BILLION) 2020-2030
TABLE 190 SOUTH AFRICA 3D PRINT SERVICE BUREAU MARKET BY APPLICATION (THOUSAND UNITS) 2020-2030
TABLE 191 SOUTH AFRICA 3D PRINT SERVICE BUREAU MARKET BY TECHNOLOGY (USD BILLION) 2020-2030
TABLE 192 SOUTH AFRICA 3D PRINT SERVICE BUREAU MARKET BY TECHNOLOGY (THOUSAND UNITS) 2020-2030
TABLE 193 REST OF MIDDLE EAST AND AFRICA 3D PRINT SERVICE BUREAU MARKET BY SERVICE (USD BILLION) 2020-2030
TABLE 194 REST OF MIDDLE EAST AND AFRICA 3D PRINT SERVICE BUREAU MARKET BY SERVICE (THOUSAND UNITS) 2020-2030
TABLE 195 REST OF MIDDLE EAST AND AFRICA 3D PRINT SERVICE BUREAU MARKET BY APPLICATION (USD BILLION) 2020-2030
TABLE 196 REST OF MIDDLE EAST AND AFRICA 3D PRINT SERVICE BUREAU MARKET BY APPLICATION (THOUSAND UNITS) 2020-2030
TABLE 197 REST OF MIDDLE EAST AND AFRICA 3D PRINT SERVICE BUREAU MARKET BY TECHNOLOGY (USD BILLION) 2020-2030
TABLE 198 REST OF MIDDLE EAST AND AFRICA 3D PRINT SERVICE BUREAU MARKET BY TECHNOLOGY (THOUSAND UNITS) 2020-2030
LIST OF FIGURES
FIGURE 1 MARKET DYNAMICS
FIGURE 2 MARKET SEGMENTATION
FIGURE 3 REPORT TIMELINES: YEARS CONSIDERED
FIGURE 4 DATA TRIANGULATION
FIGURE 5 BOTTOM-UP APPROACH
FIGURE 6 TOP-DOWN APPROACH
FIGURE 7 RESEARCH FLOW
FIGURE 8 GLOBAL 3D PRINT SERVICE BUREAU MARKET BY SERVICE (USD BILLION) 2020-2030
FIGURE 9 GLOBAL 3D PRINT SERVICE BUREAU MARKET BY APPLICATION (USD BILLION) 2020-2030
FIGURE 10 GLOBAL 3D PRINT SERVICE BUREAU MARKET BY TECHNOLOGY (USD BILLION) 2020-2030
FIGURE 11 GLOBAL 3D PRINT SERVICE BUREAU MARKET BY REGION (USD BILLION) 2020-2030
FIGURE 12 PORTER’S FIVE FORCES MODEL
FIGURE 13 GLOBAL 3D PRINT SERVICE BUREAU MARKET BY SERVICE (USD BILLION) 2022
FIGURE 14 GLOBAL 3D PRINT SERVICE BUREAU MARKET BY APPLICATION (USD BILLION) 2022
FIGURE 15 GLOBAL 3D PRINT SERVICE BUREAU MARKET BY TECHNOLOGY (USD BILLION) 2022
FIGURE 16 GLOBAL 3D PRINT SERVICE BUREAU MARKET BY REGION (USD BILLION) 2022
FIGURE 17 MARKET SHARE ANALYSIS
FIGURE 18 SHAPEWAYS: COMPANY SNAPSHOT
FIGURE 19 PROTOLABS: COMPANY SNAPSHOT
FIGURE 20 MATERIALISE NV: COMPANY SNAPSHOT
FIGURE 21 STRATASYS DIRECT MANUFACTURING: COMPANY SNAPSHOT
FIGURE 22 SCULPTEO: COMPANY SNAPSHOT
FIGURE 23 I.MATERIALISE: COMPANY SNAPSHOT
FIGURE 24 3D SYSTEMS: COMPANY SNAPSHOT
FIGURE 25 XOMETRY: COMPANY SNAPSHOT
FIGURE 26 EXONE: COMPANY SNAPSHOT
FIGURE 27 FORECAST 3D: COMPANY SNAPSHOT
FIGURE 28 VOODOO MANUFACTURING: COMPANY SNAPSHOT
FIGURE 29 HUBS: COMPANY SNAPSHOT
FIGURE 30 SPECTRA3D TECHNOLOGIES: COMPANY SNAPSHOT
FIGURE 31 FATHOM: COMPANY SNAPSHOT
FIGURE 32 FAST RADIUS: COMPANY SNAPSHOT
FIGURE 33 JABIL: COMPANY SNAPSHOT
FIGURE 34 STAR RAPID: COMPANY SNAPSHOT
FIGURE 35 BIGREP: COMPANY SNAPSHOT
FIGURE 36 KRAFTWURX: COMPANY SNAPSHOT
FIGURE 37 PRINTFORM: COMPANY SNAPSHOT
DOWNLOAD FREE SAMPLE REPORT
License Type
SPEAK WITH OUR ANALYST
Want to know more about the report or any specific requirement?
WANT TO CUSTOMIZE THE REPORT?
Our Clients Speak
We asked them to research ‘ Equipment market’ all over the world, and their whole arrangement was helpful to us. thehealthanalytics.com insightful analysis and reports contributed to our current analysis and in creating a future strategy. Besides, the te
Yosuke Mitsui
Senior Associate Construction Equipment Sales & Marketing
We asked them to research ‘Equipment market’ all over the world, and their whole arrangement was helpful to us. thehealthanalytics.com insightful analysis and reports contributed to our current analysis and in creating a future strategy. Besides, the te


