

Base Year Value ()
x.x %
x.x %
CAGR ()
x.x %
x.x %
Forecast Year Value ()
x.x %
x.x %
Historical Data Period
Largest Region
Forecast Period
近赤外分光法市場:製品別(分散型赤外分光法、フーリエ変換ベース(FT-NIR)分光計)、タイプ別(ベンチトップ型、ポータブル型)、用途別(医療用途、天文分光法、リモートモニタリング、農業、粒子測定、材料科学、工業用途)および地域別、2023年から2030年までの世界的な傾向と予測
Instant access to hundreds of data points and trends
- Market estimates from 2014-2029
- Competitive analysis, industry segmentation, financial benchmarks
- Incorporates SWOT, Porter's Five Forces and risk management frameworks
- PDF report or online database with Word, Excel and PowerPoint export options
- 100% money back guarantee
近赤外分光法市場の概要
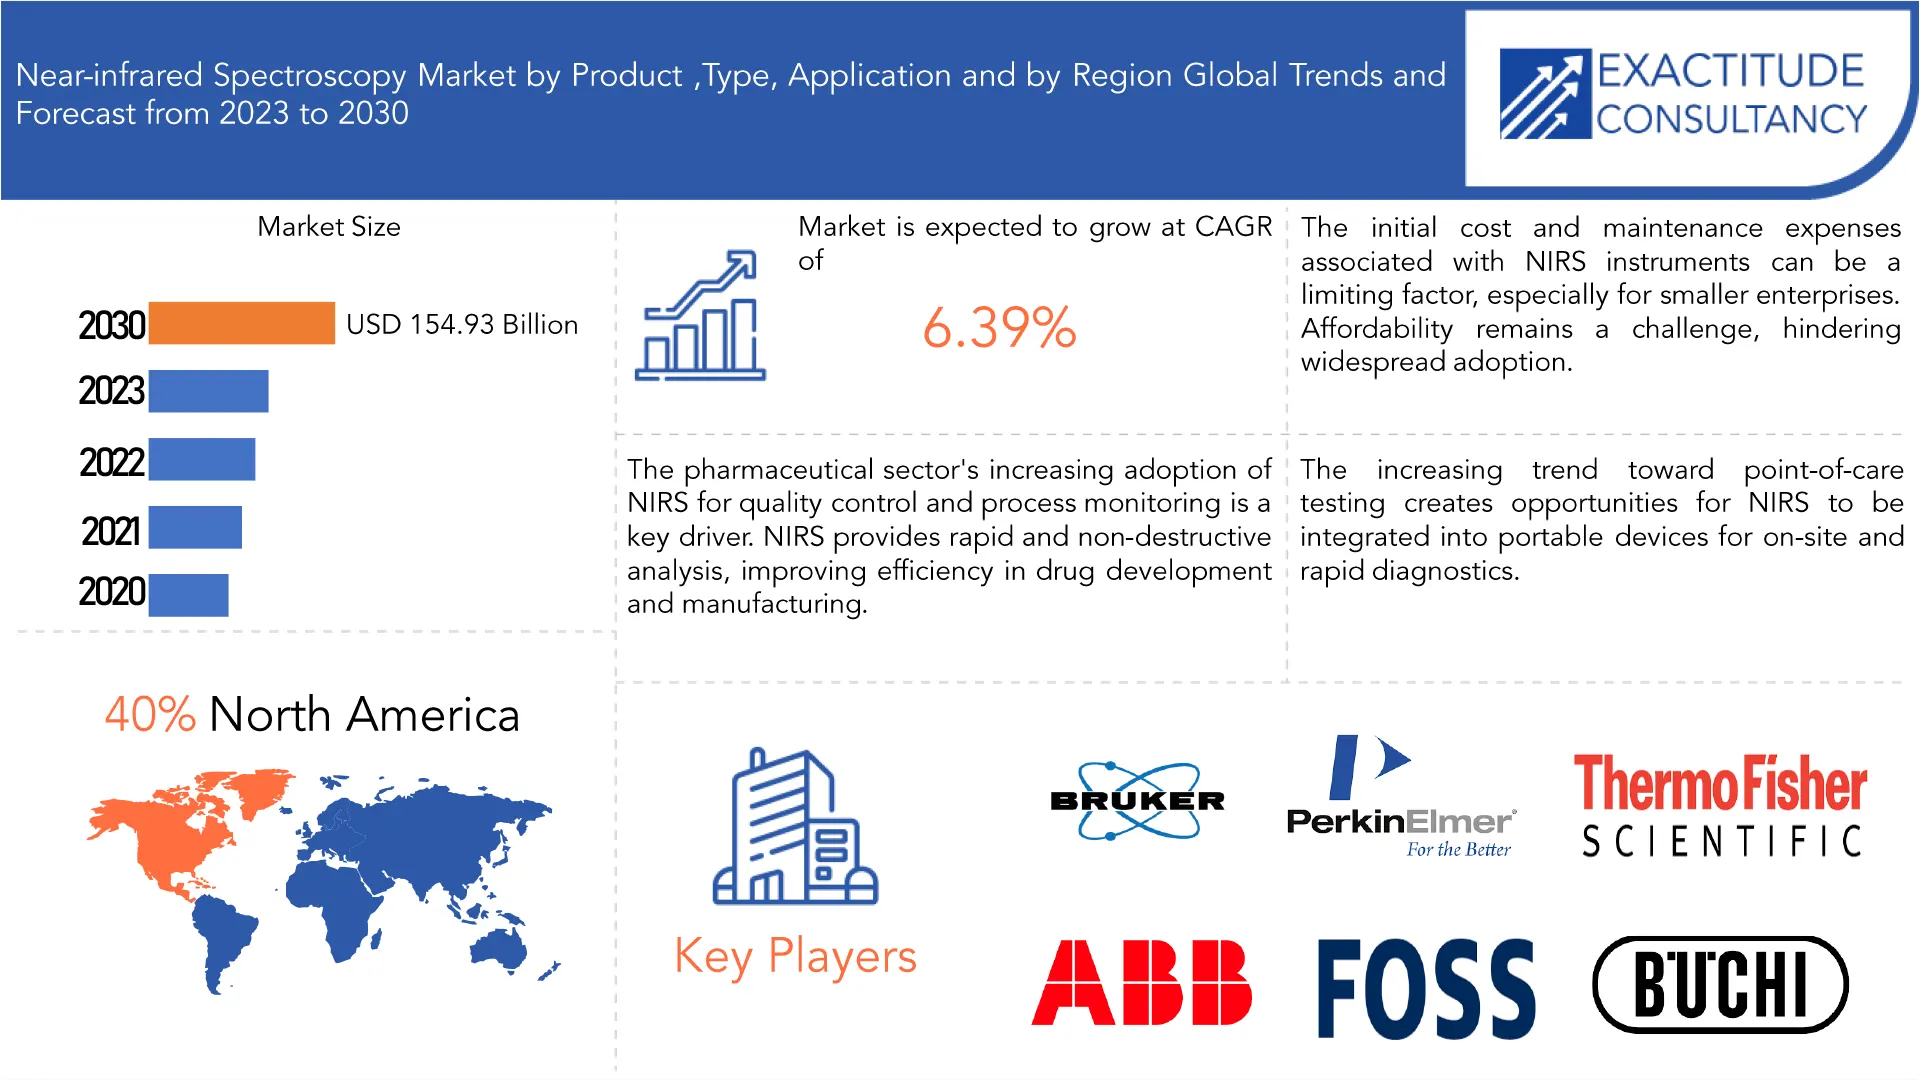
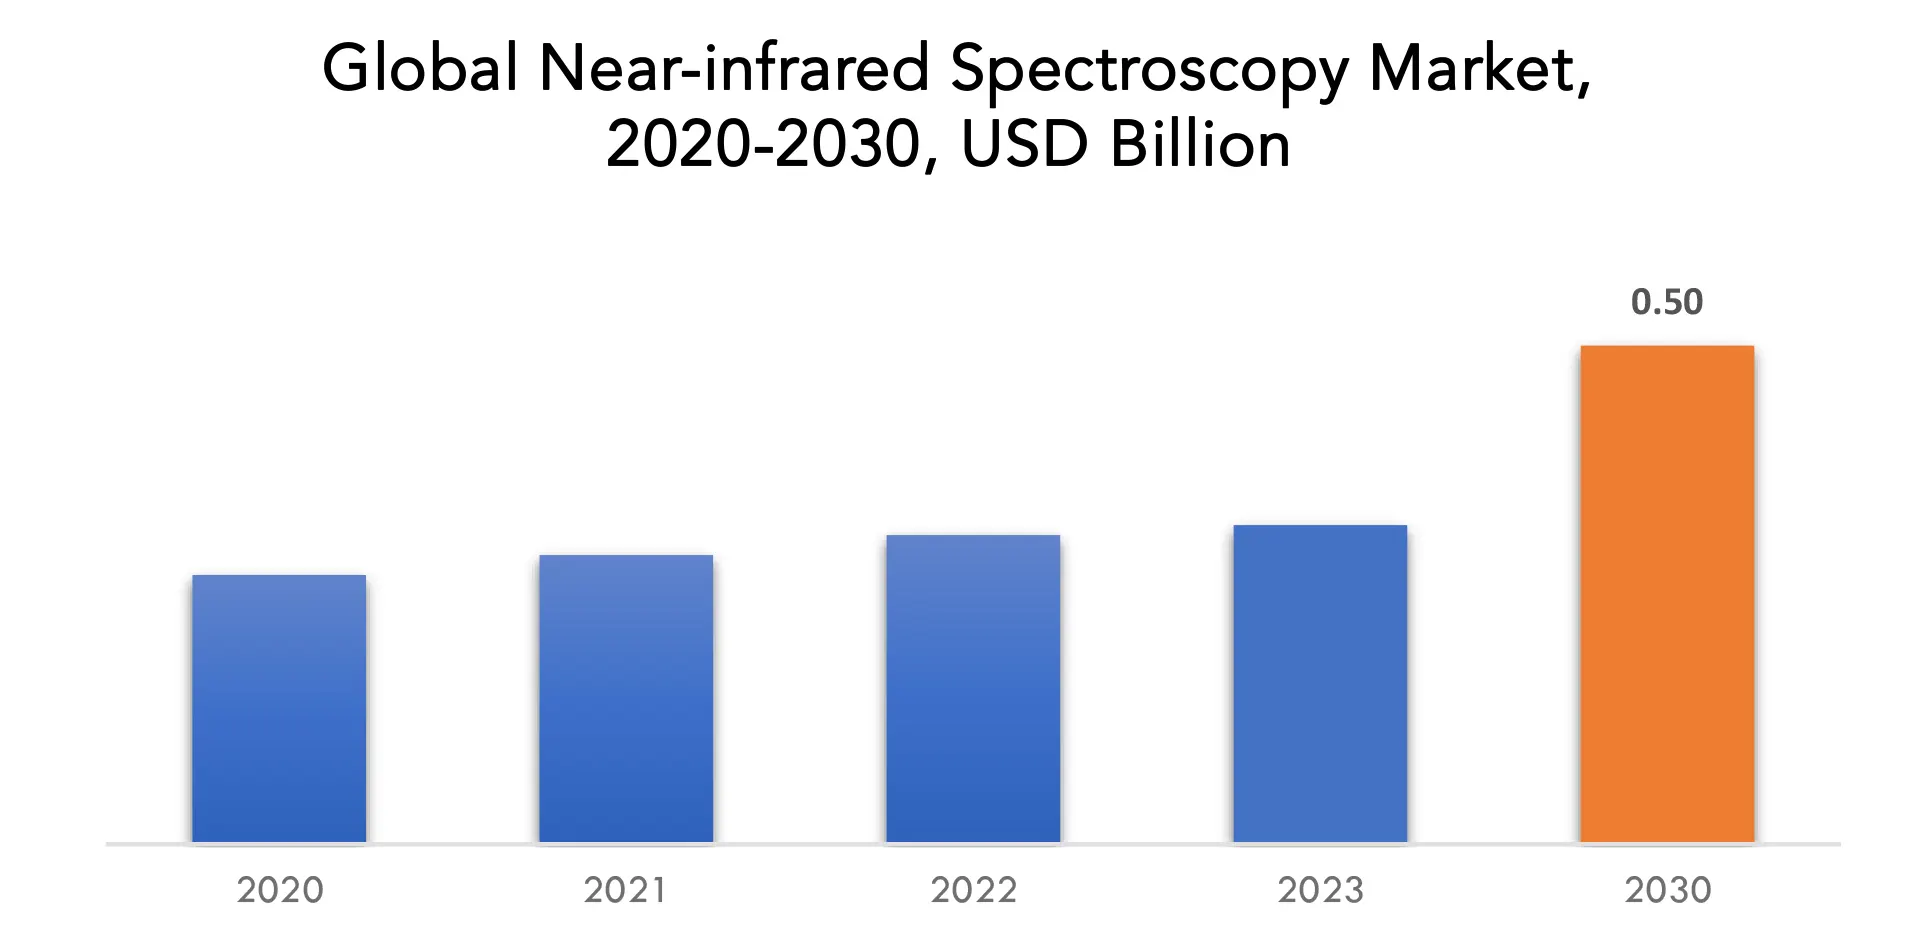
世界の近赤外線分光法市場は、予測期間中に6.30%のCAGRで成長し、2023年の3億2,000万米ドルから2030年には5億米ドルに達すると予想されています。近赤外線
分光法(NIRS)は、材料分析のために電磁スペクトルの近赤外線領域を利用する非破壊分析技術です。サンプルの分子振動と相互作用することにより、特定の波長での近赤外線吸収は分子構造に関する洞察を提供し、さまざまな成分の識別と定量化を容易にします。NIRSは、製薬、農業、食品および飲料、環境モニタリング、医療診断など、さまざまな業界で幅広く使用されています。その非侵襲性と汎用性により、品質管理、プロセス監視、およびさまざまな分野の研究に役立つツールとなっています。計測機器とデータ分析方法の継続的な進歩により、複雑なサンプルを正確かつ迅速に分析するためのNIRS機能が強化され続けています。近赤外分光法 (NIRS) 市場の重要性は、さまざまな業界の分析プロセスに及ぼす変革的な影響によって強調されています。特に注目すべきは、NIRS が医薬品有効成分 (API) と賦形剤の特定と定量化において極めて重要な役割を果たしている製薬分野への影響です。農業では、NIRS によって作物の品質を迅速かつ非破壊的に評価できるため、農家は収穫と保管について十分な情報に基づいた決定を下すことができます。食品および飲料業界では、NIRS は品質管理に不可欠であり、水分含有量、脂肪組成、タンパク質レベルなどのパラメータの分析を通じて製品の一貫性と信頼性を確保しています。[caption id="attachment_34564" align="aligncenter" width="1920"]
| 属性 | 詳細 |
| 研究期間 | 2020-2030 |
| 基準年 | 2022 |
| 推定年 | 2023 |
| 予測年 | 2023-2030 |
| 歴史的期間 | 2019-2021 |
| ユニット | 金額(10億米ドル) 数量(千個) |
| セグメンテーション | 製品、タイプ、 用途、地域別 |
| 製品別 |
|
| タイプ別 |
|
| アプリケーション別 |
|
| 地域別 |
|
Frequently Asked Questions
• What is the market size for the near-infrared spectroscopy market?
The global near-infrared spectroscopy market is anticipated to grow from USD 0.32 Billion in 2023 to USD 0.50 Billion by 2030, at a CAGR of 6.30 % during the forecast period.
• Which region is dominating in the near-infrared spectroscopy market?
North America accounted for the largest market in the near-infrared spectroscopy market. North America accounted for 40 % market share of the global market value.
• Who are the major key players in the near-infrared spectroscopy market?
Bruker Corporation, PerkinElmer Inc., Thermo Fisher Scientific Inc., ABB Ltd., FOSS AS, BUCHI Labortechnik AG, Yokogawa Electric Corporation, Shimadzu Corporation, Agilent Technologies Inc., Sartorius AG, Lumex Instruments, Metrohm AG, Ocean Insight, Polytec GmbH, Viavi Solutions Inc., Zeltex LLC, ZEUTEC, Avantes BV, Brainbox Ltd., B&W Tek
• What are the key trends in the near-infrared spectroscopy market?
The Near-Infrared Spectroscopy (NIRS) market include the increasing integration of NIRS with artificial intelligence and machine learning for enhanced data analysis and interpretation. Additionally, the rising adoption of miniaturized and portable NIRS devices is a notable trend, providing flexibility and accessibility across various industries.
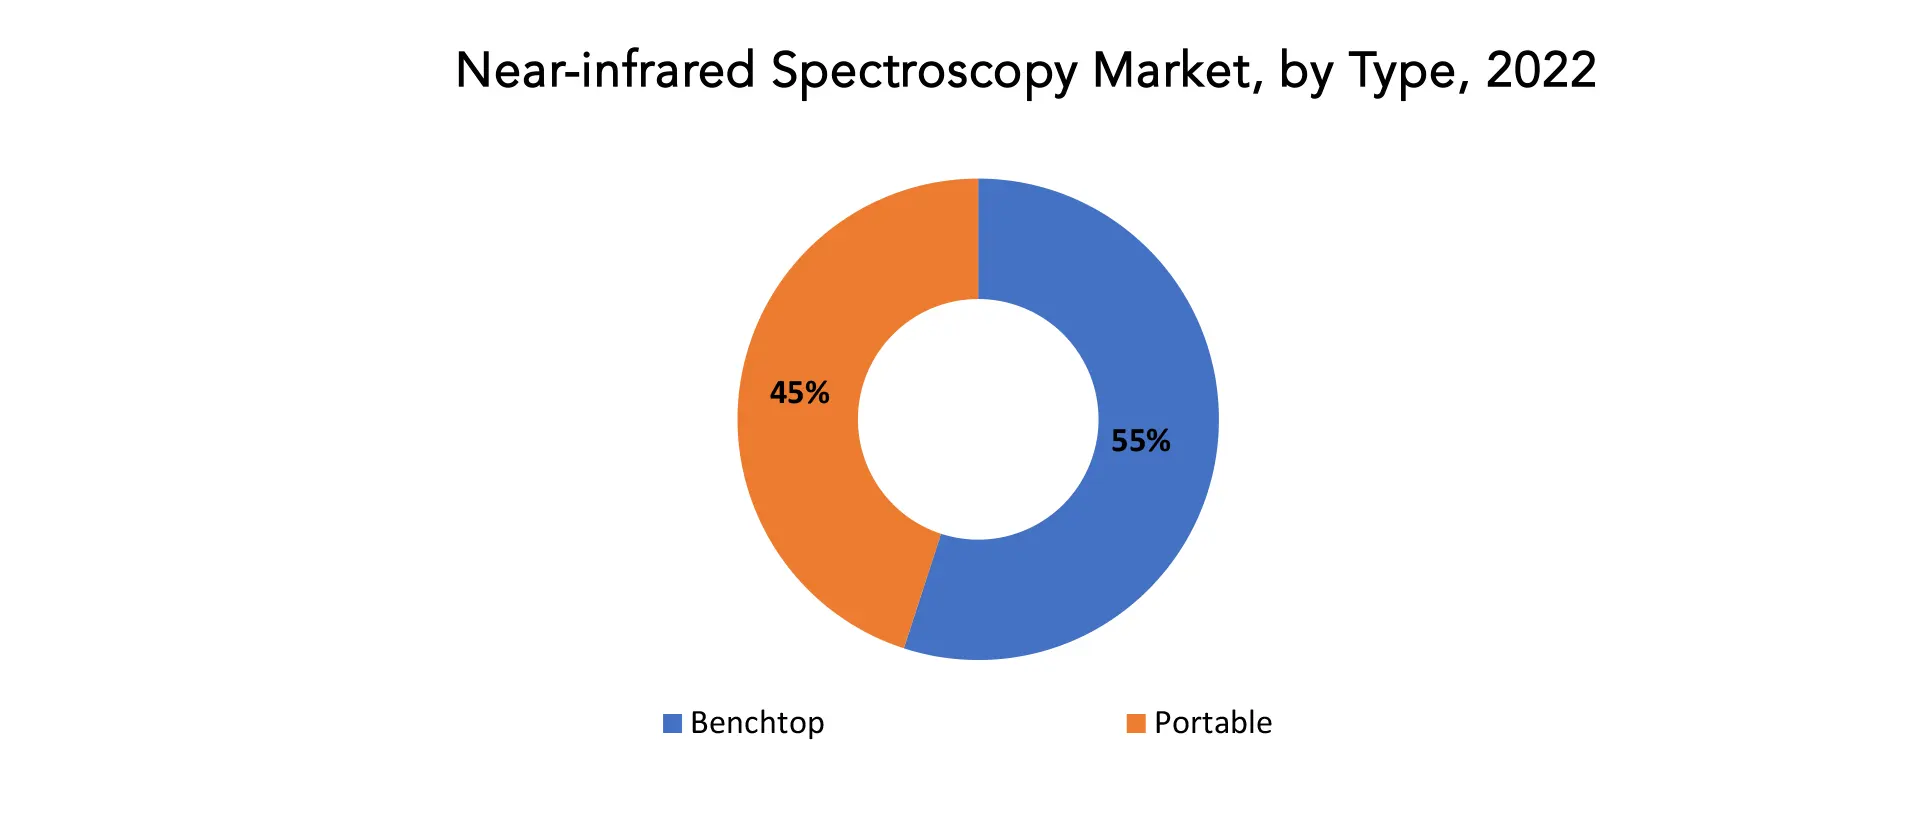
Near-infrared spectroscopy Market Segmentation Analysis
The global near-infrared spectroscopy market is divided into three segments, type, product, application and region. The near-infrared spectroscopy market is classified based on Product, including Dispersive Infrared Spectroscopy, Fourier Transform Based (FT-NIR) Spectrometers. By Types, the market is divided into Benchtop, Portable. By Application the market is classified into Medical Applications, Astronomical Spectroscopy, Remote Monitoring, Agriculture, Particle Measurement, Material Science, Industrial Use. [caption id="attachment_34565" align="aligncenter" width="1920"]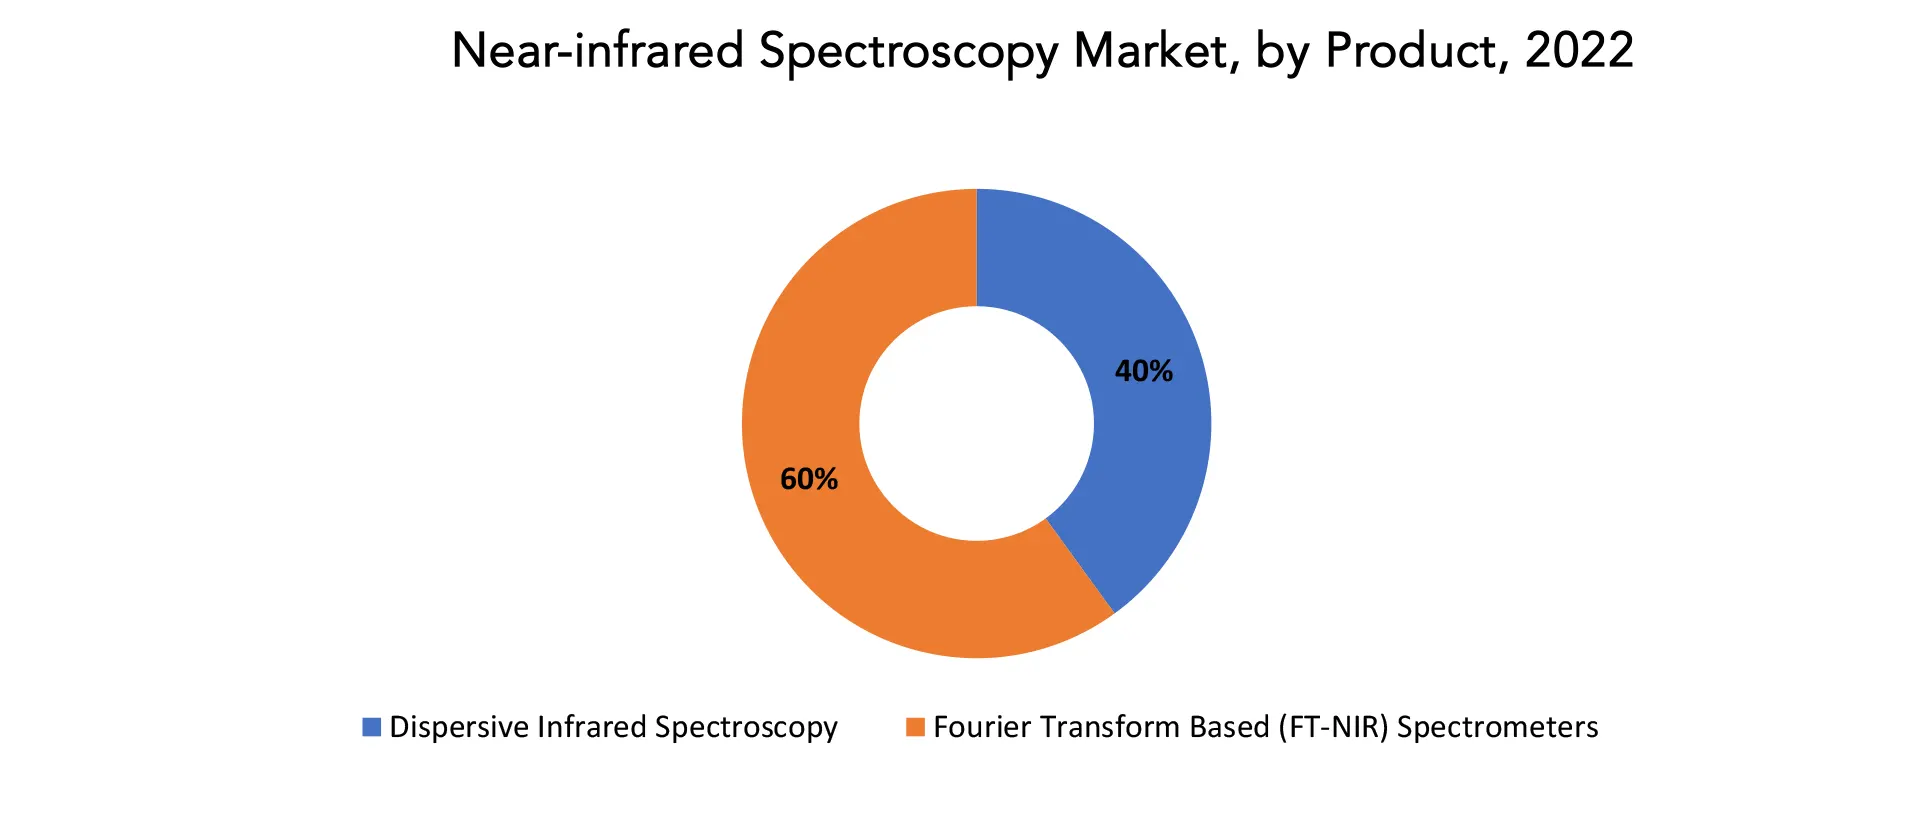
Near-infrared Spectroscopy Market Dynamics
Driver Growing demand for non-destructive testing is driving near-infrared spectroscopy market. Non-destructive testing is crucial for ensuring quality and analyzing materials without causing harm to the samples under examination. In this context, Near-Infrared Spectroscopy (NIRS) stands out as a highly valuable technology, utilizing the near-infrared region of the electromagnetic spectrum to offer a non-invasive and rapid analytical method for studying material compositions. In the pharmaceutical industry, NIRS plays a significant role in guaranteeing the quality and integrity of pharmaceutical products. It enables swift analysis of active pharmaceutical ingredients (APIs) and excipients without compromising the structural or chemical properties of the samples. Similarly, in agriculture, NIRS allows for non-destructive evaluation of crop quality, providing farmers with real-time insights into the nutritional content of crops to make informed decisions about harvesting and storage. Within the food and beverage sector, NIRS functions as a crucial tool for quality control, allowing manufacturers to analyze parameters like moisture content, fat composition, and protein levels without altering the composition of the food products. Furthermore, the chemical industry utilizes NIRS for non-destructive analysis of materials, contributing to process optimization and quality assurance. Restraint High initial cost of NIRS instruments can be a major challenge for the near-infrared spectroscopy market during the forecast period. The significant obstacle presented by the high initial cost of Near-Infrared Spectroscopy (NIRS) instruments is a noteworthy challenge for the market, impacting a range of industries and potential users throughout the forecast period. Acquiring NIRS instruments entails a considerable upfront investment, acting as a deterrent, particularly for small and medium-sized enterprises (SMEs) or organizations with constrained budgets. The overall cost involves not only the purchase of NIRS equipment but also includes associated expenses like installation, training, and maintenance, forming a substantial financial commitment. This financial barrier has the potential to impede the adoption of NIRS technology, especially in sectors where budget constraints are a pivotal consideration. Industries, particularly in emerging economies or smaller enterprises, might be hesitant to invest in NIRS instruments due to the perceived financial burden, despite the evident long-term benefits in terms of non-destructive testing and rapid material analysis. Furthermore, the cost challenge persists beyond the acquisition phase. Ongoing expenses related to instrument maintenance, calibration, and regular updates contribute to the overall total cost of ownership. Although the advantages of NIRS in non-destructive testing are significant, the high initial and ongoing costs could pose limitations to its widespread adoption. Opportunities Integration of NIRS with other technologies create new avenues for near-infrared spectroscopy market. The convergence of Near-Infrared Spectroscopy (NIRS) with cutting-edge technologies is ushering in new opportunities and broadening the scope of the spectroscopy market. These integrations synergistically enhance NIRS capabilities, positioning it as a versatile and robust analytical tool across diverse industries. Notably, the incorporation of Artificial Intelligence (AI) and Machine Learning (ML) algorithms empowers NIRS with advanced data analysis, pattern recognition, and predictive modeling, elevating precision and efficiency in extracting insights from intricate datasets. Furthermore, the fusion of NIRS with Internet of Things (IoT) technology enables real-time monitoring and remote sensing applications. This amalgamation facilitates continuous and automated data collection, transforming NIRS into a dynamic and adaptive tool applicable in agriculture, environmental monitoring, and pharmaceutical manufacturing. The connectivity afforded by IoT enhances the accessibility and usability of NIRS, streamlining data exchange and analysis processes. In addition, the integration of NIRS with imaging technologies like hyperspectral imaging extends its spatial capabilities. This combination enables the simultaneous capture of spectral and spatial information, facilitating detailed imaging and mapping of sample compositions.Near-infrared spectroscopy Market Trends
- Traditional NIRS instruments have been bulky and stationary, limiting their use to laboratory settings. However, advancements in miniaturization and sensor technology have led to the development of portable and handheld NIRS devices.
- AI and ML algorithms are increasingly being incorporated into NIRS technology. These algorithms can analyze large datasets of spectral data, leading to faster and more accurate results, improved data interpretation, and automated analysis workflows.
- Cloud-based platforms are facilitating data storage, sharing, and analysis for NIRS users. This allows for remote access to data, collaboration among researchers, and easier integration with other analytical tools.
- NIRS offers a non-destructive and rapid method for analyzing various materials, making it ideal for quality control and process optimization across industries. This is particularly beneficial in sectors like food & agriculture, pharmaceuticals, and chemicals, where preserving the integrity of samples is crucial.
- NIRS can play a crucial role in monitoring environmental pollution, promoting sustainable agricultural practices, and optimizing resource utilization. This growing focus on sustainability is creating new opportunities for the NIRS market in various industries.
- The increasing demand for quality control and safety measures in developing economies is creating a strong demand for NIRS instruments in these regions. This opens up significant growth opportunities for the global NIRS market.
Competitive Landscape
The competitive landscape of the near-infrared spectroscopy market was dynamic, with several prominent companies competing to provide innovative and advanced Near-infrared spectroscopy solutions.- Bruker Corporation
- PerkinElmer Inc.
- Thermo Fisher Scientific Inc.
- ABB Ltd.
- FOSS AS
- BUCHI Labortechnik AG
- Yokogawa Electric Corporation
- Shimadzu Corporation
- Agilent Technologies Inc.
- Sartorius AG
- Lumex Instruments
- Metrohm AG
- Ocean Insight
- Polytec GmbH
- Viavi Solutions Inc.
- Zeltex LLC
- ZEUTEC
- Avantes BV
- Brainbox Ltd.
- B&W Tek
Regional Analysis
North America accounted for the largest market in the near-infrared spectroscopy market. North America accounted for 40 % market share of the global market value. North America leads the Near-Infrared Spectroscopy (NIRS) market, demonstrating strong growth and dominance on a global scale. The region's preeminence in the NIRS market is attributed to its advanced technological infrastructure and a high level of engagement in research and development activities. This positions North America at the forefront of adopting cutting-edge analytical solutions. Significant contributions from key industry players, research institutions, and academic centers further drive advancements and applications of NIRS across diverse sectors. The United States, in particular, plays a pivotal role in driving the NIRS market forward. The nation's flourishing pharmaceutical and biotechnology industries, coupled with a culture that prioritizes innovation and early technology adoption, play a crucial role in the widespread adoption of NIRS. Collaborations between industry leaders, research institutions, and healthcare organizations in the region actively foster innovation, leading to the continual development of new applications for NIRS. [caption id="attachment_34568" align="aligncenter" width="1920"]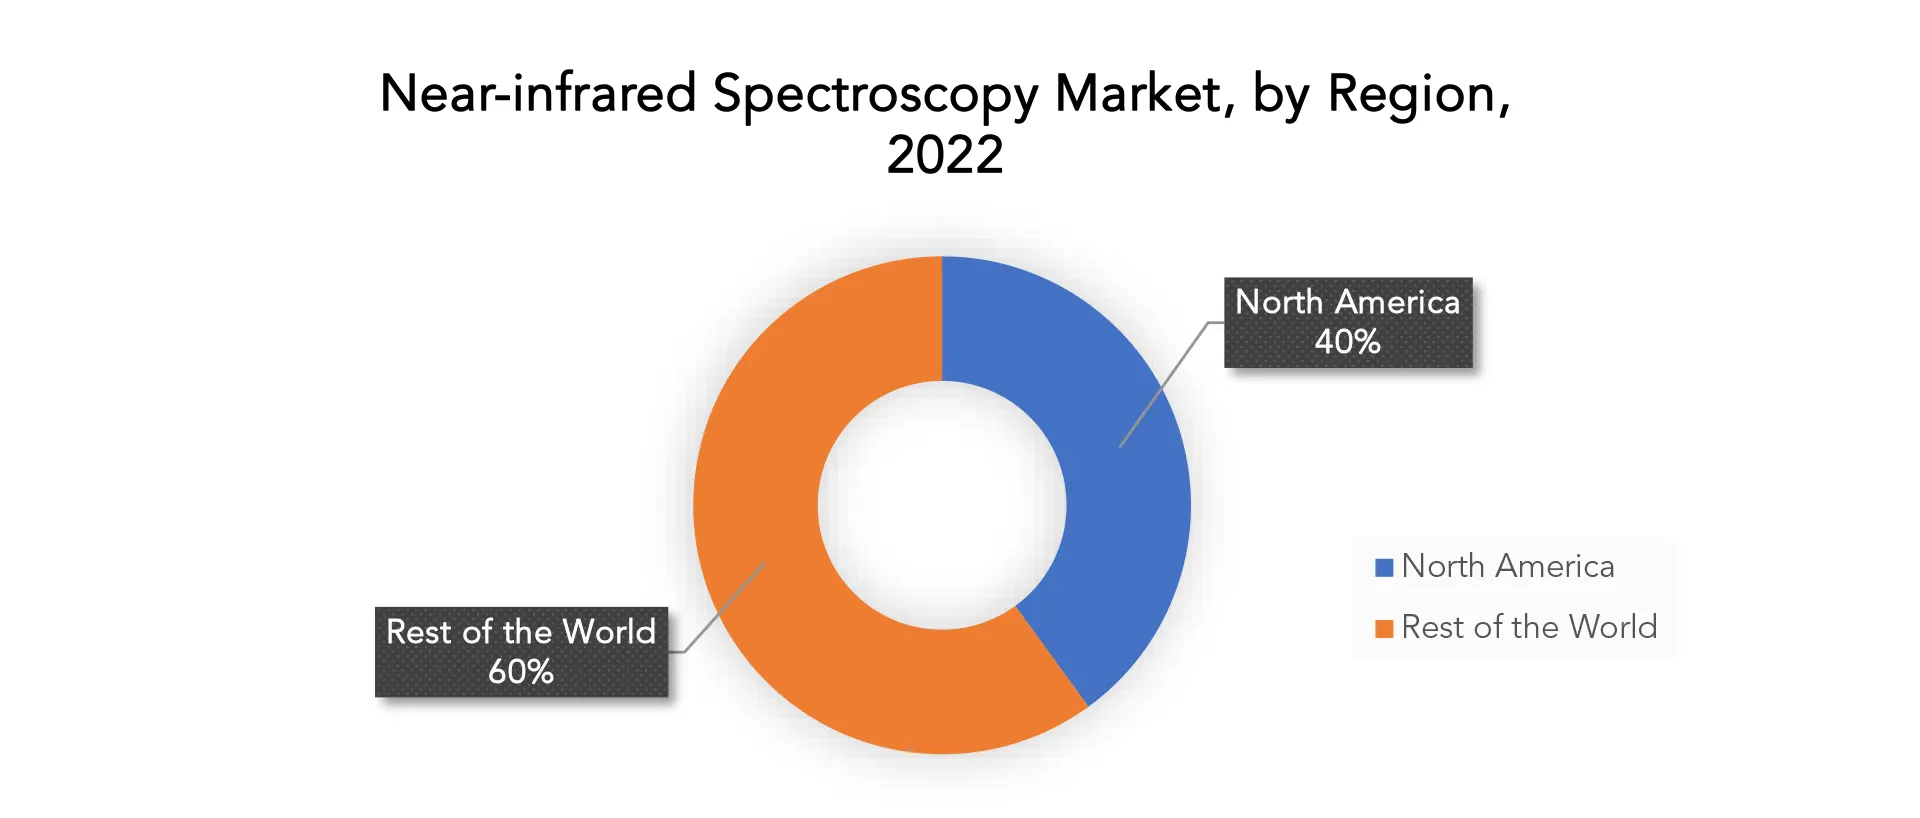
Target Audience for Near-infrared Spectroscopy Market
- Pharmaceutical Companies
- Biotechnology Companies
- Food and Beverage Industry
- Agricultural Sector
- Environmental Monitoring Agencies
- Chemical Industry
- Research Institutions
- Healthcare Institutions
- Quality Control Laboratories
- Government Regulatory Bodies
Import & Export Data for Near-infrared Spectroscopy Market
Exactitude consultancy provides import and export data for the recent years. It also offers insights on production and consumption volume of the product. Understanding the import and export data is pivotal for any player in the Near-infrared spectroscopy market. This knowledge equips businesses with strategic advantages, such as:- Identifying emerging markets with untapped potential.
- Adapting supply chain strategies to optimize cost-efficiency and market responsiveness.
- Navigating competition by assessing major players' trade dynamics.
- Trade volume trends: our report dissects import and export data spanning the last five years to reveal crucial trends and growth patterns within the global Near-infrared spectroscopy market. This data-driven exploration empowers readers with a deep understanding of the market's trajectory.
- Market players: gain insights into the leading players driving the Near-infrared spectroscopy trade. From established giants to emerging contenders, our analysis highlights the key contributors to the import and export landscape.
- Geographical dynamics: delve into the geographical distribution of trade activities. Uncover which regions dominate exports and which ones hold the reins on imports, painting a comprehensive picture of the industry's global footprint.
- Product breakdown: by segmenting data based on Near-infrared spectroscopy types –– we provide a granular view of trade preferences and shifts, enabling businesses to align strategies with the evolving technological landscape.
Segments Covered in the Near-infrared Spectroscopy Market Report
Near-infrared Spectroscopy Market- Dispersive Infrared Spectroscopy
- Fourier Transform Based (FT-NIR) Spectrometers
- Benchtop
- Portable
- Medical Applications
- Astronomical Spectroscopy
- Remote Monitoring
- Agriculture
- Particle Measurement
- Material Science
- Industrial Use
- North America
- Europe
- Asia Pacific
- South America
- Middle East and Africa
Key Question Answered
- What is the expected growth rate of the near-infrared spectroscopy market over the next 7 years?
- Who are the major players in the near-infrared spectroscopy market and what is their market share?
- What are the Application industries driving market demand and what is their outlook?
- What are the opportunities for growth in emerging markets such as Asia-Pacific, the middle east, and Africa?
- How is the economic environment affecting the near-infrared spectroscopy market, including factors such as interest rates, inflation, and exchange rates?
- What is the expected impact of government policies and regulations on the near-infrared spectroscopy market?
- What is the current and forecasted size and growth rate of the global near-infrared spectroscopy market?
- What are the key drivers of growth in the near-infrared spectroscopy market?
- Who are the major players in the market and what is their market share?
- What are the distribution channels and supply chain dynamics in the near-infrared spectroscopy market?
- What are the technological advancements and innovations in the near-infrared spectroscopy market and their impact on product development and growth?
- What are the regulatory considerations and their impact on the market?
- What are the challenges faced by players in the near-infrared spectroscopy market and how are they addressing these challenges?
- What are the opportunities for growth and expansion in the near-infrared spectroscopy market?
- What are the product offerings and specifications of leading players in the market?
- 導入
- 市場の定義
- 市場セグメンテーション
- 研究タイムライン
- 前提と制限
- 研究方法
- データマイニング
- 二次調査
- 一次研究
- 専門家のアドバイス
- 品質チェック
- 最終レビュー
- データ三角測量
- ボトムアップアプローチ
- トップダウンアプローチ
- 研究の流れ
- データソース
- データマイニング
- エグゼクティブサマリー
- 市場概要
- 世界の近赤外線分光法市場の見通し
- 市場の推進要因
- 市場の制約
- 市場機会
- COVID-19による近赤外分光市場への影響
- ポーターの5つの力モデル
- 新規参入からの脅威
- 代替選手からの脅威
- BARGAINING POWER OF SUPPLIERS
- BARGAINING POWER OF CUSTOMERS
- DEGREE OF COMPETITION
- INDUSTRY VALUE CHAIN ANALYSIS
- 世界の近赤外線分光法市場の見通し
- GLOBAL NEAR-INFRARED SPECTROSCOPY MARKET BY PRODUCT, 2020-2030, (USD BILLION) (THOUSAND UNITS)
- DISPERSIVE INFRARED SPECTROSCOPY
- FOURIER TRANSFORM BASED (FT-NIR) SPECTROMETERS
- GLOBAL NEAR-INFRARED SPECTROSCOPY MARKET BY TYPE, 2020-2030, (USD BILLION) (THOUSAND UNITS)
- BENCHTOP
- PORTABLE
- GLOBAL NEAR-INFRARED SPECTROSCOPY MARKET BY APPLICATION, 2020-2030, (USD BILLION) (THOUSAND UNITS)
- MEDICAL APPLICATIONS
- ASTRONOMICAL SPECTROSCOPY
- REMOTE MONITORING
- AGRICULTURE
- PARTICLE MEASUREMENT
- MATERIAL SCIENCE
- INDUSTRIAL USE
- GLOBAL NEAR-INFRARED SPECTROSCOPY MARKET BY REGION, 2020-2030, (USD BILLION) (THOUSAND UNITS)
- NORTH AMERICA
- US
- CANADA
- MEXICO
- SOUTH AMERICA
- BRAZIL
- ARGENTINA
- COLOMBIA
- REST OF SOUTH AMERICA
- EUROPE
- GERMANY
- UK
- FRANCE
- ITALY
- SPAIN
- RUSSIA
- REST OF EUROPE
- ASIA PACIFIC
- INDIA
- CHINA
- JAPAN
- SOUTH KOREA
- AUSTRALIA
- SOUTH-EAST ASIA
- REST OF ASIA PACIFIC
- MIDDLE EAST AND AFRICA
- UAE
- SAUDI ARABIA
- SOUTH AFRICA
- REST OF MIDDLE EAST AND AFRICA
- NORTH AMERICA
- COMPANY PROFILES*
(BUSINESS OVERVIEW, COMPANY SNAPSHOT, PRODUCT OFFERED, RECENT DEVELOPMENTS)
- BRUKER CORPORATION
- PERKINELMER INC.
- THERMO FISHER SCIENTIFIC INC.
- ABB LTD.
- FOSS AS
- BUCHI LABORTECHNIK AG
- YOKOGAWA ELECTRIC CORPORATION
- SHIMADZU CORPORATION
- AGILENT TECHNOLOGIES INC.
- SARTORIUS AG
- LUMEX INSTRUMENTS
- METROHM AG
- OCEAN INSIGHT
- POLYTEC GMBH
- VIAVI SOLUTIONS INC.
- ZELTEX LLC
- ZEUTEC
- AVANTES BV
- BRAINBOX LTD.
- B&W TEK
*THE COMPANY LIST IS INDICATIVE
LIST OF TABLES
TABLE 1 GLOBAL NEAR-INFRARED SPECTROSCOPY MARKET BY PRODUCT (USD BILLION) 2020-2030
TABLE 2 GLOBAL NEAR-INFRARED SPECTROSCOPY MARKET BY PRODUCT (THOUSAND UNITS) 2020-2030
TABLE 3 GLOBAL NEAR-INFRARED SPECTROSCOPY MARKET BY TYPE (USD BILLION) 2020-2030
TABLE 4 GLOBAL NEAR-INFRARED SPECTROSCOPY MARKET BY TYPE (THOUSAND UNITS) 2020-2030
TABLE 5 GLOBAL NEAR-INFRARED SPECTROSCOPY MARKET BY APPLICATION (USD BILLION) 2020-2030
TABLE 6 GLOBAL NEAR-INFRARED SPECTROSCOPY MARKET BY APPLICATION (THOUSAND UNITS) 2020-2030
TABLE 7 GLOBAL NEAR-INFRARED SPECTROSCOPY MARKET BY REGION (USD BILLION) 2020-2030
TABLE 8 GLOBAL NEAR-INFRARED SPECTROSCOPY MARKET BY REGION (THOUSAND UNITS) 2020-2030
TABLE 9 NORTH AMERICA NEAR-INFRARED SPECTROSCOPY MARKET BY COUNTRY (USD BILLION) 2020-2030
TABLE 10 NORTH AMERICA NEAR-INFRARED SPECTROSCOPY MARKET BY COUNTRY (THOUSAND UNITS) 2020-2030
TABLE 11 NORTH AMERICA NEAR-INFRARED SPECTROSCOPY MARKET BY PRODUCT (USD BILLION) 2020-2030
TABLE 12 NORTH AMERICA NEAR-INFRARED SPECTROSCOPY MARKET BY PRODUCT (THOUSAND UNITS) 2020-2030
TABLE 13 NORTH AMERICA NEAR-INFRARED SPECTROSCOPY MARKET BY TYPE (USD BILLION) 2020-2030
TABLE 14 NORTH AMERICA NEAR-INFRARED SPECTROSCOPY MARKET BY TYPE (THOUSAND UNITS) 2020-2030
TABLE 15 NORTH AMERICA NEAR-INFRARED SPECTROSCOPY MARKET BY APPLICATION (USD BILLION) 2020-2030
TABLE 16 NORTH AMERICA NEAR-INFRARED SPECTROSCOPY MARKET BY APPLICATION (THOUSAND UNITS) 2020-2030
TABLE 17 US NEAR-INFRARED SPECTROSCOPY MARKET BY PRODUCT (USD BILLION) 2020-2030
TABLE 18 US NEAR-INFRARED SPECTROSCOPY MARKET BY PRODUCT (THOUSAND UNITS) 2020-2030
TABLE 19 US NEAR-INFRARED SPECTROSCOPY MARKET BY TYPE (USD BILLION) 2020-2030
TABLE 20 US NEAR-INFRARED SPECTROSCOPY MARKET BY TYPE (THOUSAND UNITS) 2020-2030
TABLE 21 US NEAR-INFRARED SPECTROSCOPY MARKET BY APPLICATION (USD BILLION) 2020-2030
TABLE 22 US NEAR-INFRARED SPECTROSCOPY MARKET BY APPLICATION (THOUSAND UNITS) 2020-2030
TABLE 23 CANADA NEAR-INFRARED SPECTROSCOPY MARKET BY PRODUCT (USD BILLION) 2020-2030
TABLE 24 CANADA NEAR-INFRARED SPECTROSCOPY MARKET BY PRODUCT (THOUSAND UNITS) 2020-2030
TABLE 25 CANADA NEAR-INFRARED SPECTROSCOPY MARKET BY TYPE (USD BILLION) 2020-2030
TABLE 26 CANADA NEAR-INFRARED SPECTROSCOPY MARKET BY TYPE (THOUSAND UNITS) 2020-2030
TABLE 27 CANADA NEAR-INFRARED SPECTROSCOPY MARKET BY APPLICATION (USD BILLION) 2020-2030
TABLE 28 CANADA NEAR-INFRARED SPECTROSCOPY MARKET BY APPLICATION (THOUSAND UNITS) 2020-2030
TABLE 29 MEXICO NEAR-INFRARED SPECTROSCOPY MARKET BY PRODUCT (USD BILLION) 2020-2030
TABLE 30 MEXICO NEAR-INFRARED SPECTROSCOPY MARKET BY PRODUCT (THOUSAND UNITS) 2020-2030
TABLE 31 MEXICO NEAR-INFRARED SPECTROSCOPY MARKET BY TYPE (USD BILLION) 2020-2030
TABLE 32 MEXICO NEAR-INFRARED SPECTROSCOPY MARKET BY TYPE (THOUSAND UNITS) 2020-2030
TABLE 33 MEXICO NEAR-INFRARED SPECTROSCOPY MARKET BY APPLICATION (USD BILLION) 2020-2030
TABLE 34 MEXICO NEAR-INFRARED SPECTROSCOPY MARKET BY APPLICATION (THOUSAND UNITS) 2020-2030
TABLE 35 SOUTH AMERICA NEAR-INFRARED SPECTROSCOPY MARKET BY COUNTRY (USD BILLION) 2020-2030
TABLE 36 SOUTH AMERICA NEAR-INFRARED SPECTROSCOPY MARKET BY COUNTRY (THOUSAND UNITS) 2020-2030
TABLE 37 SOUTH AMERICA NEAR-INFRARED SPECTROSCOPY MARKET BY PRODUCT (USD BILLION) 2020-2030
TABLE 38 SOUTH AMERICA NEAR-INFRARED SPECTROSCOPY MARKET BY PRODUCT (THOUSAND UNITS) 2020-2030
TABLE 39 SOUTH AMERICA NEAR-INFRARED SPECTROSCOPY MARKET BY TYPE (USD BILLION) 2020-2030
TABLE 40 SOUTH AMERICA NEAR-INFRARED SPECTROSCOPY MARKET BY TYPE (THOUSAND UNITS) 2020-2030
TABLE 41 SOUTH AMERICA NEAR-INFRARED SPECTROSCOPY MARKET BY APPLICATION (USD BILLION) 2020-2030
TABLE 42 SOUTH AMERICA NEAR-INFRARED SPECTROSCOPY MARKET BY APPLICATION (THOUSAND UNITS) 2020-2030
TABLE 43 BRAZIL NEAR-INFRARED SPECTROSCOPY MARKET BY PRODUCT (USD BILLION) 2020-2030
TABLE 44 BRAZIL NEAR-INFRARED SPECTROSCOPY MARKET BY PRODUCT (THOUSAND UNITS) 2020-2030
TABLE 45 BRAZIL NEAR-INFRARED SPECTROSCOPY MARKET BY TYPE (USD BILLION) 2020-2030
TABLE 46 BRAZIL NEAR-INFRARED SPECTROSCOPY MARKET BY TYPE (THOUSAND UNITS) 2020-2030
TABLE 47 BRAZIL NEAR-INFRARED SPECTROSCOPY MARKET BY APPLICATION (USD BILLION) 2020-2030
TABLE 48 BRAZIL NEAR-INFRARED SPECTROSCOPY MARKET BY APPLICATION (THOUSAND UNITS) 2020-2030
TABLE 49 ARGENTINA NEAR-INFRARED SPECTROSCOPY MARKET BY PRODUCT (USD BILLION) 2020-2030
TABLE 50 ARGENTINA NEAR-INFRARED SPECTROSCOPY MARKET BY PRODUCT (THOUSAND UNITS) 2020-2030
TABLE 51 ARGENTINA NEAR-INFRARED SPECTROSCOPY MARKET BY TYPE (USD BILLION) 2020-2030
TABLE 52 ARGENTINA NEAR-INFRARED SPECTROSCOPY MARKET BY TYPE (THOUSAND UNITS) 2020-2030
TABLE 53 ARGENTINA NEAR-INFRARED SPECTROSCOPY MARKET BY APPLICATION (USD BILLION) 2020-2030
TABLE 54 ARGENTINA NEAR-INFRARED SPECTROSCOPY MARKET BY APPLICATION (THOUSAND UNITS) 2020-2030
TABLE 55 COLOMBIA NEAR-INFRARED SPECTROSCOPY MARKET BY PRODUCT (USD BILLION) 2020-2030
TABLE 56 COLOMBIA NEAR-INFRARED SPECTROSCOPY MARKET BY PRODUCT (THOUSAND UNITS) 2020-2030
TABLE 57 COLOMBIA NEAR-INFRARED SPECTROSCOPY MARKET BY TYPE (USD BILLION) 2020-2030
TABLE 58 COLOMBIA NEAR-INFRARED SPECTROSCOPY MARKET BY TYPE (THOUSAND UNITS) 2020-2030
TABLE 59 COLOMBIA NEAR-INFRARED SPECTROSCOPY MARKET BY APPLICATION (USD BILLION) 2020-2030
TABLE 60 COLOMBIA NEAR-INFRARED SPECTROSCOPY MARKET BY APPLICATION (THOUSAND UNITS) 2020-2030
TABLE 61 REST OF SOUTH AMERICA NEAR-INFRARED SPECTROSCOPY MARKET BY PRODUCT (USD BILLION) 2020-2030
TABLE 62 REST OF SOUTH AMERICA NEAR-INFRARED SPECTROSCOPY MARKET BY PRODUCT (THOUSAND UNITS) 2020-2030
TABLE 63 REST OF SOUTH AMERICA NEAR-INFRARED SPECTROSCOPY MARKET BY TYPE (USD BILLION) 2020-2030
TABLE 64 REST OF SOUTH AMERICA NEAR-INFRARED SPECTROSCOPY MARKET BY TYPE (THOUSAND UNITS) 2020-2030
TABLE 65 REST OF SOUTH AMERICA NEAR-INFRARED SPECTROSCOPY MARKET BY APPLICATION (USD BILLION) 2020-2030
TABLE 66 REST OF SOUTH AMERICA NEAR-INFRARED SPECTROSCOPY MARKET BY APPLICATION (THOUSAND UNITS) 2020-2030
TABLE 67 ASIA-PACIFIC NEAR-INFRARED SPECTROSCOPY MARKET BY COUNTRY (USD BILLION) 2020-2030
TABLE 68 ASIA-PACIFIC NEAR-INFRARED SPECTROSCOPY MARKET BY COUNTRY (THOUSAND UNITS) 2020-2030
TABLE 69 ASIA-PACIFIC NEAR-INFRARED SPECTROSCOPY MARKET BY PRODUCT (USD BILLION) 2020-2030
TABLE 70 ASIA-PACIFIC NEAR-INFRARED SPECTROSCOPY MARKET BY PRODUCT (THOUSAND UNITS) 2020-2030
TABLE 71 ASIA-PACIFIC NEAR-INFRARED SPECTROSCOPY MARKET BY TYPE (USD BILLION) 2020-2030
TABLE 72 ASIA-PACIFIC NEAR-INFRARED SPECTROSCOPY MARKET BY TYPE (THOUSAND UNITS) 2020-2030
TABLE 73 ASIA-PACIFIC NEAR-INFRARED SPECTROSCOPY MARKET BY APPLICATION (USD BILLION) 2020-2030
TABLE 74 ASIA-PACIFIC NEAR-INFRARED SPECTROSCOPY MARKET BY APPLICATION (THOUSAND UNITS) 2020-2030
TABLE 75 INDIA NEAR-INFRARED SPECTROSCOPY MARKET BY PRODUCT (USD BILLION) 2020-2030
TABLE 76 INDIA NEAR-INFRARED SPECTROSCOPY MARKET BY PRODUCT (THOUSAND UNITS) 2020-2030
TABLE 77 INDIA NEAR-INFRARED SPECTROSCOPY MARKET BY TYPE (USD BILLION) 2020-2030
TABLE 78 INDIA NEAR-INFRARED SPECTROSCOPY MARKET BY TYPE (THOUSAND UNITS) 2020-2030
TABLE 79 INDIA NEAR-INFRARED SPECTROSCOPY MARKET BY APPLICATION (USD BILLION) 2020-2030
TABLE 80 INDIA NEAR-INFRARED SPECTROSCOPY MARKET BY APPLICATION (THOUSAND UNITS) 2020-2030
TABLE 81 CHINA NEAR-INFRARED SPECTROSCOPY MARKET BY PRODUCT (USD BILLION) 2020-2030
TABLE 82 CHINA NEAR-INFRARED SPECTROSCOPY MARKET BY PRODUCT (THOUSAND UNITS) 2020-2030
TABLE 83 CHINA NEAR-INFRARED SPECTROSCOPY MARKET BY TYPE (USD BILLION) 2020-2030
TABLE 84 CHINA NEAR-INFRARED SPECTROSCOPY MARKET BY TYPE (THOUSAND UNITS) 2020-2030
TABLE 85 CHINA NEAR-INFRARED SPECTROSCOPY MARKET BY APPLICATION (USD BILLION) 2020-2030
TABLE 86 CHINA NEAR-INFRARED SPECTROSCOPY MARKET BY APPLICATION (THOUSAND UNITS) 2020-2030
TABLE 87 JAPAN NEAR-INFRARED SPECTROSCOPY MARKET BY PRODUCT (USD BILLION) 2020-2030
TABLE 88 JAPAN NEAR-INFRARED SPECTROSCOPY MARKET BY PRODUCT (THOUSAND UNITS) 2020-2030
TABLE 89 JAPAN NEAR-INFRARED SPECTROSCOPY MARKET BY TYPE (USD BILLION) 2020-2030
TABLE 90 JAPAN NEAR-INFRARED SPECTROSCOPY MARKET BY TYPE (THOUSAND UNITS) 2020-2030
TABLE 91 JAPAN NEAR-INFRARED SPECTROSCOPY MARKET BY APPLICATION (USD BILLION) 2020-2030
TABLE 92 JAPAN NEAR-INFRARED SPECTROSCOPY MARKET BY APPLICATION (THOUSAND UNITS) 2020-2030
TABLE 93 SOUTH KOREA NEAR-INFRARED SPECTROSCOPY MARKET BY PRODUCT (USD BILLION) 2020-2030
TABLE 94 SOUTH KOREA NEAR-INFRARED SPECTROSCOPY MARKET BY PRODUCT (THOUSAND UNITS) 2020-2030
TABLE 95 SOUTH KOREA NEAR-INFRARED SPECTROSCOPY MARKET BY TYPE (USD BILLION) 2020-2030
TABLE 96 SOUTH KOREA NEAR-INFRARED SPECTROSCOPY MARKET BY TYPE (THOUSAND UNITS) 2020-2030
TABLE 97 SOUTH KOREA NEAR-INFRARED SPECTROSCOPY MARKET BY APPLICATION (USD BILLION) 2020-2030
TABLE 98 SOUTH KOREA NEAR-INFRARED SPECTROSCOPY MARKET BY APPLICATION (THOUSAND UNITS) 2020-2030
TABLE 99 AUSTRALIA NEAR-INFRARED SPECTROSCOPY MARKET BY PRODUCT (USD BILLION) 2020-2030
TABLE 100 AUSTRALIA NEAR-INFRARED SPECTROSCOPY MARKET BY PRODUCT (THOUSAND UNITS) 2020-2030
TABLE 101 AUSTRALIA NEAR-INFRARED SPECTROSCOPY MARKET BY TYPE (USD BILLION) 2020-2030
TABLE 102 AUSTRALIA NEAR-INFRARED SPECTROSCOPY MARKET BY TYPE (THOUSAND UNITS) 2020-2030
TABLE 103 AUSTRALIA NEAR-INFRARED SPECTROSCOPY MARKET BY APPLICATION (USD BILLION) 2020-2030
TABLE 104 AUSTRALIA NEAR-INFRARED SPECTROSCOPY MARKET BY APPLICATION (THOUSAND UNITS) 2020-2030
TABLE 105 SOUTH-EAST ASIA NEAR-INFRARED SPECTROSCOPY MARKET BY PRODUCT (USD BILLION) 2020-2030
TABLE 106 SOUTH-EAST ASIA NEAR-INFRARED SPECTROSCOPY MARKET BY PRODUCT (THOUSAND UNITS) 2020-2030
TABLE 107 SOUTH-EAST ASIA NEAR-INFRARED SPECTROSCOPY MARKET BY TYPE (USD BILLION) 2020-2030
TABLE 108 SOUTH-EAST ASIA NEAR-INFRARED SPECTROSCOPY MARKET BY TYPE (THOUSAND UNITS) 2020-2030
TABLE 109 SOUTH-EAST ASIA NEAR-INFRARED SPECTROSCOPY MARKET BY APPLICATION (USD BILLION) 2020-2030
TABLE 110 SOUTH-EAST ASIA NEAR-INFRARED SPECTROSCOPY MARKET BY APPLICATION (THOUSAND UNITS) 2020-2030
TABLE 111 REST OF ASIA PACIFIC NEAR-INFRARED SPECTROSCOPY MARKET BY PRODUCT (USD BILLION) 2020-2030
TABLE 112 REST OF ASIA PACIFIC NEAR-INFRARED SPECTROSCOPY MARKET BY PRODUCT (THOUSAND UNITS) 2020-2030
TABLE 113 REST OF ASIA PACIFIC NEAR-INFRARED SPECTROSCOPY MARKET BY TYPE (USD BILLION) 2020-2030
TABLE 114 REST OF ASIA PACIFIC NEAR-INFRARED SPECTROSCOPY MARKET BY TYPE (THOUSAND UNITS) 2020-2030
TABLE 115 REST OF ASIA PACIFIC NEAR-INFRARED SPECTROSCOPY MARKET BY APPLICATION (USD BILLION) 2020-2030
TABLE 116 REST OF ASIA PACIFIC NEAR-INFRARED SPECTROSCOPY MARKET BY APPLICATION (THOUSAND UNITS) 2020-2030
TABLE 117 EUROPE NEAR-INFRARED SPECTROSCOPY MARKET BY COUNTRY (USD BILLION) 2020-2030
TABLE 118 EUROPE NEAR-INFRARED SPECTROSCOPY MARKET BY COUNTRY (THOUSAND UNITS) 2020-2030
TABLE 119 EUROPE NEAR-INFRARED SPECTROSCOPY MARKET BY PRODUCT (USD BILLION) 2020-2030
TABLE 120 EUROPE NEAR-INFRARED SPECTROSCOPY MARKET BY PRODUCT (THOUSAND UNITS) 2020-2030
TABLE 121 EUROPE NEAR-INFRARED SPECTROSCOPY MARKET BY TYPE (USD BILLION) 2020-2030
TABLE 122 EUROPE NEAR-INFRARED SPECTROSCOPY MARKET BY TYPE (THOUSAND UNITS) 2020-2030
TABLE 123 EUROPE NEAR-INFRARED SPECTROSCOPY MARKET BY APPLICATION (USD BILLION) 2020-2030
TABLE 124 EUROPE NEAR-INFRARED SPECTROSCOPY MARKET BY APPLICATION (THOUSAND UNITS) 2020-2030
TABLE 125 GERMANY NEAR-INFRARED SPECTROSCOPY MARKET BY PRODUCT (USD BILLION) 2020-2030
TABLE 126 GERMANY NEAR-INFRARED SPECTROSCOPY MARKET BY PRODUCT (THOUSAND UNITS) 2020-2030
TABLE 127 GERMANY NEAR-INFRARED SPECTROSCOPY MARKET BY TYPE (USD BILLION) 2020-2030
TABLE 128 GERMANY NEAR-INFRARED SPECTROSCOPY MARKET BY TYPE (THOUSAND UNITS) 2020-2030
TABLE 129 GERMANY NEAR-INFRARED SPECTROSCOPY MARKET BY APPLICATION (USD BILLION) 2020-2030
TABLE 130 GERMANY NEAR-INFRARED SPECTROSCOPY MARKET BY APPLICATION (THOUSAND UNITS) 2020-2030
TABLE 131 UK NEAR-INFRARED SPECTROSCOPY MARKET BY PRODUCT (USD BILLION) 2020-2030
TABLE 132 UK NEAR-INFRARED SPECTROSCOPY MARKET BY PRODUCT (THOUSAND UNITS) 2020-2030
TABLE 133 UK NEAR-INFRARED SPECTROSCOPY MARKET BY TYPE (USD BILLION) 2020-2030
TABLE 134 UK NEAR-INFRARED SPECTROSCOPY MARKET BY TYPE (THOUSAND UNITS) 2020-2030
TABLE 135 UK NEAR-INFRARED SPECTROSCOPY MARKET BY APPLICATION (USD BILLION) 2020-2030
TABLE 136 UK NEAR-INFRARED SPECTROSCOPY MARKET BY APPLICATION (THOUSAND UNITS) 2020-2030
TABLE 137 FRANCE NEAR-INFRARED SPECTROSCOPY MARKET BY PRODUCT (USD BILLION) 2020-2030
TABLE 138 FRANCE NEAR-INFRARED SPECTROSCOPY MARKET BY PRODUCT (THOUSAND UNITS) 2020-2030
TABLE 139 FRANCE NEAR-INFRARED SPECTROSCOPY MARKET BY TYPE (USD BILLION) 2020-2030
TABLE 140 FRANCE NEAR-INFRARED SPECTROSCOPY MARKET BY TYPE (THOUSAND UNITS) 2020-2030
TABLE 141 FRANCE NEAR-INFRARED SPECTROSCOPY MARKET BY APPLICATION (USD BILLION) 2020-2030
TABLE 142 FRANCE NEAR-INFRARED SPECTROSCOPY MARKET BY APPLICATION (THOUSAND UNITS) 2020-2030
TABLE 143 ITALY NEAR-INFRARED SPECTROSCOPY MARKET BY PRODUCT (USD BILLION) 2020-2030
TABLE 144 ITALY NEAR-INFRARED SPECTROSCOPY MARKET BY PRODUCT (THOUSAND UNITS) 2020-2030
TABLE 145 ITALY NEAR-INFRARED SPECTROSCOPY MARKET BY TYPE (USD BILLION) 2020-2030
TABLE 146 ITALY NEAR-INFRARED SPECTROSCOPY MARKET BY TYPE (THOUSAND UNITS) 2020-2030
TABLE 147 ITALY NEAR-INFRARED SPECTROSCOPY MARKET BY APPLICATION (USD BILLION) 2020-2030
TABLE 148 ITALY NEAR-INFRARED SPECTROSCOPY MARKET BY APPLICATION (THOUSAND UNITS) 2020-2030
TABLE 149 SPAIN NEAR-INFRARED SPECTROSCOPY MARKET BY PRODUCT (USD BILLION) 2020-2030
TABLE 150 SPAIN NEAR-INFRARED SPECTROSCOPY MARKET BY PRODUCT (THOUSAND UNITS) 2020-2030
TABLE 151 SPAIN NEAR-INFRARED SPECTROSCOPY MARKET BY TYPE (USD BILLION) 2020-2030
TABLE 152 SPAIN NEAR-INFRARED SPECTROSCOPY MARKET BY TYPE (THOUSAND UNITS) 2020-2030
TABLE 153 SPAIN NEAR-INFRARED SPECTROSCOPY MARKET BY APPLICATION (USD BILLION) 2020-2030
TABLE 154 SPAIN NEAR-INFRARED SPECTROSCOPY MARKET BY APPLICATION (THOUSAND UNITS) 2020-2030
TABLE 155 RUSSIA NEAR-INFRARED SPECTROSCOPY MARKET BY PRODUCT (USD BILLION) 2020-2030
TABLE 156 RUSSIA NEAR-INFRARED SPECTROSCOPY MARKET BY PRODUCT (THOUSAND UNITS) 2020-2030
TABLE 157 RUSSIA NEAR-INFRARED SPECTROSCOPY MARKET BY TYPE (USD BILLION) 2020-2030
TABLE 158 RUSSIA NEAR-INFRARED SPECTROSCOPY MARKET BY TYPE (THOUSAND UNITS) 2020-2030
TABLE 159 RUSSIA NEAR-INFRARED SPECTROSCOPY MARKET BY APPLICATION (USD BILLION) 2020-2030
TABLE 160 RUSSIA NEAR-INFRARED SPECTROSCOPY MARKET BY APPLICATION (THOUSAND UNITS) 2020-2030
TABLE 161 REST OF EUROPE NEAR-INFRARED SPECTROSCOPY MARKET BY PRODUCT (USD BILLION) 2020-2030
TABLE 162 REST OF EUROPE NEAR-INFRARED SPECTROSCOPY MARKET BY PRODUCT (THOUSAND UNITS) 2020-2030
TABLE 163 REST OF EUROPE NEAR-INFRARED SPECTROSCOPY MARKET BY TYPE (USD BILLION) 2020-2030
TABLE 164 REST OF EUROPE NEAR-INFRARED SPECTROSCOPY MARKET BY TYPE (THOUSAND UNITS) 2020-2030
TABLE 165 REST OF EUROPE NEAR-INFRARED SPECTROSCOPY MARKET BY APPLICATION (USD BILLION) 2020-2030
TABLE 166 REST OF EUROPE NEAR-INFRARED SPECTROSCOPY MARKET BY APPLICATION (THOUSAND UNITS) 2020-2030
TABLE 167 MIDDLE EAST AND AFRICA NEAR-INFRARED SPECTROSCOPY MARKET BY COUNTRY (USD BILLION) 2020-2030
TABLE 168 MIDDLE EAST AND AFRICA NEAR-INFRARED SPECTROSCOPY MARKET BY COUNTRY (THOUSAND UNITS) 2020-2030
TABLE 169 MIDDLE EAST AND AFRICA NEAR-INFRARED SPECTROSCOPY MARKET BY PRODUCT (USD BILLION) 2020-2030
TABLE 170 MIDDLE EAST AND AFRICA NEAR-INFRARED SPECTROSCOPY MARKET BY PRODUCT (THOUSAND UNITS) 2020-2030
TABLE 171 MIDDLE EAST AND AFRICA NEAR-INFRARED SPECTROSCOPY MARKET BY TYPE (USD BILLION) 2020-2030
TABLE 172 MIDDLE EAST AND AFRICA NEAR-INFRARED SPECTROSCOPY MARKET BY TYPE (THOUSAND UNITS) 2020-2030
TABLE 173 MIDDLE EAST AND AFRICA NEAR-INFRARED SPECTROSCOPY MARKET BY APPLICATION (USD BILLION) 2020-2030
TABLE 174 MIDDLE EAST AND AFRICA NEAR-INFRARED SPECTROSCOPY MARKET BY APPLICATION (THOUSAND UNITS) 2020-2030
TABLE 175 UAE NEAR-INFRARED SPECTROSCOPY MARKET BY PRODUCT (USD BILLION) 2020-2030
TABLE 176 UAE NEAR-INFRARED SPECTROSCOPY MARKET BY PRODUCT (THOUSAND UNITS) 2020-2030
TABLE 177 UAE NEAR-INFRARED SPECTROSCOPY MARKET BY TYPE (USD BILLION) 2020-2030
TABLE 178 UAE NEAR-INFRARED SPECTROSCOPY MARKET BY TYPE (THOUSAND UNITS) 2020-2030
TABLE 179 UAE NEAR-INFRARED SPECTROSCOPY MARKET BY APPLICATION (USD BILLION) 2020-2030
TABLE 180 UAE NEAR-INFRARED SPECTROSCOPY MARKET BY APPLICATION (THOUSAND UNITS) 2020-2030
TABLE 181 SAUDI ARABIA NEAR-INFRARED SPECTROSCOPY MARKET BY PRODUCT (USD BILLION) 2020-2030
TABLE 182 SAUDI ARABIA NEAR-INFRARED SPECTROSCOPY MARKET BY PRODUCT (THOUSAND UNITS) 2020-2030
TABLE 183 SAUDI ARABIA NEAR-INFRARED SPECTROSCOPY MARKET BY TYPE (USD BILLION) 2020-2030
TABLE 184 SAUDI ARABIA NEAR-INFRARED SPECTROSCOPY MARKET BY TYPE (THOUSAND UNITS) 2020-2030
TABLE 185 SAUDI ARABIA NEAR-INFRARED SPECTROSCOPY MARKET BY APPLICATION (USD BILLION) 2020-2030
TABLE 186 SAUDI ARABIA NEAR-INFRARED SPECTROSCOPY MARKET BY APPLICATION (THOUSAND UNITS) 2020-2030
TABLE 187 SOUTH AFRICA NEAR-INFRARED SPECTROSCOPY MARKET BY PRODUCT (USD BILLION) 2020-2030
TABLE 188 SOUTH AFRICA NEAR-INFRARED SPECTROSCOPY MARKET BY PRODUCT (THOUSAND UNITS) 2020-2030
TABLE 189 SOUTH AFRICA NEAR-INFRARED SPECTROSCOPY MARKET BY TYPE (USD BILLION) 2020-2030
TABLE 190 SOUTH AFRICA NEAR-INFRARED SPECTROSCOPY MARKET BY TYPE (THOUSAND UNITS) 2020-2030
TABLE 191 SOUTH AFRICA NEAR-INFRARED SPECTROSCOPY MARKET BY APPLICATION (USD BILLION) 2020-2030
TABLE 192 SOUTH AFRICA NEAR-INFRARED SPECTROSCOPY MARKET BY APPLICATION (THOUSAND UNITS) 2020-2030
TABLE 193 REST OF MIDDLE EAST AND AFRICA NEAR-INFRARED SPECTROSCOPY MARKET BY PRODUCT (USD BILLION) 2020-2030
TABLE 194 REST OF MIDDLE EAST AND AFRICA NEAR-INFRARED SPECTROSCOPY MARKET BY PRODUCT (THOUSAND UNITS) 2020-2030
TABLE 195 REST OF MIDDLE EAST AND AFRICA NEAR-INFRARED SPECTROSCOPY MARKET BY TYPE (USD BILLION) 2020-2030
TABLE 196 REST OF MIDDLE EAST AND AFRICA NEAR-INFRARED SPECTROSCOPY MARKET BY TYPE (THOUSAND UNITS) 2020-2030
TABLE 197 REST OF MIDDLE EAST AND AFRICA NEAR-INFRARED SPECTROSCOPY MARKET BY APPLICATION (USD BILLION) 2020-2030
TABLE 198 REST OF MIDDLE EAST AND AFRICA NEAR-INFRARED SPECTROSCOPY MARKET BY APPLICATION (THOUSAND UNITS) 2020-2030
LIST OF FIGURES
FIGURE 1 MARKET DYNAMICS
FIGURE 2 MARKET SEGMENTATION
FIGURE 3 REPORT TIMELINES: YEARS CONSIDERED
FIGURE 4 DATA TRIANGULATION
FIGURE 5 BOTTOM-UP APPROACH
FIGURE 6 TOP-DOWN APPROACH
FIGURE 7 RESEARCH FLOW
FIGURE 8 GLOBAL NEAR-INFRARED SPECTROSCOPY MARKET BY PRODUCT (USD BILLION), 2020-2030
FIGURE 9 GLOBAL NEAR-INFRARED SPECTROSCOPY MARKET BY TYPE (USD BILLION), 2020-2030
FIGURE 10 GLOBAL NEAR-INFRARED SPECTROSCOPY MARKET BY APPLICATION (USD BILLION), 2020-2030
FIGURE 11 GLOBAL NEAR-INFRARED SPECTROSCOPY MARKET BY REGION (USD BILLION), 2020-2030
FIGURE 12 PORTER’S FIVE FORCES MODEL
FIGURE 13 GLOBAL NEAR-INFRARED SPECTROSCOPY MARKET BY PRODUCT (USD BILLION), 2022
FIGURE 14 GLOBAL NEAR-INFRARED SPECTROSCOPY MARKET BY TYPE (USD BILLION), 2022
FIGURE 15 GLOBAL NEAR-INFRARED SPECTROSCOPY MARKET BY APPLICATION (USD BILLION), 2022
FIGURE 16 GLOBAL NEAR-INFRARED SPECTROSCOPY MARKET BY REGION (USD BILLION), 2022
FIGURE 17 MARKET SHARE ANALYSIS
FIGURE 18 BRUKER CORPORATION: COMPANY SNAPSHOT
FIGURE 19 PERKINELMER INC.: COMPANY SNAPSHOT
FIGURE 20 THERMO FISHER SCIENTIFIC INC.: COMPANY SNAPSHOT
FIGURE 21 ABB LTD.: COMPANY SNAPSHOT
FIGURE 22 FOSS AS: COMPANY SNAPSHOT
FIGURE 23 BUCHI LABORTECHNIK AG: COMPANY SNAPSHOT
FIGURE 24 YOKOGAWA ELECTRIC CORPORATION: COMPANY SNAPSHOT
FIGURE 25 SHIMADZU CORPORATION: COMPANY SNAPSHOT
FIGURE 26 AGILENT TECHNOLOGIES INC.: COMPANY SNAPSHOT
FIGURE 27 SARTORIUS AG: COMPANY SNAPSHOT
FIGURE 28 LUMEX INSTRUMENTS: COMPANY SNAPSHOT
FIGURE 29 METROHM AG: COMPANY SNAPSHOT
FIGURE 30 OCEAN INSIGHT: COMPANY SNAPSHOT
FIGURE 31 POLYTEC GMBH: COMPANY SNAPSHOT
FIGURE 32 VIAVI SOLUTIONS INC.: COMPANY SNAPSHOT
FIGURE 33 ZELTEX LLC: COMPANY SNAPSHOT
FIGURE 34 ZEUTEC: COMPANY SNAPSHOT
FIGURE 35 AVANTES BV: COMPANY SNAPSHOT
FIGURE 36 BRAINBOX LTD.: COMPANY SNAPSHOT
FIGURE 37 B&W TEK: COMPANY SNAPSHOT
DOWNLOAD FREE SAMPLE REPORT
License Type
SPEAK WITH OUR ANALYST
Want to know more about the report or any specific requirement?
WANT TO CUSTOMIZE THE REPORT?
Our Clients Speak
We asked them to research ‘ Equipment market’ all over the world, and their whole arrangement was helpful to us. thehealthanalytics.com insightful analysis and reports contributed to our current analysis and in creating a future strategy. Besides, the te
Yosuke Mitsui
Senior Associate Construction Equipment Sales & Marketing
We asked them to research ‘Equipment market’ all over the world, and their whole arrangement was helpful to us. thehealthanalytics.com insightful analysis and reports contributed to our current analysis and in creating a future strategy. Besides, the te


