

Base Year Value ()
x.x %
x.x %
CAGR ()
x.x %
x.x %
Forecast Year Value ()
x.x %
x.x %
Historical Data Period
Largest Region
Forecast Period
ビデオ仮想化市場、製品別(タイプ I、タイプ II、タイプ III、タイプ IV)、アプリケーション別(アプリケーション I、アプリケーション II、アプリケーション III、アプリケーション IV)および地域別、2024 年から 2030 年までの世界的な傾向と予測
Instant access to hundreds of data points and trends
- Market estimates from 2014-2029
- Competitive analysis, industry segmentation, financial benchmarks
- Incorporates SWOT, Porter's Five Forces and risk management frameworks
- PDF report or online database with Word, Excel and PowerPoint export options
- 100% money back guarantee
ビデオ仮想化市場の概要
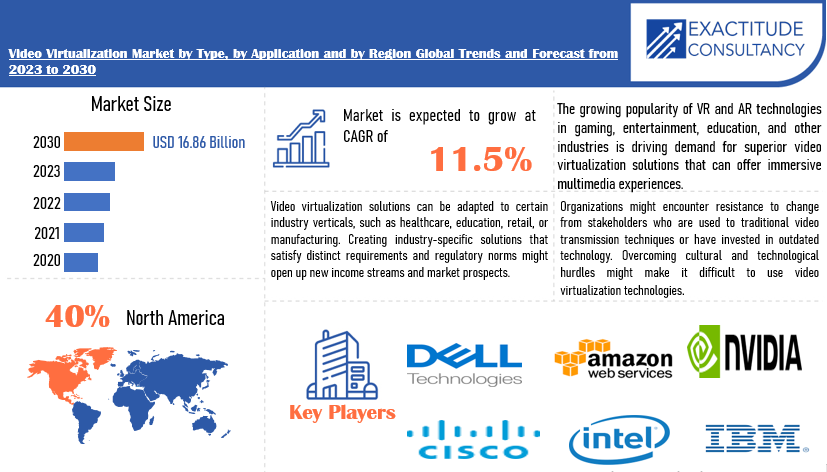
世界のビデオ仮想化市場規模は、2023 年の 78.7 億米ドルから 2030 年には 168.6 億米ドルに拡大し、予測期間中に 11.5% の CAGR を示すことが予測されています。
ビデオ仮想化では、ビデオ リソースを物理インフラストラクチャから抽象化し、仮想化された設定内でレンダリングします。サーバー仮想化でサーバー ハードウェアを抽象化して仮想マシンを作成するのと同様に、ビデオ仮想化ではカメラやエンコーダーなどのビデオ ハードウェア コンポーネントを抽象化して、仮想化されたビデオ フレームワークを確立します。このアプローチにより、ビデオ コンテンツの管理と配信の柔軟性、拡張性、効率性が向上します。リソースを動的に割り当て、負荷を分散し、ビデオ アセットを集中管理することで、仮想化によってリソースの使用率が最適化され、全体的なパフォーマンスが向上します。ストリーミング サービス、ビデオ監視システム、ビデオ会議プラットフォームなど、さまざまな環境で大量のビデオ コンテンツを管理および配信する必要があるシナリオでは、特に効果的です。
[キャプション id="attachment_40039" align="aligncenter" width="827"]
Video virtualization is of paramount importance as it transforms the landscape of video content management and delivery. By abstracting video resources from their physical setups and embedding them within a virtualized realm, video virtualization offers numerous benefits. Firstly, it provides heightened flexibility by dynamically allocating resources according to demand, thereby optimizing scalability and resource usage. Secondly, it facilitates centralized management, streamlining the control and oversight of video assets across various environments. This centralized approach enhances operational efficiency and simplifies administrative tasks. Moreover, video virtualization supports load balancing, ensuring optimal performance and reliability in video distribution. Additionally, it promotes cost-effectiveness by diminishing the necessity for extensive physical hardware setups and enabling more efficient resource distribution. In essence, video virtualization is indispensable for contemporary applications like streaming services, video surveillance systems, and video conferencing platforms, enabling them to meet escalating demands for scalability, flexibility, and efficiency in managing and disseminating video content.
| ATTRIBUTE | DETAILS |
| Study period | 2020-2030 |
| Base year | 2022 |
| Estimated year | 2023 |
| Forecasted year | 2023-2030 |
| Historical period | 2019-2021 |
| Unit | Value (USD Billion) |
| Segmentation | By Type, Application and Region |
| By Type |
|
| By Application |
|
| By Region |
|
Frequently Asked Questions
• What is the market size for the Video Virtualization market?
The global video virtualization market size is projected to grow from USD 7.87 billion in 2023 to USD 16.86 billion by 2030, exhibiting a CAGR of 11.5% during the forecast period.
• Which region is dominating in the Video Virtualization market?
North America accounted for the largest market in the video virtualization market.
• Who are the major key players in the Video Virtualization market?
Amazon Web Services (AWS),Arista Networks, Brightcove Inc., Cisco Systems, Citrix Systems, Dell Technologies, Google LLC, Hewlett Packard Enterprise (HPE),Huawei Technologies, IBM, Intel Corporation and Others.
• What are the key trends in the Video Virtualization market?
Video virtualization solutions are being adopted across various industries, including media and entertainment, healthcare, education, retail, and manufacturing. These industries are leveraging video virtualization to improve communication, enhance customer engagement, optimize operational workflows, and enable innovative use cases such as virtual events and remote diagnostics.
Video Virtualization Market Segmentation Analysis
The global video virtualization market is bifurcated into two segments, by type, by application and region. By type, the market is divided into Type I, Type II, Type III, Type IV. By application, the market is bifurcated into Application I, Application II, Application III, Application IV and region.
[caption id="attachment_40042" align="aligncenter" width="500"]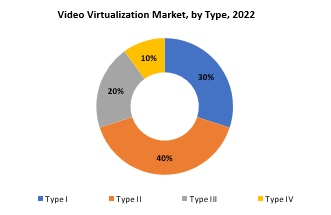
The video virtualization market offers a range of product types tailored to diverse cleaning requirements and preferences. These include canister, central, drum, robotic, upright, and wet & dry Video Virtualizations. Canister Video Virtualizations consist of a separate unit housing the motor and dust collection system, connected to a flexible hose and cleaning head, providing maneuverability and versatility. Central vacuum systems are integrated into the building structure, with tubing installed in walls connecting to a central unit typically located in a garage or utility room, offering convenient whole-house cleaning with minimal noise and upkeep. Drum Video Virtualizations, also known as shop vacuums, are engineered for heavy-duty use in industrial and workshop environments, capable of handling substantial volumes of debris and liquids. Robotic Video Virtualizations, equipped with sensors and intelligent navigation technology, autonomously navigate and clean floors, offering hands-free convenience for busy households. Upright Video Virtualizations feature a vertical design with the motor, dust collection, and cleaning head integrated into a single unit, providing efficient cleaning for carpets and large areas with convenient storage. Wet & dry Video Virtualizations are versatile machines capable of suctioning both dry debris and liquids, making them well suited for cleaning spills, wet surfaces, and various types of messes. Each Video Virtualization type offers distinct features and benefits to cater to the diverse needs of consumers, enhancing the efficiency and effectiveness of household and commercial cleaning tasks.
[caption id="attachment_40043" align="aligncenter" width="490"]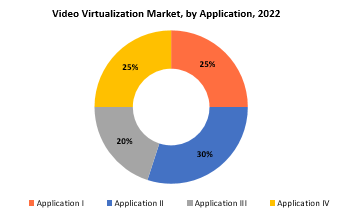
In market segmentation by application, the market undergoes division into distinct segments based on the specific uses or purposes of the products or services provided. This strategy enables businesses to better target varying customer needs and preferences. For instance, in a technology market, Application I might involve software solutions tailored for accounting tasks, while Application II could focus on customer relationship management (CRM) tools. Likewise, Application III might encompass software designed for human resource management (HRM), and Application IV may pertain to project management software. By categorizing the market in this manner, companies can customize their offerings to meet the specific requirements of each application segment, thereby enhancing their appeal and relevance to customers. This segmentation approach enables businesses to gain deeper insights into and effectively address the diverse needs and preferences of their target audience, leading to more successful marketing strategies, product development endeavors, and overall business performance.
[caption id="attachment_40045" align="aligncenter" width="538"]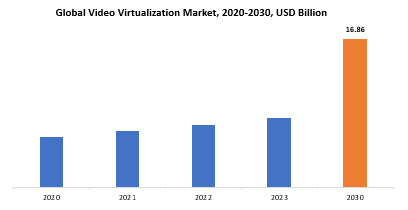
Video Virtualization Market Dynamics
DriverThe rising consumer demand for high-definition and ultra-high-definition video content, coupled with the proliferation of streaming services, is driving the need for efficient video virtualization solutions.
The escalating desire for high-quality video streaming is being propelled by various factors, chiefly the surge in consumer expectations for immersive and visually captivating content experiences. With advancements in display technology and the widespread availability of high-speed internet connections, consumers now anticipate accessing content in high-definition (HD) and ultra-high-definition (UHD) resolutions. Concurrently, the proliferation of streaming services across entertainment, gaming, education, and more has broadened the spectrum of content available to consumers. This abundance of content, coupled with the convenience of on-demand access provided by streaming platforms, has further fueled the appetite for high-quality video experiences. However, fulfilling this demand for superior video quality poses significant challenges for content providers and streaming platforms alike. Conventional video delivery infrastructures often struggle to manage the bandwidth requirements and scalability demands associated with HD and UHD content streaming across diverse devices and screen sizes. This is where efficient video virtualization solutions become indispensable. By harnessing virtualization technologies, content providers can optimize video delivery workflows, dynamically allocate resources, and adjust to fluctuations in demand. Virtualization enables the efficient utilization of hardware resources, facilitates content caching, and optimizes delivery to ensure seamless scalability to cater to spikes in viewership without compromising video quality or performance.
Furthermore, video virtualization solutions can help alleviate the complexities of delivering high-quality video content across varied networks and devices. They enable adaptive bitrate streaming, real-time transcoding, and content optimization techniques to guarantee optimal viewing experiences, regardless of the viewer's device or network conditions. In summary, the growing demand for high-quality video streaming necessitates the adoption of efficient video virtualization solutions. These solutions not only meet consumer expectations for superior content experiences but also empower content providers and streaming platforms to scale effectively, optimize resource utilization, and deliver compelling content offerings in an increasingly competitive landscape.
RestraintCompatibility issues and interoperability challenges may further hinder deployment efforts.
The integration and deployment of video virtualization solutions present complexities stemming from the necessity to seamlessly merge these advanced technologies into current infrastructure and applications. This process can be intricate and time-consuming due to several factors. Firstly, organizations typically navigate complex IT ecosystems consisting of diverse hardware and software components. Integrating video virtualization solutions into this existing framework requires meticulous planning and coordination to ensure compatibility and prevent disruptions to ongoing operations. Furthermore, compatibility issues between different software versions or hardware configurations can pose significant challenges during integration. Ensuring the alignment of the video virtualization solution with existing systems and workflows, without causing conflicts or performance issues, necessitates thorough testing and validation procedures. Interoperability challenges further complicate the integration process, particularly when dealing with disparate systems or proprietary technologies. Facilitating seamless communication and data exchange between various components requires robust interoperability standards and protocols.
Additionally, deploying video virtualization solutions often involves multiple stakeholders across different departments or organizational units. Coordinating these efforts, addressing divergent requirements, and achieving consensus on implementation strategies can extend the deployment timeline and introduce additional complexity. Moreover, the dynamic nature of technology landscapes requires ongoing updates and maintenance to keep video virtualization solutions aligned with evolving business needs and technological advancements. Managing this continuous lifecycle adds another layer of complexity to the deployment process.
OpportunitiesThe continued expansion of OTT services, including subscription-based streaming platforms, presents significant opportunities for video virtualization providers.
The rapid growth of Over-The-Top (OTT) services, characterized by the proliferation of subscription-based streaming platforms and other digital content providers, has opened significant avenues for video virtualization providers. As the OTT landscape continues to expand, providers increasingly seek inventive solutions to distinguish their offerings, enhance user engagement, and capitalize on monetization opportunities. OTT services have revolutionized content consumption, providing on-demand access to a vast array of video content across various genres and formats. This shift in consumer behavior has fueled a heightened demand for advanced video delivery and management solutions capable of meeting the evolving needs of both content providers and viewers.
For video virtualization providers, the burgeoning OTT market presents fertile ground for growth and innovation. By offering scalable and adaptable video virtualization solutions, providers empower OTT platforms to deliver seamless streaming experiences to users across different devices and networks. These solutions optimize content delivery, elevate video quality, and ensure smooth playback, thereby enhancing user satisfaction and retention. Furthermore, OTT providers are constantly exploring ways to stand out in a crowded marketplace. Video virtualization solutions play a pivotal role here by enabling the customization and personalization of the viewing experience. Leveraging virtualization technologies, OTT platforms can deliver targeted content recommendations, interactive features, and personalized advertising, thereby boosting user engagement and loyalty. Moreover, the expansion of OTT services has unlocked new revenue streams. OTT providers are exploring various monetization avenues, including subscription models, advertising, pay-per-view, and premium content offerings. Video virtualization providers can collaborate with OTT platforms to effectively implement monetization strategies such as dynamic ad insertion, content monetization, and audience analytics, thereby maximizing revenue potential.
Video Virtualization Market Trends
-
Cloud-based video virtualization solutions are increasingly preferred due to their scalability, flexibility, and cost-effectiveness. Businesses are adopting cloud infrastructure to deploy and manage virtualized video resources more efficiently.
-
Video virtualization platforms are incorporating AI and ML technologies to enhance functionalities such as content analysis, metadata tagging, and automated content recognition. These advancements enable smarter video processing, indexing, and retrieval, enhancing overall efficiency and user experience.
-
Software-defined video infrastructure (SDVI) solutions are gaining traction, enabling organizations to virtualize and orchestrate video processing functions using software-based architectures.
-
There is a heightened focus on implementing robust security measures within video virtualization platforms, including encryption, digital rights management (DRM), watermarking, and access control mechanisms.
-
Edge computing technologies are being leveraged for video processing tasks at the network edge, leading to reduced latency, enhanced real-time processing capabilities, and minimized bandwidth usage.
-
Efforts are underway to standardize video virtualization technologies and ensure interoperability among different platforms and vendors. Standards such as SMPTE ST 2110 and JT-NM TR-1001 are facilitating seamless integration and compatibility, simplifying the deployment and operation of video virtualization solutions.
Competitive Landscape
The competitive landscape of the video virtualization market was dynamic, with several prominent companies competing to provide innovative and advanced video virtualization solutions.
- Amazon Web Services (AWS)
- Arista Networks
- Bright cove Inc.
- Cisco Systems
- Citrix Systems
- Dell Technologies
- Google LLC
- Hewlett Packard Enterprise
- Huawei Technologies
- IBM
- Intel Corporation
- Juniper Networks
- Kaltura Inc.
- Microsoft Corporation
- NVIDIA Corporation
- Oracle Corporation
- Poly (formerly Polycom)
- Red Hat, Inc.
- VMware
- Zoom Video Communications
February 21, 2024 — Dell Technologies announces new solutions to help communications service providers (CSPs) facilitate network cloud and operations transformation to achieve improved economics and agility, while maintaining network reliability.
February 22, 2024 -- du, formerly Emirates Integrated Telecommunications Company (EITC), and Huawei have announced the successful completion of the world's first high-performance 800G in Super C+L band over OptiX OSN 9800 Kepler and M Platform. The new enhancement will further improve customer experience for using high-speed 5G mobile and broadband home services.
Regional Analysis
The dominating region in the video virtualization market shifts dependent on technology improvements, industry maturity, infrastructure development, and adoption rates. North America is currently emerging as a dominant competitor in this space. Several reasons contribute to this leadership, including the presence of big technological corporations, significant expenditures in research and development, strong internet infrastructure, and broad use of modern technologies across several industries. Furthermore, North America has a high need for video streaming services, video conferencing solutions, and virtualized video infrastructure, notably in media, healthcare, education, and corporate sectors.
[caption id="attachment_40051" align="aligncenter" width="485"]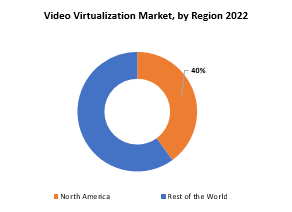
Furthermore, the region benefits from a favorable regulatory environment, supportive government initiatives, and a large base of tech-savvy consumers. While North America leads in market share and innovation, other regions like Europe and Asia-Pacific are experiencing rapid growth propelled by increasing internet penetration, growing demand for digital content, and the adoption of cloud-based technologies. Nevertheless, North America's early adoption, robust ecosystem, and technological prowess position it as the dominant force in the global video virtualization market.
Target Audience for Video Virtualization Market
- Healthcare organizations (e.g., hospitals, clinics)
- Government agencies and public sector organizations
- Retailers and e-commerce companies
- Event management companies
- Security and surveillance firms
- Manufacturing industries
Segments Covered in the Video Virtualization Market Report
Video Virtualization Market by Type- Type I
- Type II
- Type III
- Type IV
- Application I
- Application II
- Application III
- Application IV
- North America
- Europe
- Asia Pacific
- South America
- Middle East and Africa
Key Question Answered
- What is the expected growth rate of the Video Virtualization market over the next 7 years?
- Who are the key market participants in Video Virtualization, and what are their market share?
- What are the end-user industries driving market demand and what is their outlook?
- What are the opportunities for growth in emerging markets such as Asia-Pacific, the Middle East, and Africa?
- How is the economic environment affecting the Video Virtualization market, including factors such as interest rates, inflation, and exchange rates?
- What is the expected impact of government policies and regulations on the Video Virtualization market?
- What is the current and forecasted size and growth rate of the global Video Virtualization market?
- What are the key drivers of growth in the Video Virtualization market?
- Who are the major players in the market and what is their market share?
- What are the distribution channels and supply chain dynamics in the Video Virtualization market?
- What are the technological advancements and innovations in the Video Virtualization market and their impact on product development and growth?
- What are the regulatory considerations and their impact on the market?
- What are the challenges faced by players in the Video Virtualization market and how are they addressing these challenges?
- What are the opportunities for growth and expansion in the Video Virtualization market?
- What are the product offerings and specifications of leading players in the market?
- INTRODUCTION
- MARKET DEFINITION
- MARKET SEGMENTATION
- RESEARCH TIMELINES
- ASSUMPTIONS AND LIMITATIONS
- RESEARCH METHODOLOGY
- DATA MINING
- SECONDARY RESEARCH
- PRIMARY RESEARCH
- SUBJECT-MATTER EXPERTS’ ADVICE
- QUALITY CHECKS
- FINAL REVIEW
- DATA TRIANGULATION
- BOTTOM-UP APPROACH
- TOP-DOWN APPROACH
- RESEARCH FLOW
- DATA SOURCES
- DATA MINING
- EXECUTIVE SUMMARY
- MARKET OVERVIEW
- VIDEO VIRTUALIZATION MARKET OUTLOOK
- MARKET DRIVERS
- MARKET RESTRAINTS
- MARKET OPPORTUNITIES
- IMPACT OF COVID-19 ON VIDEO VIRTUALIZATION MARKET
- PORTER’S FIVE FORCES MODEL
- THREAT FROM NEW ENTRANTS
- THREAT FROM SUBSTITUTES
- BARGAINING POWER OF SUPPLIERS
- BARGAINING POWER OF CUSTOMERS
- DEGREE OF COMPETITION
- INDUSTRY VALUE CHAIN ANALYSIS
- VIDEO VIRTUALIZATION MARKET OUTLOOK
- GLOBAL VIDEO VIRTUALIZATION MARKET BY TYPE, 2020-2030, (USD BILLION)
- TYPE I
- TYPE II
- TYPE III
- TYPE IV
- GLOBAL VIDEO VIRTUALIZATION MARKET BY APPLICATION, 2020-2030, (USD BILLION)
- APPLICATION I
- APPLICATION II
- APPLICATION III
- APPLICATION IV
- GLOBAL VIDEO VIRTUALIZATION MARKET BY REGION, 2020-2030, (USD BILLION)
- NORTH AMERICA
- US
- CANADA
- MEXICO
- SOUTH AMERICA
- BRAZIL
- ARGENTINA
- COLOMBIA
- REST OF SOUTH AMERICA
- EUROPE
- GERMANY
- UK
- FRANCE
- ITALY
- SPAIN
- RUSSIA
- REST OF EUROPE
- ASIA PACIFIC
- INDIA
- CHINA
- JAPAN
- SOUTH KOREA
- AUSTRALIA
- SOUTH-EAST ASIA
- REST OF ASIA PACIFIC
- MIDDLE EAST AND AFRICA
- UAE
- SAUDI ARABIA
- SOUTH AFRICA
- REST OF MIDDLE EAST AND AFRICA
- NORTH AMERICA
- COMPANY PROFILES*
(BUSINESS OVERVIEW, COMPANY SNAPSHOT, PRODUCTS OFFERED, RECENT DEVELOPMENTS)
- AMAZON WEB SERVICES (AWS)
- ARISTA NETWORKS
- BRIGHTCOVE INC.
- CISCO SYSTEMS
- CITRIX SYSTEMS
- DELL TECHNOLOGIES
- GOOGLE LLC
- HEWLETT PACKARD ENTERPRISE
- HUAWEI TECHNOLOGIES
- IBM
- INTEL CORPORATION
- JUNIPER NETWORKS
- KALTURA INC.
- MICROSOFT CORPORATION
- NVIDIA CORPORATION
- ORACLE CORPORATION
- POLY
- RED HAT, INC.
- VMWARE
- ZOOM VIDEO COMMUNICATIONS *THE COMPANY LIST IS INDICATIVE
LIST OF TABLES
TABLE 1 GLOBAL VIDEO VIRTUALIZATION MARKET BY TYPE (USD BILLION) 2020-2030
TABLE 2 GLOBAL VIDEO VIRTUALIZATION MARKET BY APPLICATION (USD BILLION) 2020-2030
TABLE 3 GLOBAL VIDEO VIRTUALIZATION MARKET BY REGION (USD BILLION) 2020-2030
TABLE 4 NORTH AMERICA VIDEO VIRTUALIZATION MARKET BY COUNTRY (USD BILLION) 2020-2030
TABLE 5 NORTH AMERICA VIDEO VIRTUALIZATION MARKET BY TYPE (USD BILLION) 2020-2030
TABLE 6 NORTH AMERICA VIDEO VIRTUALIZATION MARKET BY APPLICATION (USD BILLION) 2020-2030
TABLE 7 US VIDEO VIRTUALIZATION MARKET BY TYPE (USD BILLION) 2020-2030
TABLE 8 US VIDEO VIRTUALIZATION MARKET BY APPLICATION (USD BILLION) 2020-2030
TABLE 9 CANADA VIDEO VIRTUALIZATION MARKET BY TYPE (USD BILLION) 2020-2030
TABLE 10 CANADA VIDEO VIRTUALIZATION MARKET BY APPLICATION (USD BILLION) 2020-2030
TABLE 11 MEXICO VIDEO VIRTUALIZATION MARKET BY TYPE (USD BILLION) 2020-2030
TABLE 12 MEXICO VIDEO VIRTUALIZATION MARKET BY APPLICATION (USD BILLION) 2020-2030
TABLE 13 SOUTH AMERICA VIDEO VIRTUALIZATION MARKET BY COUNTRY (USD BILLION) 2020-2030
TABLE 14 SOUTH AMERICA VIDEO VIRTUALIZATION MARKET BY TYPE (USD BILLION) 2020-2030
TABLE 15 SOUTH AMERICA VIDEO VIRTUALIZATION MARKET BY APPLICATION (USD BILLION) 2020-2030
TABLE 16 BRAZIL VIDEO VIRTUALIZATION MARKET BY TYPE (USD BILLION) 2020-2030
TABLE 17 BRAZIL VIDEO VIRTUALIZATION MARKET BY APPLICATION (USD BILLION) 2020-2030
TABLE 18 ARGENTINA VIDEO VIRTUALIZATION MARKET BY TYPE (USD BILLION) 2020-2030
TABLE 19 ARGENTINA VIDEO VIRTUALIZATION MARKET BY APPLICATION (USD BILLION) 2020-2030
TABLE 20 COLOMBIA VIDEO VIRTUALIZATION MARKET BY TYPE (USD BILLION) 2020-2030
TABLE 21 COLOMBIA VIDEO VIRTUALIZATION MARKET BY APPLICATION (USD BILLION) 2020-2030
TABLE 22 REST OF SOUTH AMERICA VIDEO VIRTUALIZATION MARKET BY TYPE (USD BILLION) 2020-2030
TABLE 23 REST OF SOUTH AMERICA VIDEO VIRTUALIZATION MARKET BY APPLICATION (USD BILLION) 2020-2030
TABLE 24 ASIA-PACIFIC VIDEO VIRTUALIZATION MARKET BY COUNTRY (USD BILLION) 2020-2030
TABLE 25 ASIA-PACIFIC VIDEO VIRTUALIZATION MARKET BY TYPE (USD BILLION) 2020-2030
TABLE 26 ASIA-PACIFIC VIDEO VIRTUALIZATION MARKET BY APPLICATION (USD BILLION) 2020-2030
TABLE 27 INDIA VIDEO VIRTUALIZATION MARKET BY TYPE (USD BILLION) 2020-2030
TABLE 28 INDIA VIDEO VIRTUALIZATION MARKET BY APPLICATION (USD BILLION) 2020-2030
TABLE 29 CHINA VIDEO VIRTUALIZATION MARKET BY TYPE (USD BILLION) 2020-2030
TABLE 30 CHINA VIDEO VIRTUALIZATION MARKET BY APPLICATION (USD BILLION) 2020-2030
TABLE 31 JAPAN VIDEO VIRTUALIZATION MARKET BY TYPE (USD BILLION) 2020-2030
TABLE 32 JAPAN VIDEO VIRTUALIZATION MARKET BY APPLICATION (USD BILLION) 2020-2030
TABLE 33 SOUTH KOREA VIDEO VIRTUALIZATION MARKET BY TYPE (USD BILLION) 2020-2030
TABLE 34 SOUTH KOREA VIDEO VIRTUALIZATION MARKET BY APPLICATION (USD BILLION) 2020-2030
TABLE 35 AUSTRALIA VIDEO VIRTUALIZATION MARKET BY TYPE (USD BILLION) 2020-2030
TABLE 36 AUSTRALIA VIDEO VIRTUALIZATION MARKET BY APPLICATION (USD BILLION) 2020-2030
TABLE 37 SOUTH-EAST ASIA VIDEO VIRTUALIZATION MARKET BY TYPE (USD BILLION) 2020-2030
TABLE 38 SOUTH-EAST ASIA VIDEO VIRTUALIZATION MARKET BY APPLICATION (USD BILLION) 2020-2030
TABLE 39 REST OF ASIA PACIFIC VIDEO VIRTUALIZATION MARKET BY TYPE (USD BILLION) 2020-2030
TABLE 40 REST OF ASIA PACIFIC VIDEO VIRTUALIZATION MARKET BY APPLICATION (USD BILLION) 2020-2030
TABLE 41 EUROPE VIDEO VIRTUALIZATION MARKET BY COUNTRY (USD BILLION) 2020-2030
TABLE 42 EUROPE VIDEO VIRTUALIZATION MARKET BY TYPE (USD BILLION) 2020-2030
TABLE 43 EUROPE VIDEO VIRTUALIZATION MARKET BY APPLICATION (USD BILLION) 2020-2030
TABLE 44 GERMANY VIDEO VIRTUALIZATION MARKET BY TYPE (USD BILLION) 2020-2030
TABLE 45 GERMANY VIDEO VIRTUALIZATION MARKET BY APPLICATION (USD BILLION) 2020-2030
TABLE 46 UK VIDEO VIRTUALIZATION MARKET BY TYPE (USD BILLION) 2020-2030
TABLE 47 UK VIDEO VIRTUALIZATION MARKET BY APPLICATION (USD BILLION) 2020-2030
TABLE 48 FRANCE VIDEO VIRTUALIZATION MARKET BY TYPE (USD BILLION) 2020-2030
TABLE 49 FRANCE VIDEO VIRTUALIZATION MARKET BY APPLICATION (USD BILLION) 2020-2030
TABLE 50 ITALY VIDEO VIRTUALIZATION MARKET BY TYPE (USD BILLION) 2020-2030
TABLE 51 ITALY VIDEO VIRTUALIZATION MARKET BY APPLICATION (USD BILLION) 2020-2030
TABLE 52 SPAIN VIDEO VIRTUALIZATION MARKET BY TYPE (USD BILLION) 2020-2030
TABLE 53 SPAIN VIDEO VIRTUALIZATION MARKET BY APPLICATION (USD BILLION) 2020-2030
TABLE 54 RUSSIA VIDEO VIRTUALIZATION MARKET BY TYPE (USD BILLION) 2020-2030
TABLE 55 RUSSIA VIDEO VIRTUALIZATION MARKET BY APPLICATION (USD BILLION) 2020-2030
TABLE 56 REST OF EUROPE VIDEO VIRTUALIZATION MARKET BY TYPE (USD BILLION) 2020-2030
TABLE 57 REST OF EUROPE VIDEO VIRTUALIZATION MARKET BY APPLICATION (USD BILLION) 2020-2030
TABLE 58 MIDDLE EAST AND AFRICA VIDEO VIRTUALIZATION MARKET BY COUNTRY (USD BILLION) 2020-2030
TABLE 59 MIDDLE EAST AND AFRICA VIDEO VIRTUALIZATION MARKET BY TYPE (USD BILLION) 2020-2030
TABLE 60 MIDDLE EAST AND AFRICA VIDEO VIRTUALIZATION MARKET BY APPLICATION (USD BILLION) 2020-2030
TABLE 61 UAE VIDEO VIRTUALIZATION MARKET BY TYPE (USD BILLION) 2020-2030
TABLE 62 UAE VIDEO VIRTUALIZATION MARKET BY APPLICATION (USD BILLION) 2020-2030
TABLE 63 SAUDI ARABIA VIDEO VIRTUALIZATION MARKET BY TYPE (USD BILLION) 2020-2030
TABLE 64 SAUDI ARABIA VIDEO VIRTUALIZATION MARKET BY APPLICATION (USD BILLION) 2020-2030
TABLE 65 SOUTH AFRICA VIDEO VIRTUALIZATION MARKET BY TYPE (USD BILLION) 2020-2030
TABLE 66 SOUTH AFRICA VIDEO VIRTUALIZATION MARKET BY APPLICATION (USD BILLION) 2020-2030
TABLE 67 REST OF MIDDLE EAST AND AFRICA VIDEO VIRTUALIZATION MARKET BY TYPE (USD BILLION) 2020-2030
TABLE 68 REST OF MIDDLE EAST AND AFRICA VIDEO VIRTUALIZATION MARKET BY APPLICATION (USD BILLION) 2020-2030
LIST OF FIGURES
FIGURE 1 MARKET DYNAMICS
FIGURE 2 MARKET SEGMENTATION
FIGURE 3 REPORT TIMELINES: YEARS CONSIDERED
FIGURE 4 DATA TRIANGULATION
FIGURE 5 BOTTOM-UP APPROACH
FIGURE 6 TOP-DOWN APPROACH
FIGURE 7 RESEARCH FLOW
FIGURE 8 GLOBAL VIDEO VIRTUALIZATION MARKET BY TYPE, USD BILLION, 2022-2030
FIGURE 9 GLOBAL VIDEO VIRTUALIZATION MARKET BY APPLICATION, USD BILLION, 2022-2030
FIGURE 10 GLOBAL VIDEO VIRTUALIZATION MARKET BY REGION, USD BILLION, 2022-2030
FIGURE 11 PORTER’S FIVE FORCES MODEL
FIGURE 12 GLOBAL VIDEO VIRTUALIZATION MARKET BY TYPE, USD BILLION,2022
FIGURE 13 GLOBAL VIDEO VIRTUALIZATION MARKET BY APPLICATION, USD BILLION,2022
FIGURE 14 GLOBAL VIDEO VIRTUALIZATION MARKET BY REGION, USD BILLION,2022
FIGURE 15 MARKET SHARE ANALYSIS
FIGURE 16 AMAZON WEB SERVICES (AWS): COMPANY SNAPSHOT
FIGURE 17 ARISTA NETWORKS: COMPANY SNAPSHOT
FIGURE 18 BRIGHTCOVE INC.: COMPANY SNAPSHOT
FIGURE 19 CISCO SYSTEMS: COMPANY SNAPSHOT
FIGURE 20 CITRIX SYSTEMS: COMPANY SNAPSHOT
FIGURE 21 DELL TECHNOLOGIES: COMPANY SNAPSHOT
FIGURE 22 GOOGLE LLC: COMPANY SNAPSHOT
FIGURE 23 HEWLETT PACKARD ENTERPRISE (HPE): COMPANY SNAPSHOT
FIGURE 24 HUAWEI TECHNOLOGIES: COMPANY SNAPSHOT
FIGURE 25 IBM: COMPANY SNAPSHOT
FIGURE 26 INTEL CORPORATION: COMPANY SNAPSHOT
FIGURE 27 JUNIPER NETWORKS: COMPANY SNAPSHOT
FIGURE 28 KALTURA INC.: COMPANY SNAPSHOT
FIGURE 29 MICROSOFT CORPORATION: COMPANY SNAPSHOT
FIGURE 30 NVIDIA CORPORATION: COMPANY SNAPSHOT
FIGURE 31 ORACLE CORPORATION: COMPANY SNAPSHOT
FIGURE 32 POLY (FORMERLY POLYCOM): COMPANY SNAPSHOT
FIGURE 33 RED HAT, INC.: COMPANY SNAPSHOT
FIGURE 34 VMWARE: COMPANY SNAPSHOT
FIGURE 35 ZOOM VIDEO COMMUNICATIONS: COMPANY SNAPSHOT
DOWNLOAD FREE SAMPLE REPORT
License Type
SPEAK WITH OUR ANALYST
Want to know more about the report or any specific requirement?
WANT TO CUSTOMIZE THE REPORT?
Our Clients Speak
We asked them to research ‘ Equipment market’ all over the world, and their whole arrangement was helpful to us. thehealthanalytics.com insightful analysis and reports contributed to our current analysis and in creating a future strategy. Besides, the te
Yosuke Mitsui
Senior Associate Construction Equipment Sales & Marketing
We asked them to research ‘Equipment market’ all over the world, and their whole arrangement was helpful to us. thehealthanalytics.com insightful analysis and reports contributed to our current analysis and in creating a future strategy. Besides, the te


