

Base Year Value ()
x.x %
x.x %
CAGR ()
x.x %
x.x %
Forecast Year Value ()
x.x %
x.x %
Historical Data Period
Largest Region
Forecast Period
ソルビトール市場:形態(液体および結晶)、用途(化粧品およびパーソナルケア、食品および飲料、医薬品、菓子類、その他)、地域(北米、ヨーロッパ、アジア太平洋、南米、中東およびアフリカ)、2022年から2029年までの世界的な傾向と予測
Instant access to hundreds of data points and trends
- Market estimates from 2014-2029
- Competitive analysis, industry segmentation, financial benchmarks
- Incorporates SWOT, Porter's Five Forces and risk management frameworks
- PDF report or online database with Word, Excel and PowerPoint export options
- 100% money back guarantee
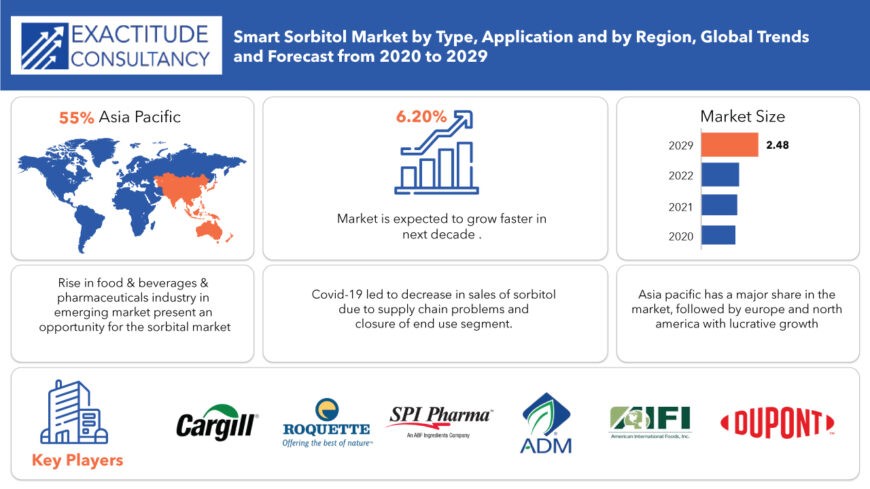
ソルビトール市場の概要
世界のソルビトール市場規模は、2022年から2029年にかけて6.20%のCAGRで成長すると予想されています。2020年の14億7,000万米ドルから2029年までに24億8,000万米ドルを超えると予想されています。
ソルビトールは主にトウモロコシ、海藻、果物、ベリー類から得られ、スクロースの触媒水素化によって製造されます。ソルビトールは、食品・飲料、医薬品、化粧品・パーソナルケアなど、さまざまな分野で甘味料、保湿剤、香料、利尿脱水剤として多岐にわたります。ソルビトールは低カロリーであるため、砂糖の代替品として機能し、キャンディー、ガム、アイスクリーム、焼き菓子、化粧品、歯磨き粉、パーソナルケア用品、医薬品など、数多くの製品に使用されています。
糖尿病患者やダイエット食品、飲料への採用が増えているため、市場は大幅な成長が見込まれています。さらに、消費者向け食品における砂糖代替品としての利用は、今後数年間で急増すると予想されています。ソルビトールは他の糖アルコールに比べて代謝速度が遅いため、口腔ケア製品に有効で、虫歯や歯の腐食などの歯の問題を防ぐのに役立ち、業界の拡大を促進します。
[キャプション id="attachment_4862" align="aligncenter" width="870"]
主な市場牽引力は、食品および飲料業界における栄養甘味料の需要の高まりです。FDA や USDA などの安全当局による医薬品やベーカリー食品へのソルビトールの使用に関する規制承認は、米国におけるソルビトールの市場プレゼンスを強化する態勢を整えています。さらに、医薬品の保湿剤としての用途は、特に最大の製薬産業の 1 つを抱える国での需要を増大させます。その結果、ソルビトールの需要軌道は予測期間中に上昇すると予想されます。
ソルビトールは、その食感、水分安定化、非発がん性などの特性により、チョコレートや菓子製品での利用が急増しており、市場の需要が拡大すると予想されています。化学的に不活性で安定しているため、レシピを損なうことなくさまざまな食品に簡単に組み込むことができます。これに、独自の食感向上特性が加わり、化粧品製造を含む用途の多様化が進んでいます。
Sorbitol Market Segment Analysis
The global sorbitol market is segmented by type, application, and region.
Based on type segments, the sorbitol market includes liquid sorbitol and crystal sorbitol. Due to progressive use of production process, ease of use and low manufacturing cost, the liquid form of sorbitol holds majority of global sorbitol market share. It is used as a substitute for sugar in the food & beverages and pharmaceutical industries. Thus, growing number of obese and health-conscious persons, is expected to fuel the use of sorbitol in the industries.
Crystal sorbitol is a sweet-tasting white hygroscopic powder, flakes, or granules. Sorbitol is mostly derived from corn starch, although it can also be derived from fruits such as apples, pears, peaches, and prunes. Crystal sorbitol is widely used as a food preservative in the manufacture of mint tablets, polydextrose (soluble dietary fibre), frozen raw material, chewing gum, and dried squid thread. It is also used in a variety of other frozen marine meals, as well as confectionary items. Crystal-sourced product is also utilized as a humectant in various cosmetic goods, such as face cream and moisturizers, due to its capacity to guard against bacterial deterioration and keep moisture. It also serves as a plasticizer in the production of capsule outer shells, as well as a stuffing and excipient in the production of pharmaceutical tablets.
The growing global demand for functional foods, along with economies of scale, has resulted in reduced manufacturing costs for the leading manufacturers, while also opening up new prospects for sorbitol growth in the future. The sorbitol can be classified based on the applications, which varies according to the sector. It is used as a preservative, additive and sweetener in the food and beverage industry, as a carrier or catalyst in pharmaceutical and as a stabilizer in cosmetics. Other than that sorbitol is also used as a humectant, texturizer or as bulking agent in industries. However, a gradual growth in the demand for sweeteners such as maltitol and xylitol is predicted to pose a threat to the industry, thus substituting the sorbitol.
Sorbitol is a surfactant that is used in detergents, dispersants, emulsifiers, wetting and foaming agents, and as a stabilizing factor in a range of baked products and ice cream. Biobased surfactants are becoming more popular in the food processing business. Surfactants also aid in the preservation of the viscosity and texture of food products, as well as the extension of their shelf life. As a result, the food processing industry's expansion is likely to fuel demand for biobased surfactant products over the forecast period.
[caption id="attachment_4864" align="alignnone" width="680"]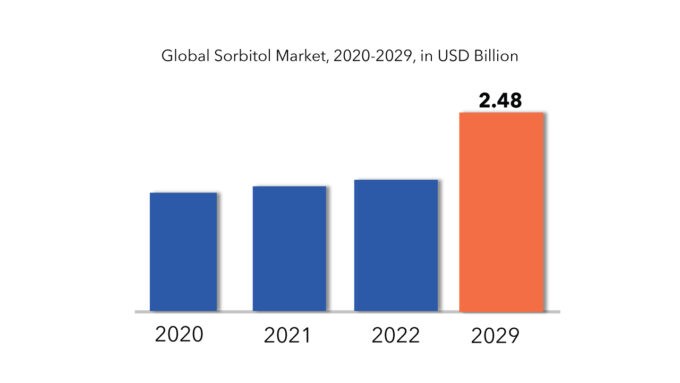
Sorbitol Market Players
The global sorbitol market key players include Cargill, Du-Point, Adm Company, Roquette Freres, Archer Daniels Midland Company, American International Foods Inc., Spi Pharma Inc, Merck Kga, Kasyap Sweeteners, Ltd., Pfizer Inc., Tate & Lyle, Ingredion Inc and among others.
To increase their market position, these businesses have implemented a variety of growth tactics. These companies are using expansion, new product development, mergers and acquisitions, and collaboration as important growth strategies to improve their product portfolio and geographical presence in order to meet the rising demand for sorbitol from emerging economies.
Who Should Buy? Or Key Stakeholders
- Government and research organization
- Sorbitol manufacturers
- Sorbitol traders, distributors, and suppliers
- FDA and other regulatory bodies
- Chemical Industry
- Food Industry
- Pharmaceutical Industry
- Others
Key Takeaways
- The global sorbitol market size is expected to grow at 6.20% CAGR.
- Based on type segments, the liquid form of sorbitol holds majority of global sorbitol market share.
- Based on the applications, growth in the demand for sweeteners such as maltitol and xylitol is predicted to pose a threat to the industry, thus substituting the sorbitol.
- Asia Pacific has a dominating share in the global sorbitol market.
- The sorbitol market is experiencing steady growth driven by increasing demand in food and beverage, pharmaceuticals, and personal care industries.
Sorbitol Market Regional Analysis
The sorbitol market by region includes North America, Asia-Pacific (APAC), Europe, South America, and Middle East & Africa (MEA).
- North America: includes the US, Canada, Mexico
- Asia Pacific: includes China, Japan, South Korea, India, Australia, ASEAN and Rest of APAC
- Europe: includes UK, Germany, France, Italy, Spain, Russia, and Rest of Europe
- South America: includes Brazil, Argentina and Rest of South America
- Middle East & Africa: includes Turkey, UAE, Saudi Arabia, South Africa, and Rest of MEA
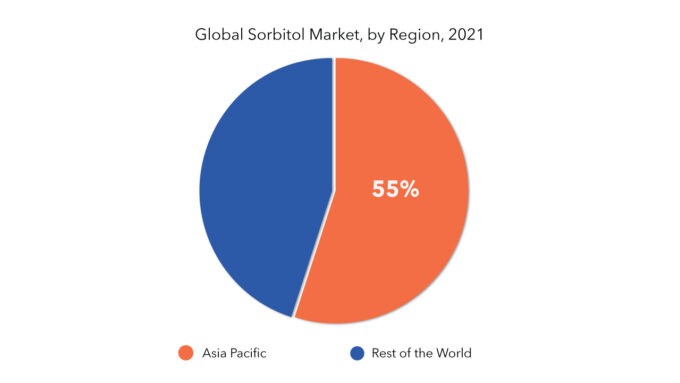
Asia Pacific has a dominating share in the global sorbitol market where, China is the largest producer and exporter of Sorbitol. Followed by North America and Europe having a lucrative growth, owing to demand for convenient food and boost in non-food industries.
Key Market Segments: Sorbitol Market
Sorbitol Market by Type/Form, 2022-2029, (USD Million) (Kilo Tons)- Liquid
- Crystal
- Cosmetics & Personal Care
- Food & Beverage
- Pharmaceuticals
- Confectionery
- Others
- North America
- Europe
- Asia Pacific
- South America
- Middle East And Africa
Key Question Answered
- What is the current size of the sorbitol market?
- What are the key factors influencing the growth of sorbitol?
- What is the major end-use industry for sorbitol?
- Who are the major key players in the sorbitol market?
- Which region will provide more business opportunities for sorbitol in future?
- Which segment holds the maximum share of the sorbitol market?
- Introduction
- Market Definition
- Market Segmentation
- Research Timelines
- Assumptions and Limitations
- Research Methodology
- Data Mining
- Secondary Research
- Primary Research
- Subject-Matter Experts’ Advice
- Quality Checks
- Final Review
- Data Triangulation
- Bottom-Up Approach
- Top-Down Approach
- Research Flow
- Data Sources
- Data Mining
- Executive Summary
- Market Overview
- Global Sorbitol Market Outlook
- Market Drivers
- Market Restraints
- Market Opportunities
- Impact of Covid-19 On Sorbitol Market
- Porter’s five forces model
- Threat from new entrants
- Threat from substitutes
- Bargaining power of suppliers
- Bargaining power of customers
- Degree of competition
- Industry value chain Analysis
- Global Sorbitol Market Outlook
- Global Sorbitol Market by Form
- Liquid
- Crystal
- Global Sorbitol Market by Application
- Cosmetics & Personal care
- Food & Beverages
- Pharmaceuticals
- Confectionary
- Others
- Global Sorbitol Market by Region
- North America
- US
- Canada
- Mexico
- South America
- Brazil
- Argentina
- Colombia
- Rest Of South America
- Europe
- Germany
- UK
- France
- Italy
- Spain
- Russia
- Rest Of Europe
- Asia Pacific
- India
- China
- Japan
- South Korea
- Australia
- South-East Asia
- Rest Of Asia Pacific
- Middle East and Africa
- UAE
- Saudi Arabia
- South Africa
- Rest Of Middle East and Africa
- North America
- Company Profiles* (Business Overview, Company Snapshot, Products Offered, Recent Developments)
- CARGILL
- DU-POINT
- ADM COMPANY
- ROQUETTE FRERES
- ARCHER DANIELS MIDLAND COMPANY
- AMERICAN INTERNATIONAL FOODS INC.
- SPI PHARMA INC
- MERCK KGAA
- KASYAP SWEETENERS, LTD.
- PFIZER INC.
- TATE & LYLE
- INGREDION INC
*The Company List Is Indicative
LIST OF TABLES
TABLE 1 GLOBAL SORBITOL MARKET BY FORM (USD MILLIONS) 2020-2029
TABLE 2 GLOBAL SORBITOL MARKET BY FORM (KILOTONS) 2020-2029
TABLE 3 GLOBAL SORBITOL MARKET BY APPLICATION (USD MILLIONS) 2020-2029
TABLE 4 GLOBAL SORBITOL MARKET BY APPLICATION (THOUSAND UNITS) 2020-2029
TABLE 5 GLOBAL SORBITOL MARKET BY REGION (USD MILLIONS) 2020-2029
TABLE 6 GLOBAL SORBITOL MARKET BY REGION (KILOTONS) 2020-2029
TABLE 7 US SORBITOL MARKET BY FORM (USD MILLIONS) 2020-2029
TABLE 8 US SORBITOL MARKET BY FORM (KILOTONS) 2020-2029
TABLE 9 US SORBITOL MARKET BY APPLICATION (USD MILLIONS) 2020-2029
TABLE 10 US SORBITOL MARKET BY APPLICATION (KILOTONS) 2020-2029
TABLE 11 CANADA SORBITOL MARKET BY FORM (USD MILLIONS) 2020-2029
TABLE 12 CANADA SORBITOL MARKET BY FORM (KILOTONS) 2020-2029
TABLE 13 CANADA SORBITOL MARKET BY APPLICATION (USD MILLIONS) 2020-2029
TABLE 14 CANADA SORBITOL MARKET BY APPLICATION (KILOTONS) 2020-2029
TABLE 15 MEXICO SORBITOL MARKET BY FORM (USD MILLIONS) 2020-2029
TABLE 16 MEXICO SORBITOL MARKET BY FORM (KILOTONS) 2020-2029
TABLE 17 MEXICO SORBITOL MARKET BY APPLICATION (USD MILLIONS) 2020-2029
TABLE 18 MEXICO SORBITOL MARKET BY APPLICATION (KILOTONS) 2020-2029
TABLE 19 BRAZIL SORBITOL MARKET BY FORM (USD MILLIONS) 2020-2029
TABLE 20 BRAZIL SORBITOL MARKET BY FORM (KILOTONS) 2020-2029
TABLE 21 BRAZIL SORBITOL MARKET BY APPLICATION (USD MILLIONS) 2020-2029
TABLE 22 BRAZIL SORBITOL MARKET BY APPLICATION (KILOTONS) 2020-2029
TABLE 23 ARGENTINA SORBITOL MARKET BY FORM (USD MILLIONS) 2020-2029
TABLE 24 ARGENTINA SORBITOL MARKET BY FORM (KILOTONS) 2020-2029
TABLE 25 ARGENTINA SORBITOL MARKET BY APPLICATION (USD MILLIONS) 2020-2029
TABLE 26 ARGENTINA SORBITOL MARKET BY APPLICATION (KILOTONS) 2020-2029
TABLE 27 COLOMBIA SORBITOL MARKET BY FORM (USD MILLIONS) 2020-2029
TABLE 28 COLOMBIA SORBITOL MARKET BY FORM (KILOTONS) 2020-2029
TABLE 29 COLOMBIA SORBITOL MARKET BY APPLICATION (USD MILLIONS) 2020-2029
TABLE 30 COLOMBIA SORBITOL MARKET BY APPLICATION (KILOTONS) 2020-2029
TABLE 31 REST OF SOUTH AMERICA SORBITOL MARKET BY FORM (USD MILLIONS) 2020-2029
TABLE 32 REST OF SOUTH AMERICA SORBITOL MARKET BY FORM (KILOTONS) 2020-2029
TABLE 33 REST OF SOUTH AMERICA SORBITOL MARKET BY APPLICATION (USD MILLIONS) 2020-2029
TABLE 34 REST OF SOUTH AMERICA SORBITOL MARKET BY APPLICATION (KILOTONS) 2020-2029
TABLE 35 INDIA SORBITOL MARKET BY FORM (USD MILLIONS) 2020-2029
TABLE 36 INDIA SORBITOL MARKET BY FORM (KILOTONS) 2020-2029
TABLE 37 INDIA SORBITOL MARKET BY APPLICATION (USD MILLIONS) 2020-2029
TABLE 38 INDIA SORBITOL MARKET BY APPLICATION (KILOTONS) 2020-2029
TABLE 39 CHINA SORBITOL MARKET BY FORM (USD MILLIONS) 2020-2029
TABLE 40 CHINA SORBITOL MARKET BY FORM (KILOTONS) 2020-2029
TABLE 41 CHINA SORBITOL MARKET BY APPLICATION (USD MILLIONS) 2020-2029
TABLE 42 CHINA SORBITOL MARKET BY APPLICATION (KILOTONS) 2020-2029
TABLE 43 JAPAN SORBITOL MARKET BY FORM (USD MILLIONS) 2020-2029
TABLE 44 JAPAN SORBITOL MARKET BY FORM (KILOTONS) 2020-2029
TABLE 45 JAPAN SORBITOL MARKET BY APPLICATION (USD MILLIONS) 2020-2029
TABLE 46 JAPAN SORBITOL MARKET BY APPLICATION (KILOTONS) 2020-2029
TABLE 47 SOUTH KOREA SORBITOL MARKET BY FORM (USD MILLIONS) 2020-2029
TABLE 48 SOUTH KOREA SORBITOL MARKET BY FORM (KILOTONS) 2020-2029
TABLE 49 SOUTH KOREA SORBITOL MARKET BY APPLICATION (USD MILLIONS) 2020-2029
TABLE 50 SOUTH KOREA SORBITOL MARKET BY APPLICATION (KILOTONS) 2020-2029
TABLE 51 AUSTRALIA SORBITOL MARKET BY FORM (USD MILLIONS) 2020-2029
TABLE 52 AUSTRALIA SORBITOL MARKET BY FORM (KILOTONS) 2020-2029
TABLE 53 AUSTRALIA SORBITOL MARKET BY APPLICATION (USD MILLIONS) 2020-2029
TABLE 54 AUSTRALIA SORBITOL MARKET BY APPLICATION (KILOTONS) 2020-2029
TABLE 55 SOUTH-EAST ASIA SORBITOL MARKET BY FORM (USD MILLIONS) 2020-2029
TABLE 56 SOUTH-EAST ASIA SORBITOL MARKET BY FORM (KILOTONS) 2020-2029
TABLE 57 SOUTH-EAST ASIA SORBITOL MARKET BY APPLICATION (USD MILLIONS) 2020-2029
TABLE 58 SOUTH-EAST ASIA SORBITOL MARKET BY APPLICATION (KILOTONS) 2020-2029
TABLE 59 REST OF ASIA PACIFIC SORBITOL MARKET BY FORM (USD MILLIONS) 2020-2029
TABLE 60 REST OF ASIA PACIFIC SORBITOL MARKET BY FORM (KILOTONS) 2020-2029
TABLE 61 REST OF ASIA PACIFIC SORBITOL MARKET BY APPLICATION (USD MILLIONS) 2020-2029
TABLE 62 REST OF ASIA PACIFIC SORBITOL MARKET BY APPLICATION (KILOTONS) 2020-2029
TABLE 63 GERMANY SORBITOL MARKET BY FORM (USD MILLIONS) 2020-2029
TABLE 64 GERMANY SORBITOL MARKET BY FORM (KILOTONS) 2020-2029
TABLE 65 GERMANY SORBITOL MARKET BY APPLICATION (USD MILLIONS) 2020-2029
TABLE 66 GERMANY SORBITOL MARKET BY APPLICATION (KILOTONS) 2020-2029
TABLE 67 UK SORBITOL MARKET BY FORM (USD MILLIONS) 2020-2029
TABLE 68 UK SORBITOL MARKET BY FORM (KILOTONS) 2020-2029
TABLE 69 UK SORBITOL MARKET BY APPLICATION (USD MILLIONS) 2020-2029
TABLE 70 UK SORBITOL MARKET BY APPLICATION (KILOTONS) 2020-2029
TABLE 71 FRANCE SORBITOL MARKET BY FORM (USD MILLIONS) 2020-2029
TABLE 72 FRANCE SORBITOL MARKET BY FORM (KILOTONS) 2020-2029
TABLE 73 FRANCE SORBITOL MARKET BY APPLICATION (USD MILLIONS) 2020-2029
TABLE 74 FRANCE SORBITOL MARKET BY APPLICATION (KILOTONS) 2020-2029
TABLE 75 ITALY SORBITOL MARKET BY FORM (USD MILLIONS) 2020-2029
TABLE 76 ITALY SORBITOL MARKET BY FORM (KILOTONS) 2020-2029
TABLE 77 ITALY SORBITOL MARKET BY APPLICATION (USD MILLIONS) 2020-2029
TABLE 78 ITALY SORBITOL MARKET BY APPLICATION (KILOTONS) 2020-2029
TABLE 79 SPAIN SORBITOL MARKET BY FORM (USD MILLIONS) 2020-2029
TABLE 80 SPAIN SORBITOL MARKET BY FORM (KILOTONS) 2020-2029
TABLE 81 SPAIN SORBITOL MARKET BY APPLICATION (USD MILLIONS) 2020-2029
TABLE 82 SPAIN SORBITOL MARKET BY APPLICATION (KILOTONS) 2020-2029
TABLE 83 RUSSIA SORBITOL MARKET BY FORM (USD MILLIONS) 2020-2029
TABLE 84 RUSSIA SORBITOL MARKET BY FORM (KILOTONS) 2020-2029
TABLE 85 RUSSIA SORBITOL MARKET BY APPLICATION (USD MILLIONS) 2020-2029
TABLE 86 RUSSIA SORBITOL MARKET BY APPLICATION (KILOTONS) 2020-2029
TABLE 87 REST OF EUROPE SORBITOL MARKET BY FORM (USD MILLIONS) 2020-2029
TABLE 88 REST OF EUROPE SORBITOL MARKET BY FORM (KILOTONS) 2020-2029
TABLE 89 REST OF EUROPE SORBITOL MARKET BY APPLICATION (USD MILLIONS) 2020-2029
TABLE 90 REST OF EUROPE SORBITOL MARKET BY APPLICATION (KILOTONS) 2020-2029
TABLE 91 UAE SORBITOL MARKET BY FORM (USD MILLIONS) 2020-2029
TABLE 92 UAE SORBITOL MARKET BY FORM (KILOTONS) 2020-2029
TABLE 93 UAE SORBITOL MARKET BY APPLICATION (USD MILLIONS) 2020-2029
TABLE 94 UAE SORBITOL MARKET BY APPLICATION (KILOTONS) 2020-2029
TABLE 95 SAUDI ARABIA SORBITOL MARKET BY FORM (USD MILLIONS) 2020-2029
TABLE 96 SAUDI ARABIA SORBITOL MARKET BY FORM (KILOTONS) 2020-2029
TABLE 97 SAUDI ARABIA SORBITOL MARKET BY APPLICATION (USD MILLIONS) 2020-2029
TABLE 98 SAUDI ARABIA SORBITOL MARKET BY APPLICATION (KILOTONS) 2020-2029
TABLE 99 SOUTH AFRICA SORBITOL MARKET BY FORM (USD MILLIONS) 2020-2029
TABLE 100 SOUTH AFRICA SORBITOL MARKET BY FORM (KILOTONS) 2020-2029
TABLE 101 SOUTH AFRICA SORBITOL MARKET BY APPLICATION (USD MILLIONS) 2020-2029
TABLE 102 SOUTH AFRICA SORBITOL MARKET BY APPLICATION (KILOTONS) 2020-2029
TABLE 103 REST OF MIDDLE EAST AND AFRICA SORBITOL MARKET BY FORM (USD MILLIONS) 2020-2029
TABLE 104 REST OF MIDDLE EAST AND AFRICA SORBITOL MARKET BY FORM (KILOTONS) 2020-2029
TABLE 105 REST OF MIDDLE EAST AND AFRICA SORBITOL MARKET BY APPLICATION (USD MILLIONS) 2020-2029
TABLE 106 REST OF MIDDLE EAST AND AFRICA SORBITOL MARKET BY APPLICATION (KILOTONS) 2020-2029
LIST OF FIGURES
FIGURE 1 MARKET DYNAMICS
FIGURE 2 MARKET SEGMENTATION
FIGURE 3 REPORT TIMELINES: YEARS CONSIDERED
FIGURE 4 DATA TRIANGULATION
FIGURE 5 BOTTOM-UP APPROACH
FIGURE 6 TOP-DOWN APPROACH
FIGURE 7 RESEARCH FLOW
FIGURE 8 GLOBAL SORBITOL MARKET BY FORM, USD MILLION, 2020-2029
FIGURE 9 GLOBAL SORBITOL MARKET BY APPLICATION, USD MILLION, 2020-2029
FIGURE 10 GLOBAL SORBITOL MARKET BY REGION, USD MILLION, 2020-2029
FIGURE 11 PORTER’S FIVE FORCES MODEL
FIGURE 12 NORTH AMERICA SORBITOL MARKET SNAPSHOT
FIGURE 13 EUROPE SORBITOL MARKET SNAPSHOT
FIGURE 14 ASIA PACIFIC SORBITOL MARKET SNAPSHOT
FIGURE 15 SOUTH AMERICA SORBITOL MARKET SNAPSHOT
FIGURE 16 MIDDLE EAST & AFRICA SORBITOL MARKET SNAPSHOT
FIGURE 17 CARGILL: COMPANY SNAPSHOT
FIGURE 18 DU-POINT: COMPANY SNAPSHOT
FIGURE 19 ADM COMPANY: COMPANY SNAPSHOT
FIGURE 20 ROQUETTE FRERES: COMPANY SNAPSHOT
FIGURE 21 ARCHER DANIELS MIDLAND COMPANY: COMPANY SNAPSHOT
FIGURE 22 AMERICAN INTERNATIONAL FOODS INC.: COMPANY SNAPSHOT
FIGURE 23 SPI PHARMA INC: COMPANY SNAPSHOT
FIGURE 24 MERCK KGAA: COMPANY SNAPSHOT
FIGURE 25 KASYAP SWEETENERS, LTD.: COMPANY SNAPSHOT
FIGURE 26 PFIZER INC.: COMPANY SNAPSHOT
FIGURE 27 TATE & LYLE: COMPANY SNAPSHOT
DOWNLOAD FREE SAMPLE REPORT
License Type
SPEAK WITH OUR ANALYST
Want to know more about the report or any specific requirement?
WANT TO CUSTOMIZE THE REPORT?
Our Clients Speak
We asked them to research ‘ Equipment market’ all over the world, and their whole arrangement was helpful to us. thehealthanalytics.com insightful analysis and reports contributed to our current analysis and in creating a future strategy. Besides, the te
Yosuke Mitsui
Senior Associate Construction Equipment Sales & Marketing
We asked them to research ‘Equipment market’ all over the world, and their whole arrangement was helpful to us. thehealthanalytics.com insightful analysis and reports contributed to our current analysis and in creating a future strategy. Besides, the te


