

Base Year Value ()
x.x %
x.x %
CAGR ()
x.x %
x.x %
Forecast Year Value ()
x.x %
x.x %
Historical Data Period
Largest Region
Forecast Period
アクチュエータ市場:駆動方式(電気、空気圧、油圧)、タイプ(リニア、ロータリー)、アプリケーション(産業オートメーション、ロボット工学、車両および機器)、垂直および地域別、2022年から2029年までの世界的な傾向と予測
Instant access to hundreds of data points and trends
- Market estimates from 2014-2029
- Competitive analysis, industry segmentation, financial benchmarks
- Incorporates SWOT, Porter's Five Forces and risk management frameworks
- PDF report or online database with Word, Excel and PowerPoint export options
- 100% money back guarantee
アクチュエータ市場の概要
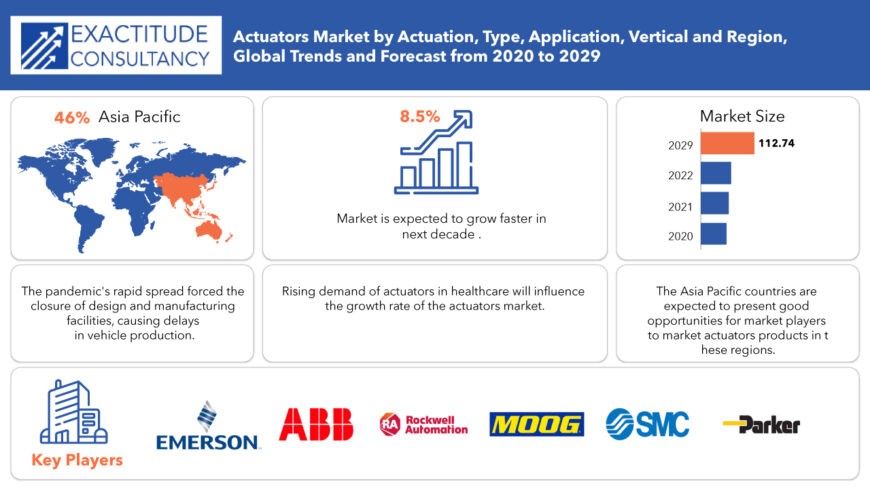
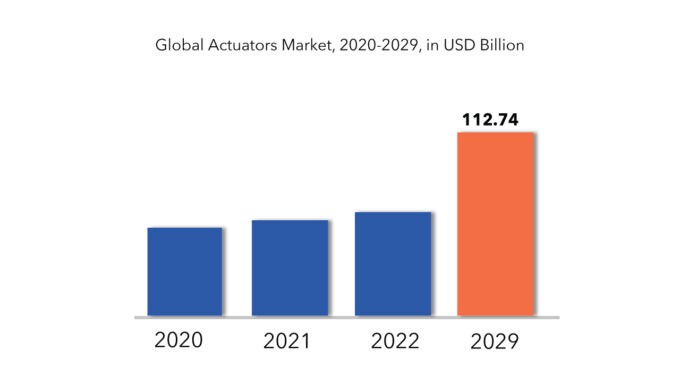
世界のアクチュエータ市場規模は、2022年から2029年にかけて8.5%のCAGRで成長すると予想されています。2020年の541億米ドルから2029年には1127億4000万米ドルを超えると予想されています。
世界のアクチュエータ市場は、急速な都市化と工業化のペースによって牽引されています。追加インフラへの投資や既存施設の改修の増加が見込まれており、市場拡大にプラスの影響を与えると予想されています。人口増加、工業生産高の増加、製造企業における自動化志向の高まり、厳しい環境から天然資源を抽出する必要性などの要因も、近い将来にアクチュエータ業界の成長を促進すると予測されています。さらに、宇宙探査活動の復活は、アクチュエータ市場の需要を促進する潜在的な機会をもたらします。自動車、食品・飲料、石油・ガス、ロボット工学、防衛・安全保障、航空宇宙、物流などのさまざまなセクターが、生産プロセスの安全性、効率性、精度を高め、時間効率の高いサービスを提供するために、自動化イニシアチブを優先しています。[caption id="attachment_5288" align="aligncenter" width="870"]
Actuators Market Segment Analysis
The global actuators and valves market is segmented according to type, application, and region. It is classified into actuators and valves based on their type. Electric actuators, mechanical actuators, pneumatic actuators, and hydraulic actuators are sub-segments of the actuators segment. The valves segment is further subdivided into multi turn valves and control valves. In terms of revenue, the valves segment dominated the actuators & valves market in 2019, and this trend is expected to continue throughout the forecast period. The market is segmented by application into oil & gas, paper & pulp, mining, water & wastewater, food & beverage, energy & power, automotive, and others. The oil and gas industry held the largest market share. The market is divided into two types: linear actuators and rotary actuators. During the forecast period, the linear actuators segment is expected to dominate the market. The rising demand for fuel-efficient vehicles, stringent environmental regulations, increased automation in emerging economies, and the growing need to improve combustion control, increase reliability, and reduce production costs in manufacturing sectors are some of the major factors driving the global market for linear actuators. The market is divided into hydraulic, electrical, pneumatic, mechanical, and other actuators based on system type. Electrical actuators dominated the market and are expected to continue to do so during the forecast period. This expansion can be attributed to the widespread use of electrical actuators in the aviation industry. Electrical actuators are essential in system control because they convert electrical signals to mechanical movement.Actuators Market Key Players
The actuators market key players include ABB (Switzerland), Rockwell Automation (US), Altra Industrial Motion (US), Moog (US), SMC (Japan), Curtis Wright (Exlar) (US), and MISUMI (Japan) are some of the leading players operating in the actuators market.
To increase their market position, these businesses have implemented a variety of growth tactics. These companies are using expansion, new product development, mergers and acquisitions, and collaboration as important growth strategies to improve their product portfolio and geographical presence in order to meet the rising demand for corrugated packaging from emerging economies.
Who Should Buy? Or Key stakeholders
- Manufacturers of actuators
- Traders, distributors, and suppliers of actuators
- Government and research organizations
- Investment firms
- Others
Key Takeaways:
- The global actuators market size is expected to grow at 8.5% CAGR.
- Based on type, the linear actuators segment is expected to dominate the market.
- Based on system type. Electrical actuators dominated the market and are expected to continue to do so.
- The Asia Pacific region is expected to account for the largest share of the actuators market.
- The actuators market is experiencing growth driven by increasing automation and adoption across various industries.
Actuators Market Regional Analysis
The actuators market by region includes North America, Asia-Pacific (APAC), Europe, South America, and Middle East & Africa (MEA).
- North America: includes the US, Canada, Mexico
- Asia Pacific: includes China, Japan, South Korea, India, Australia, ASEAN and Rest of APAC
- Europe: includes UK, Germany, France, Italy, Spain, Russia, and Rest of Europe
- South America: includes Brazil, Argentina and Rest of South America
- Middle East & Africa: includes Turkey, UAE, Saudi Arabia, South Africa, and Rest of MEA
In 2021, the Asia Pacific region is expected to account for the largest share of the actuators market. This region's actuators market has been researched for Japan, China, India, South Korea, Taiwan, and the rest of Asia Pacific. Industries in the Asia Pacific region are constantly upgrading their capabilities, necessitating the use of machinery outfitted with new and advanced actuators. China and Japan are primarily investing in robotics and automation to gain a tactical advantage in the field of robotics and process automation. This presents an excellent opportunity for Asia Pacific actuator manufacturers to expand.
[caption id="attachment_5289" align="alignleft" width="680"]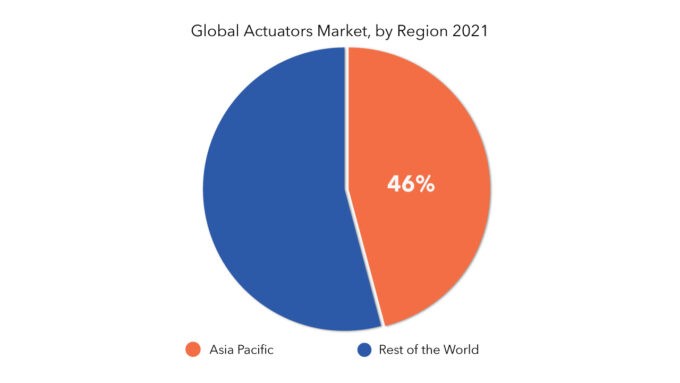
Key Market Segments: Actuators Market
Actuators Market By Type, 2020-2029, (USD Million), (Thousand Units)- Linear Actuator
- Rotary Actuator
- Industrial Automation
- Robotics
- Vehicles And Equipment
- Electrical
- Pneumatic
- Hydraulic
- Others
- Food & Beverages
- Oil & Gas;
- Metals, Mining, And Machinery
- Power Generation
- Chemicals, Paper, And Plastics
- Pharmaceutical & Healthcare
- Automotive
- Aerospace & Defense
- Marine
- Electronics & Electrical
- Construction
- Agriculture
- Utilities
- Household & Entertainment.
- North America
- Europe
- Asia Pacific
- South America
- Middle East And Africa
Key Question Answered
- What is the current size of the actuators market?
- What are the key factors influencing the growth of actuators?
- What is the major end-use industry for actuators?
- Who are the major key players in the actuators market?
- Which region will provide more business opportunities for actuators in future?
- Which segment holds the maximum share of the actuators market?
- 導入
- 市場の定義
- 市場セグメンテーション
- 研究タイムライン
- 前提と制限
- 研究方法
- データマイニング
- 二次調査
- 一次研究
- 専門家のアドバイス
- 品質チェック
- 最終レビュー
- データの三角測量
- ボトムアップアプローチ
- トップダウンアプローチ
- 研究の流れ
- データソース
- データマイニング
- エグゼクティブサマリー
- 市場概要
- 世界のアクチュエータ市場の見通し
- 市場の推進要因
- 市場の制約
- 市場機会
- アクチュエータ市場へのCOVID-19の影響
- ポーターの5つの力モデル
- 新規参入者からの脅威
- 代替品からの脅威
- サプライヤーの交渉力
- 顧客の交渉力
- 競争の度合い
- 業界バリューチェーン分析
- 世界のアクチュエータ市場の見通し
- アクチュエーター市場(タイプ別)
- リニアアクチュエータ
- ロータリーアクチュエータ
- 用途別アクチュエータの世界市場
- 産業オートメーション
- ロボット工学
- 車両と装備
- アクチュエーター市場(作動別)
- 電気
- 空気圧
- 油圧式
- その他
- 世界のアクチュエータ市場(業種別)
- 食品・飲料
- 石油・ガス;
- 金属、鉱業、機械
- 発電
- 化学薬品、紙、プラスチック
- 医薬品・ヘルスケア
- 自動車
- 航空宇宙および防衛
- マリン
- 電子・電気
- 工事
- 農業
- ユーティリティ
- 家庭用品と娯楽。
- 地域別アクチュエータ市場
- 北米
- 私たち
- カナダ
- メキシコ
- 南アメリカ
- ブラジル
- アルゼンチン
- コロンビア
- 南米のその他の地域
- ヨーロッパ
- ドイツ
- 英国
- フランス
- イタリア
- スペイン
- ロシア
- その他のヨーロッパ
- アジア太平洋
- インド
- 中国
- 日本
- 韓国
- オーストラリア
- 東南アジア
- その他のアジア太平洋地域
- 中東およびアフリカ
- アラブ首長国連邦
- サウジアラビア
- 南アフリカ
- その他の中東およびアフリカ
- 北米
- 会社概要*(事業概要、会社概要、提供製品、最近の動向)
- ZF フリードリヒスハーフェン AG
- ヘラKGaA
- コンチネンタルAG
- デンソー株式会社
- ロバート・ボッシュ GmbH
- デルファイ・オートモーティブ
- 日立オートモティブシステムズ株式会社
- マグナインターナショナル
- ボルグワーナー社
- ジョンソンエレクトリック
- MAHLE GmbH
- Mitsubishi Corporation
- Nidec Motors & Actuators The Company List Is Indicative
LIST OF TABLES
TABLE 1 GLOBAL ACTUATORS MARKET BY TYPE (USD MILLIONS) 2020-2029
TABLE 2 GLOBAL ACTUATORS MARKET BY TYPE (THOUSAND UNITS) 2020-2029
TABLE 3 GLOBAL ACTUATORS MARKET BY APPLICATION (USD MILLIONS) 2020-2029
TABLE 4 GLOBAL ACTUATORS MARKET BY APPLICATION (THOUSAND UNITS) 2020-2029
TABLE 5 GLOBAL ACTUATORS MARKET BY ACTUATION (USD MILLIONS) 2019-2028
TABLE 6 GLOBAL ACTUATORS MARKET BY ACTUATION (THOUSAND UNITS) 2019-2028
TABLE 7 GLOBAL ACTUATORS MARKET BY VERTICAL (USD MILLIONS) 2020-2029
TABLE 8 GLOBAL ACTUATORS MARKET BY VERTICAL (THOUSAND UNITS) 2020-2029
TABLE 9 GLOBAL ACTUATORS MARKET BY REGION (USD MILLIONS) 2020-2029
TABLE 10 GLOBAL ACTUATORS MARKET BY REGION (THOUSAND UNITS) 2020-2029
TABLE 11 US ACTUATORS MARKET BY TYPE (USD MILLIONS) 2020-2029
TABLE 12 US ACTUATORS MARKET BY TYPE (THOUSAND UNITS) 2020-2029
TABLE 13 US ACTUATORS MARKET BY APPLICATION (USD MILLIONS) 2020-2029
TABLE 14 US ACTUATORS MARKET BY APPLICATION (THOUSAND UNITS) 2020-2029
TABLE 15 US ACTUATORS MARKET BY ACTUATION (USD MILLIONS) 2019-2028
TABLE 16 US ACTUATORS MARKET BY ACTUATION (THOUSAND UNITS) 2019-2028
TABLE 17 US ACTUATORS MARKET BY VERTICAL (USD MILLIONS) 2020-2029
TABLE 18 US ACTUATORS MARKET BY VERTICAL (THOUSAND UNITS) 2020-2029
TABLE 19 CANADA ACTUATORS MARKET BY TYPE (USD MILLIONS) 2020-2029
TABLE 20 CANADA ACTUATORS MARKET BY TYPE (THOUSAND UNITS) 2020-2029
TABLE 21 CANADA ACTUATORS MARKET BY APPLICATION (USD MILLIONS) 2020-2029
TABLE 22 CANADA ACTUATORS MARKET BY APPLICATION (THOUSAND UNITS) 2020-2029
TABLE 23 CANADA ACTUATORS MARKET BY ACTUATION (USD MILLIONS) 2019-2028
TABLE 24 CANADA ACTUATORS MARKET BY ACTUATION (THOUSAND UNITS) 2019-2028
TABLE 25 CANADA ACTUATORS MARKET BY VERTICAL (USD MILLIONS) 2020-2029
TABLE 26 CANADA ACTUATORS MARKET BY VERTICAL (THOUSAND UNITS) 2020-2029
TABLE 27 MEXICO ACTUATORS MARKET BY TYPE (USD MILLIONS) 2020-2029
TABLE 28 MEXICO ACTUATORS MARKET BY TYPE (THOUSAND UNITS) 2020-2029
TABLE 29 MEXICO ACTUATORS MARKET BY APPLICATION (USD MILLIONS) 2020-2029
TABLE 30 MEXICO ACTUATORS MARKET BY APPLICATION (THOUSAND UNITS) 2020-2029
TABLE 31 MEXICO ACTUATORS MARKET BY ACTUATION (USD MILLIONS) 2019-2028
TABLE 32 MEXICO ACTUATORS MARKET BY ACTUATION (THOUSAND UNITS) 2019-2028
TABLE 33 MEXICO ACTUATORS MARKET BY VERTICAL (USD MILLIONS) 2020-2029
TABLE 34 MEXICO ACTUATORS MARKET BY VERTICAL (THOUSAND UNITS) 2020-2029
TABLE 35 BRAZIL ACTUATORS MARKET BY TYPE (USD MILLIONS) 2020-2029
TABLE 36 BRAZIL ACTUATORS MARKET BY TYPE (THOUSAND UNITS) 2020-2029
TABLE 37 BRAZIL ACTUATORS MARKET BY APPLICATION (USD MILLIONS) 2020-2029
TABLE 38 BRAZIL ACTUATORS MARKET BY APPLICATION (THOUSAND UNITS) 2020-2029
TABLE 39 BRAZIL ACTUATORS MARKET BY ACTUATION (USD MILLIONS) 2019-2028
TABLE 40 BRAZIL ACTUATORS MARKET BY ACTUATION (THOUSAND UNITS) 2019-2028
TABLE 41 BRAZIL ACTUATORS MARKET BY VERTICAL (USD MILLIONS) 2020-2029
TABLE 42 BRAZIL ACTUATORS MARKET BY VERTICAL (THOUSAND UNITS) 2020-2029
TABLE 43 ARGENTINA ACTUATORS MARKET BY TYPE (USD MILLIONS) 2020-2029
TABLE 44 ARGENTINA ACTUATORS MARKET BY TYPE (THOUSAND UNITS) 2020-2029
TABLE 45 ARGENTINA ACTUATORS MARKET BY APPLICATION (USD MILLIONS) 2020-2029
TABLE 46 ARGENTINA ACTUATORS MARKET BY APPLICATION (THOUSAND UNITS) 2020-2029
TABLE 47 ARGENTINA ACTUATORS MARKET BY ACTUATION (USD MILLIONS) 2019-2028
TABLE 48 ARGENTINA ACTUATORS MARKET BY ACTUATION (THOUSAND UNITS) 2019-2028
TABLE 49 ARGENTINA ACTUATORS MARKET BY VERTICAL (USD MILLIONS) 2020-2029
TABLE 50 ARGENTINA ACTUATORS MARKET BY VERTICAL (THOUSAND UNITS) 2020-2029
TABLE 51 COLOMBIA ACTUATORS MARKET BY TYPE (USD MILLIONS) 2020-2029
TABLE 52 COLOMBIA ACTUATORS MARKET BY TYPE (THOUSAND UNITS) 2020-2029
TABLE 53 COLOMBIA ACTUATORS MARKET BY APPLICATION (USD MILLIONS) 2020-2029
TABLE 54 COLOMBIA ACTUATORS MARKET BY APPLICATION (THOUSAND UNITS) 2020-2029
TABLE 55 COLOMBIA ACTUATORS MARKET BY ACTUATION (USD MILLIONS) 2019-2028
TABLE 56 COLOMBIA ACTUATORS MARKET BY ACTUATION (THOUSAND UNITS) 2019-2028
TABLE 57 COLOMBIA ACTUATORS MARKET BY VERTICAL (USD MILLIONS) 2020-2029
TABLE 58 COLOMBIA ACTUATORS MARKET BY VERTICAL (THOUSAND UNITS) 2020-2029
TABLE 59 REST OF SOUTH AMERICA ACTUATORS MARKET BY TYPE (USD MILLIONS) 2020-2029
TABLE 60 REST OF SOUTH AMERICA ACTUATORS MARKET BY TYPE (THOUSAND UNITS) 2020-2029
TABLE 61 REST OF SOUTH AMERICA ACTUATORS MARKET BY APPLICATION (USD MILLIONS) 2020-2029
TABLE 62 REST OF SOUTH AMERICA ACTUATORS MARKET BY APPLICATION (THOUSAND UNITS) 2020-2029
TABLE 63 REST OF SOUTH AMERICA ACTUATORS MARKET BY ACTUATION (USD MILLIONS) 2019-2028
TABLE 64 REST OF SOUTH AMERICA ACTUATORS MARKET BY ACTUATION (THOUSAND UNITS) 2019-2028
TABLE 65 REST OF SOUTH AMERICA ACTUATORS MARKET BY VERTICAL (USD MILLIONS) 2020-2029
TABLE 66 REST OF SOUTH AMERICA ACTUATORS MARKET BY VERTICAL (THOUSAND UNITS) 2020-2029
TABLE 67 INDIA ACTUATORS MARKET BY TYPE (USD MILLIONS) 2020-2029
TABLE 68 INDIA ACTUATORS MARKET BY TYPE (THOUSAND UNITS) 2020-2029
TABLE 69 INDIA ACTUATORS MARKET BY APPLICATION (USD MILLIONS) 2020-2029
TABLE 70 INDIA ACTUATORS MARKET BY APPLICATION (THOUSAND UNITS) 2020-2029
TABLE 71 INDIA ACTUATORS MARKET BY ACTUATION (USD MILLIONS) 2019-2028
TABLE 72 INDIA ACTUATORS MARKET BY ACTUATION (THOUSAND UNITS) 2019-2028
TABLE 73 INDIA ACTUATORS MARKET BY VERTICAL (USD MILLIONS) 2020-2029
TABLE 74 INDIA ACTUATORS MARKET BY VERTICAL (THOUSAND UNITS) 2020-2029
TABLE 75 CHINA ACTUATORS MARKET BY TYPE (USD MILLIONS) 2020-2029
TABLE 76 CHINA ACTUATORS MARKET BY TYPE (THOUSAND UNITS) 2020-2029
TABLE 77 CHINA ACTUATORS MARKET BY APPLICATION (USD MILLIONS) 2020-2029
TABLE 78 CHINA ACTUATORS MARKET BY APPLICATION (THOUSAND UNITS) 2020-2029
TABLE 79 CHINA ACTUATORS MARKET BY ACTUATION (USD MILLIONS) 2019-2028
TABLE 80 CHINA ACTUATORS MARKET BY ACTUATION (THOUSAND UNITS) 2019-2028
TABLE 81 CHINA ACTUATORS MARKET BY VERTICAL (USD MILLIONS) 2020-2029
TABLE 82 CHINA ACTUATORS MARKET BY VERTICAL (THOUSAND UNITS) 2020-2029
TABLE 83 JAPAN ACTUATORS MARKET BY TYPE (USD MILLIONS) 2020-2029
TABLE 84 JAPAN ACTUATORS MARKET BY TYPE (THOUSAND UNITS) 2020-2029
TABLE 85 JAPAN ACTUATORS MARKET BY APPLICATION (USD MILLIONS) 2020-2029
TABLE 86 JAPAN ACTUATORS MARKET BY APPLICATION (THOUSAND UNITS) 2020-2029
TABLE 87 JAPAN ACTUATORS MARKET BY ACTUATION (USD MILLIONS) 2019-2028
TABLE 88 JAPAN ACTUATORS MARKET BY ACTUATION (THOUSAND UNITS) 2019-2028
TABLE 89 JAPAN ACTUATORS MARKET BY VERTICAL (USD MILLIONS) 2020-2029
TABLE 90 JAPAN ACTUATORS MARKET BY VERTICAL (THOUSAND UNITS) 2020-2029
TABLE 91 SOUTH KOREA ACTUATORS MARKET BY TYPE (USD MILLIONS) 2020-2029
TABLE 92 SOUTH KOREA ACTUATORS MARKET BY TYPE (THOUSAND UNITS) 2020-2029
TABLE 93 SOUTH KOREA ACTUATORS MARKET BY APPLICATION (USD MILLIONS) 2020-2029
TABLE 94 SOUTH KOREA ACTUATORS MARKET BY APPLICATION (THOUSAND UNITS) 2020-2029
TABLE 95 SOUTH KOREA ACTUATORS MARKET BY ACTUATION (USD MILLIONS) 2019-2028
TABLE 96 SOUTH KOREA ACTUATORS MARKET BY ACTUATION (THOUSAND UNITS) 2019-2028
TABLE 97 SOUTH KOREA ACTUATORS MARKET BY VERTICAL (USD MILLIONS) 2020-2029
TABLE 98 SOUTH KOREA ACTUATORS MARKET BY VERTICAL (THOUSAND UNITS) 2020-2029
TABLE 99 AUSTRALIA ACTUATORS MARKET BY TYPE (USD MILLIONS) 2020-2029
TABLE 100 AUSTRALIA ACTUATORS MARKET BY TYPE (THOUSAND UNITS) 2020-2029
TABLE 101 AUSTRALIA ACTUATORS MARKET BY APPLICATION (USD MILLIONS) 2020-2029
TABLE 102 AUSTRALIA ACTUATORS MARKET BY APPLICATION (THOUSAND UNITS) 2020-2029
TABLE 103 AUSTRALIA ACTUATORS MARKET BY ACTUATION (USD MILLIONS) 2019-2028
TABLE 104 AUSTRALIA ACTUATORS MARKET BY ACTUATION (THOUSAND UNITS) 2019-2028
TABLE 105 AUSTRALIA ACTUATORS MARKET BY VERTICAL (USD MILLIONS) 2020-2029
TABLE 106 AUSTRALIA ACTUATORS MARKET BY VERTICAL (THOUSAND UNITS) 2020-2029
TABLE 107 SOUTH-EAST ASIA ACTUATORS MARKET BY TYPE (USD MILLIONS) 2020-2029
TABLE 108 SOUTH-EAST ASIA ACTUATORS MARKET BY TYPE (THOUSAND UNITS) 2020-2029
TABLE 109 SOUTH-EAST ASIA ACTUATORS MARKET BY APPLICATION (USD MILLIONS) 2020-2029
TABLE 110 SOUTH-EAST ASIA ACTUATORS MARKET BY APPLICATION (THOUSAND UNITS) 2020-2029
TABLE 111 SOUTH-EAST ASIA ACTUATORS MARKET BY ACTUATION (USD MILLIONS) 2019-2028
TABLE 112 SOUTH-EAST ASIA ACTUATORS MARKET BY ACTUATION (THOUSAND UNITS) 2019-2028
TABLE 113 SOUTH-EAST ASIA ACTUATORS MARKET BY VERTICAL (USD MILLIONS) 2020-2029
TABLE 114 SOUTH-EAST ASIA ACTUATORS MARKET BY VERTICAL (THOUSAND UNITS) 2020-2029
TABLE 115 REST OF ASIA PACIFIC ACTUATORS MARKET BY TYPE (USD MILLIONS) 2020-2029
TABLE 116 REST OF ASIA PACIFIC ACTUATORS MARKET BY TYPE (THOUSAND UNITS) 2020-2029
TABLE 117 REST OF ASIA PACIFIC ACTUATORS MARKET BY APPLICATION (USD MILLIONS) 2020-2029
TABLE 118 REST OF ASIA PACIFIC ACTUATORS MARKET BY APPLICATION (THOUSAND UNITS) 2020-2029
TABLE 119 REST OF ASIA PACIFIC ACTUATORS MARKET BY ACTUATION (USD MILLIONS) 2019-2028
TABLE 120 REST OF ASIA PACIFIC ACTUATORS MARKET BY ACTUATION (THOUSAND UNITS) 2019-2028
TABLE 121 REST OF ASIA PACIFIC ACTUATORS MARKET BY VERTICAL (USD MILLIONS) 2020-2029
TABLE 122 REST OF ASIA PACIFIC ACTUATORS MARKET BY VERTICAL (THOUSAND UNITS) 2020-2029
TABLE 123 GERMANY ACTUATORS MARKET BY TYPE (USD MILLIONS) 2020-2029
TABLE 124 GERMANY ACTUATORS MARKET BY TYPE (THOUSAND UNITS) 2020-2029
TABLE 125 GERMANY ACTUATORS MARKET BY APPLICATION (USD MILLIONS) 2020-2029
TABLE 126 GERMANY ACTUATORS MARKET BY APPLICATION (THOUSAND UNITS) 2020-2029
TABLE 127 GERMANY ACTUATORS MARKET BY ACTUATION (USD MILLIONS) 2019-2028
TABLE 128 GERMANY ACTUATORS MARKET BY ACTUATION (THOUSAND UNITS) 2019-2028
TABLE 129 GERMANY ACTUATORS MARKET BY VERTICAL (USD MILLIONS) 2020-2029
TABLE 130 GERMANY ACTUATORS MARKET BY VERTICAL (THOUSAND UNITS) 2020-2029
TABLE 131 UK ACTUATORS MARKET BY TYPE (USD MILLIONS) 2020-2029
TABLE 132 UK ACTUATORS MARKET BY TYPE (THOUSAND UNITS) 2020-2029
TABLE 133 UK ACTUATORS MARKET BY APPLICATION (USD MILLIONS) 2020-2029
TABLE 134 UK ACTUATORS MARKET BY APPLICATION (THOUSAND UNITS) 2020-2029
TABLE 135 UK ACTUATORS MARKET BY ACTUATION (USD MILLIONS) 2019-2028
TABLE 136 UK ACTUATORS MARKET BY ACTUATION (THOUSAND UNITS) 2019-2028
TABLE 137 UK ACTUATORS MARKET BY VERTICAL (USD MILLIONS) 2020-2029
TABLE 138 UK ACTUATORS MARKET BY VERTICAL (THOUSAND UNITS) 2020-2029
TABLE 139 FRANCE ACTUATORS MARKET BY TYPE (USD MILLIONS) 2020-2029
TABLE 140 FRANCE ACTUATORS MARKET BY TYPE (THOUSAND UNITS) 2020-2029
TABLE 141 FRANCE ACTUATORS MARKET BY APPLICATION (USD MILLIONS) 2020-2029
TABLE 142 FRANCE ACTUATORS MARKET BY APPLICATION (THOUSAND UNITS) 2020-2029
TABLE 143 FRANCE ACTUATORS MARKET BY ACTUATION (USD MILLIONS) 2019-2028
TABLE 144 FRANCE ACTUATORS MARKET BY ACTUATION (THOUSAND UNITS) 2019-2028
TABLE 145 FRANCE ACTUATORS MARKET BY VERTICAL (USD MILLIONS) 2020-2029
TABLE 146 FRANCE ACTUATORS MARKET BY VERTICAL (THOUSAND UNITS) 2020-2029
TABLE 147 ITALY ACTUATORS MARKET BY TYPE (USD MILLIONS) 2020-2029
TABLE 148 ITALY ACTUATORS MARKET BY TYPE (THOUSAND UNITS) 2020-2029
TABLE 149 ITALY ACTUATORS MARKET BY APPLICATION (USD MILLIONS) 2020-2029
TABLE 150 ITALY ACTUATORS MARKET BY APPLICATION (THOUSAND UNITS) 2020-2029
TABLE 151 ITALY ACTUATORS MARKET BY ACTUATION (USD MILLIONS) 2019-2028
TABLE 152 ITALY ACTUATORS MARKET BY ACTUATION (THOUSAND UNITS) 2019-2028
TABLE 153 ITALY ACTUATORS MARKET BY VERTICAL (USD MILLIONS) 2020-2029
TABLE 154 ITALY ACTUATORS MARKET BY VERTICAL (THOUSAND UNITS) 2020-2029
TABLE 155 SPAIN ACTUATORS MARKET BY TYPE (USD MILLIONS) 2020-2029
TABLE 156 SPAIN ACTUATORS MARKET BY TYPE (THOUSAND UNITS) 2020-2029
TABLE 157 SPAIN ACTUATORS MARKET BY APPLICATION (USD MILLIONS) 2020-2029
TABLE 158 SPAIN ACTUATORS MARKET BY APPLICATION (THOUSAND UNITS) 2020-2029
TABLE 159 SPAIN ACTUATORS MARKET BY ACTUATION (USD MILLIONS) 2019-2028
TABLE 160 SPAIN ACTUATORS MARKET BY ACTUATION (THOUSAND UNITS) 2019-2028
TABLE 161 SPAIN ACTUATORS MARKET BY VERTICAL (USD MILLIONS) 2020-2029
TABLE 162 SPAIN ACTUATORS MARKET BY VERTICAL (THOUSAND UNITS) 2020-2029
TABLE 163 RUSSIA ACTUATORS MARKET BY TYPE (USD MILLIONS) 2020-2029
TABLE 164 RUSSIA ACTUATORS MARKET BY TYPE (THOUSAND UNITS) 2020-2029
TABLE 165 RUSSIA ACTUATORS MARKET BY APPLICATION (USD MILLIONS) 2020-2029
TABLE 166 RUSSIA ACTUATORS MARKET BY APPLICATION (THOUSAND UNITS) 2020-2029
TABLE 167 RUSSIA ACTUATORS MARKET BY ACTUATION (USD MILLIONS) 2019-2028
TABLE 168 RUSSIA ACTUATORS MARKET BY ACTUATION (THOUSAND UNITS) 2019-2028
TABLE 169 RUSSIA ACTUATORS MARKET BY VERTICAL (USD MILLIONS) 2020-2029
TABLE 170 RUSSIA ACTUATORS MARKET BY VERTICAL (THOUSAND UNITS) 2020-2029
TABLE 171 REST OF EUROPE ACTUATORS MARKET BY TYPE (USD MILLIONS) 2020-2029
TABLE 172 REST OF EUROPE ACTUATORS MARKET BY TYPE (THOUSAND UNITS) 2020-2029
TABLE 173 REST OF EUROPE ACTUATORS MARKET BY APPLICATION (USD MILLIONS) 2020-2029
TABLE 174 REST OF EUROPE ACTUATORS MARKET BY APPLICATION (THOUSAND UNITS) 2020-2029
TABLE 175 REST OF EUROPE ACTUATORS MARKET BY ACTUATION (USD MILLIONS) 2019-2028
TABLE 176 REST OF EUROPE ACTUATORS MARKET BY ACTUATION (THOUSAND UNITS) 2019-2028
TABLE 177 REST OF EUROPE ACTUATORS MARKET BY VERTICAL (USD MILLIONS) 2020-2029
TABLE 178 REST OF EUROPE ACTUATORS MARKET BY VERTICAL (THOUSAND UNITS) 2020-2029
TABLE 179 UAE ACTUATORS MARKET BY TYPE (USD MILLIONS) 2020-2029
TABLE 180 UAE ACTUATORS MARKET BY TYPE (THOUSAND UNITS) 2020-2029
TABLE 181 UAE ACTUATORS MARKET BY APPLICATION (USD MILLIONS) 2020-2029
TABLE 182 UAE ACTUATORS MARKET BY APPLICATION (THOUSAND UNITS) 2020-2029
TABLE 183 UAE ACTUATORS MARKET BY ACTUATION (USD MILLIONS) 2019-2028
TABLE 184 UAE ACTUATORS MARKET BY ACTUATION (THOUSAND UNITS) 2019-2028
TABLE 185 UAE ACTUATORS MARKET BY VERTICAL (USD MILLIONS) 2020-2029
TABLE 186 UAE ACTUATORS MARKET BY VERTICAL (THOUSAND UNITS) 2020-2029
TABLE 187 SAUDI ARABIA ACTUATORS MARKET BY TYPE (USD MILLIONS) 2020-2029
TABLE 188 SAUDI ARABIA ACTUATORS MARKET BY TYPE (THOUSAND UNITS) 2020-2029
TABLE 189 SAUDI ARABIA ACTUATORS MARKET BY APPLICATION (USD MILLIONS) 2020-2029
TABLE 190 SAUDI ARABIA ACTUATORS MARKET BY APPLICATION (THOUSAND UNITS) 2020-2029
TABLE 191 SAUDI ARABIA ACTUATORS MARKET BY ACTUATION (USD MILLIONS) 2019-2028
TABLE 192 SAUDI ARABIA ACTUATORS MARKET BY ACTUATION (THOUSAND UNITS) 2019-2028
TABLE 193 SAUDI ARABIA ACTUATORS MARKET BY VERTICAL (USD MILLIONS) 2020-2029
TABLE 194 SAUDI ARABIA ACTUATORS MARKET BY VERTICAL (THOUSAND UNITS) 2020-2029
TABLE 195 SOUTH AFRICA ACTUATORS MARKET BY TYPE (USD MILLIONS) 2020-2029
TABLE 196 SOUTH AFRICA ACTUATORS MARKET BY TYPE (THOUSAND UNITS) 2020-2029
TABLE 197 SOUTH AFRICA ACTUATORS MARKET BY APPLICATION (USD MILLIONS) 2020-2029
TABLE 198 SOUTH AFRICA ACTUATORS MARKET BY APPLICATION (THOUSAND UNITS) 2020-2029
TABLE 199 SOUTH AFRICA ACTUATORS MARKET BY ACTUATION (USD MILLIONS) 2019-2028
TABLE 200 SOUTH AFRICA ACTUATORS MARKET BY ACTUATION (THOUSAND UNITS) 2019-2028
TABLE 201 SOUTH AFRICA ACTUATORS MARKET BY VERTICAL (USD MILLIONS) 2020-2029
TABLE 202 SOUTH AFRICA ACTUATORS MARKET BY VERTICAL (THOUSAND UNITS) 2020-2029
TABLE 203 REST OF MIDDLE EAST AND AFRICA ACTUATORS MARKET BY TYPE (USD MILLIONS) 2020-2029
TABLE 204 REST OF MIDDLE EAST AND AFRICA ACTUATORS MARKET BY TYPE (THOUSAND UNITS) 2020-2029
TABLE 205 REST OF MIDDLE EAST AND AFRICA ACTUATORS MARKET BY APPLICATION (USD MILLIONS) 2020-2029
TABLE 206 REST OF MIDDLE EAST AND AFRICA ACTUATORS MARKET BY APPLICATION (THOUSAND UNITS) 2020-2029
TABLE 207 REST OF MIDDLE EAST AND AFRICA ACTUATORS MARKET BY ACTUATION (USD MILLIONS) 2019-2028
TABLE 208 REST OF MIDDLE EAST AND AFRICA ACTUATORS MARKET BY ACTUATION (THOUSAND UNITS) 2019-2028
TABLE 209 REST OF MIDDLE EAST AND AFRICA ACTUATORS MARKET BY VERTICAL (USD MILLIONS) 2020-2029
TABLE 210 REST OF MIDDLE EAST AND AFRICA ACTUATORS MARKET BY VERTICAL (THOUSAND UNITS) 2020-2029
図表一覧
図 1 市場のダイナミクス 図 2 市場のセグメンテーション 図 3 レポートのタイムライン: 検討対象年数 図 4 データの三角測量 図 5 ボトムアップアプローチ 図 6 トップダウンアプローチ 図 7 調査フロー 図 8 グローバルアクチュエータ市場 (タイプ別、百万米ドル、2020-2029 年) 図 9 グローバルアクチュエータ市場 (アプリケーション別、百万米ドル、2020-2029 年) 図 10 グローバルアクチュエータ市場 (アクチュエーション別、百万米ドル、2020-2029 年) 図 11 グローバルアクチュエータ市場 (業種別、百万米ドル、2020-2029 年) 図 12 グローバルアクチュエータ地域別市場、百万米ドル、2020-2029年 図13 ポーターの5つの力モデル 図14 北米アクチュエータ市場スナップショット 図15 ヨーロッパアクチュエータ市場スナップショット 図16 アジア太平洋アクチュエータ市場スナップショット 図17 南米アクチュエータ市場スナップショット 図18 中東およびアフリカアクチュエータ市場スナップショット 図19 ZF FRIEDRICHSHAFEN AG:企業スナップショット 図20 HELLA KGAA:企業スナップショット 図21 CONTINENTAL AG:企業スナップショット 図22 DENSO CORPORATION:企業スナップショット図 23 ロバート・ボッシュ GMBH: 会社スナップショット図 24 デルファイ・オートモーティブ PLC: 会社スナップショット図 25 日立オートモティブシステムズ LTD: 会社スナップショット図 26 マグナ・インターナショナル: 会社スナップショット図 27 ボルグ・ワーナー社: 会社スナップショット図 28 ジョンソン・エレクトリック: 会社スナップショット図 29 マーレ GMBH: 会社スナップショット図 30 三菱商事: 会社スナップショット図 31 日本電産モーターズ&アクチュエーターズ: 会社スナップショット
DOWNLOAD FREE SAMPLE REPORT
License Type
SPEAK WITH OUR ANALYST
Want to know more about the report or any specific requirement?
WANT TO CUSTOMIZE THE REPORT?
Our Clients Speak
We asked them to research ‘ Equipment market’ all over the world, and their whole arrangement was helpful to us. thehealthanalytics.com insightful analysis and reports contributed to our current analysis and in creating a future strategy. Besides, the te
Yosuke Mitsui
Senior Associate Construction Equipment Sales & Marketing
We asked them to research ‘Equipment market’ all over the world, and their whole arrangement was helpful to us. thehealthanalytics.com insightful analysis and reports contributed to our current analysis and in creating a future strategy. Besides, the te


