

Base Year Value ()
x.x %
x.x %
CAGR ()
x.x %
x.x %
Forecast Year Value ()
x.x %
x.x %
Historical Data Period
Largest Region
Forecast Period
ソナーシステム市場:製品タイプ別(船体搭載型、船尾搭載型、ソノブイ)、用途別(商用および防衛)、エンドユーザー別(ラインフィットおよびレトロフィット)、地域別(北米、ヨーロッパ、アジア太平洋、南米、中東、アフリカ)、グローバル機会分析および業界予測2022~2029年
Instant access to hundreds of data points and trends
- Market estimates from 2014-2029
- Competitive analysis, industry segmentation, financial benchmarks
- Incorporates SWOT, Porter's Five Forces and risk management frameworks
- PDF report or online database with Word, Excel and PowerPoint export options
- 100% money back guarantee
SONARシステム市場の概要
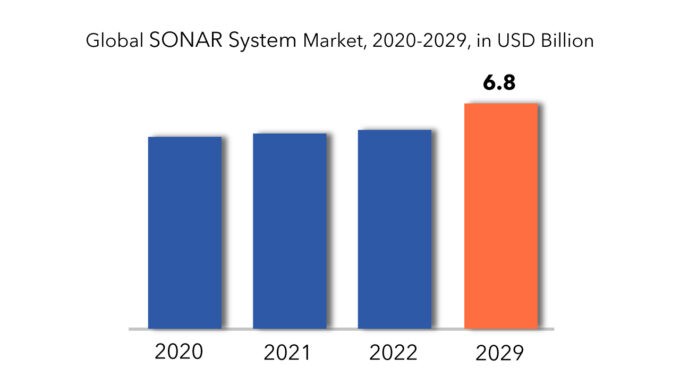
SONARシステム市場は 2020 年に 57 億 9,000 万米ドルに達すると推定され、2022 年から 2029 年にかけて 1.8% の CAGR で成長し、2029 年には 68 億米ドルに達すると予測されています。
SONAR (音響航法および測距) システムは、音波パルスを発射し、その結果生じる反響を分析することで、水中の物体を検出して位置を特定するために使用される技術装置です。コウモリが使用するエコーロケーション機構に類似した SONAR システムは、水中媒体に音波パルスを発射し、その後、水中の物体に反射してシステムに戻ります。音波の発射と受信の時間間隔を綿密に調査し、反響信号の属性と合わせて、SONAR システムは、水中の物体の距離、方向、寸法、形態など、関連する指標を確認します。
軍艦の分布が一貫して拡大していることから、ソナー システムの市場が拡大すると予想されます。軍艦は、精度の頂点に達するために、高度に洗練されたソナー システムのサブセットに依存しています。軍艦の領域では、ソナー システムは、機雷の検出、海底地形の分析、対潜水艦戦、ダイバーの検出、港のセキュリティなど、さまざまな目的に使用されます。異なるクラスの船舶では、特定の運用要件に合わせて調整されたさまざまなソナー構成が活用されています。たとえば、潜水艦は敵海域での秘密の操縦にパッシブ ソナーを使用しますが、フリゲート艦やコルベット艦などの船舶は、敵の検出にマルチスタティック ソナーを選択します。このような軍艦の分布の急増は、近い将来、ソナー システム市場の成長軌道にとって良い前兆です。
[キャプション id="attachment_9316" align="aligncenter" width="870"]
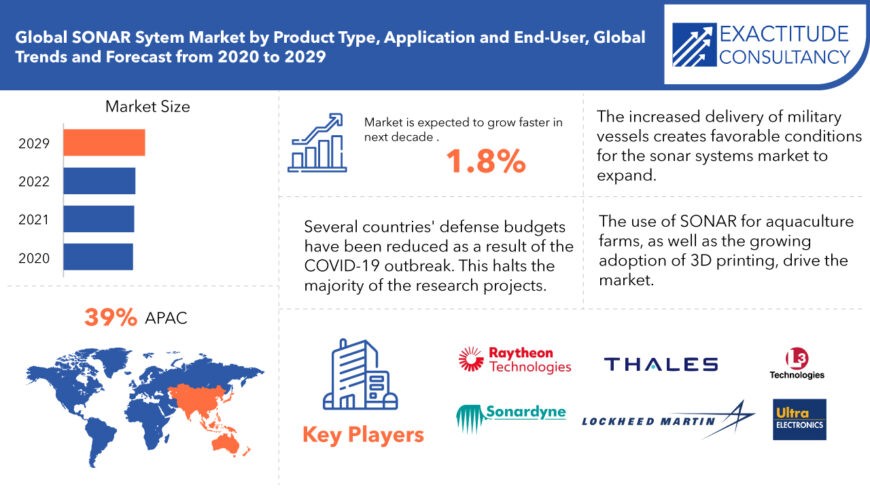
さらに、魚類監視に用いられるソナーシステムには、ディープニューラルネットワークアーキテクチャが組み込まれています。水産資源の増強を目的とした養殖施設での魚類監視の需要が急増しており、このような監視技術の必要性は高まっています。水中光学カメラを補完する高忠実度画像ソナー装置で構成されるディープニューラルネットワークソナーシステムは、日中の監視を容易にし、養殖方法の改善に貢献し、市場拡大を促進します。
[キャプション id="attachment_9317" align="aligncenter" width="680"]
SONAR System Market Segment Analysis
Based on product type, the market is segmented into hull-mounted, stern-mounted and sonobuoy. The hull-mounted segment consists of forward-looking sonar, echo sounders, and omni-directional sonar. The hull-mounted is the dominant segment in SONAR system market. The increased demand for forward-looking sonar in defense vessels is attributed to the growth. Such systems are used to improve the efficiency of naval ships through vessel traffic management services. The Sonobuoy segment will experience rapid growth as the navy's ability to combat submarine attack threats improves. The stern-mounted segment is expected to grow significantly as demand for towed array sonar systems for surveillance and reconnaissance activities rises.
By application, the market is divided into commercial and defense. The commercial segment is expected to grow the fastest during the forecast period. This expansion can be attributed to rising demand for oil and gas survey applications such as hydrographic surveys, fish chirp sonars, and improving overall ship delivery and retrofitting operations. The increase in defense sector can be attributed to the increased use of sonars for mine detection, countermeasure operations, and port security.
The market is divided into two segments based on end-user: line fit and retrofit. During the forecast period, the line-fit segment is expected to grow the fastest. The driver is the increased demand for naval vessels outfitted with advanced sonar systems. The expansion of retrofit segment can be attributed to an increase in the upgrade of connected systems for conventional naval ships.
SONAR System Market Players
The key market players in SONAR system include Thales Group (France), Atlas Elektronik GmbH (Germany), Raytheon Company (US), Lockheed Martin (US), L-3 Technologies Inc. (US) and Ultra Electronics (UK). Major players in the hydrographic sonar market include Kongsberg Gruppen ASA (Norway), Teledyne Technologies Inc. (US), and Sonardyne (UK). Navigation and fisheries sonars are provided by Furuno Electric Co., Ltd. (Japan), Japan Radio Company (Japan), Navico (Norway), and FLIR Systems (US).
New strategies such as product launches, enhancements, partnerships, collaborations, and strategic acquisitions were adopted by market players to strengthen their product portfolios and maintain a competitive position in the market.
Who Should Buy? Or Key Stakeholders
- Defense
- Hydrographic Charting
- Offshore Oil and Gas Industries
- Port and Harbor Management
- Coastal Engineering Companies
- Others
Key Takeaways
- The SONAR system market is estimated to grow at a CAGR of 1.8%
- Based on product type, the hull-mounted is the dominant segment in SONAR system market.
- Based on application, the commercial segment is expected to grow the fastest during the forecast period.
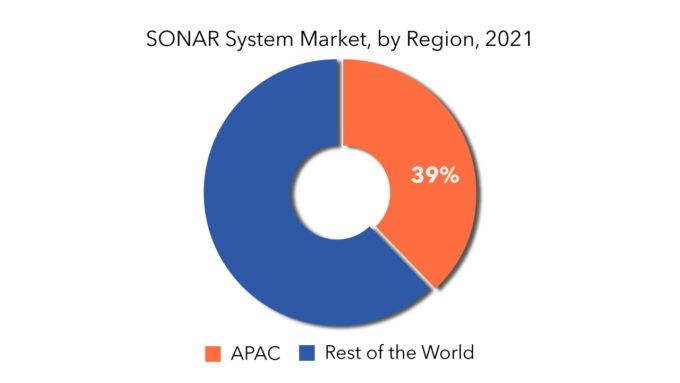
- Asia Pacific dominated the regional market share.
- The major trend in the SONAR system market is the integration of advanced signal processing algorithms for enhanced detection and classification capabilities.
SONAR System Market Regional Analysis
Geographically, the SONAR SYSTEM market is segmented into North America, South America, Europe, Asia Pacific and Middle East & Africa (MEA). Asia Pacific is expected to dominate the SONAR system market due to numerous factors such as a large consumer base and industrialization & urbanization.
- Asia Pacific: includes China, Japan, South Korea, India, Australia, and Rest of APAC
- Europe: includes UK, Germany, France, Italy, Spain, and Rest of Europe
- North America: includes the US, Canada, Mexico
- South America: Brazil and Rest of South America
- Middle East & Africa: includes Saudi Arabia, South Africa, and Rest of MEA
[caption id="attachment_9318" align="alignnone" width="680"]
SONAR System Market | Exactitude Consultancy [/caption]
Key Market Segments: Global Sonar System Market
SONAR System Market by Product Type, 2022-2029 (In USD Million, Thousand Units)- Hull-Mounted
- Stern-Mounted
- Sonobouy
- Commercial
- Defense
- Line Fit
- Retrofit
- Asia Pacific
- Europe
- North America
- South America
- Middle East And Africa
Key Question Answered
- What is the current scenario of the global SONAR system market?
- What are the emerging technologies for the development of SONAR system market?
- What are the historical size and the present size of the market segments and their future potential?
- What are the major catalysts for the market and their impact during the short, medium, and long terms?
- What are the evolving opportunities for the players in the market?
- Which are the key regions from the investment perspective?
- What are the key strategies being adopted by the major players to up their market shares?
- 導入
- 市場の定義
- 市場セグメンテーション
- 研究タイムライン
- 前提と制限
- 研究方法
- データマイニング
- 二次調査
- 一次研究
- 専門家のアドバイス
- 品質チェック
- 最終レビュー
- データの三角測量
- ボトムアップアプローチ
- トップダウンアプローチ
- 研究の流れ
- データソース
- データマイニング
- エグゼクティブサマリー
- 市場概要
- 世界のソナーシステム市場の見通し
- 市場の推進要因
- 市場の制約
- 市場機会
- ソナーシステム市場へのCOVID-19の影響
- ポーターの5つの力モデル
- 新規参入者からの脅威
- 代替品からの脅威
- サプライヤーの交渉力
- 顧客の交渉力
- 競争の度合い
- 業界バリューチェーン分析
- 世界のソナーシステム市場の見通し
- 製品タイプ別世界のソナーシステム市場
- 船体搭載型
- 船尾搭載型
- ソノブイ
- 用途別世界ソナーシステム市場
- コマーシャル
- 防衛
- エンドユーザー別世界ソナーシステム市場
- ラインフィット
- 改造
- 地域別世界ソナーシステム市場
- 北米
- 私たち
- カナダ
- メキシコ
- 南アメリカ
- ブラジル
- 南米のその他の地域
- ヨーロッパ
- ドイツ
- 英国
- フランス
- イタリア
- スペイン
- その他のヨーロッパ
- アジア太平洋
- インド
- 中国
- 日本
- 韓国
- オーストラリア
- その他のアジア太平洋地域
- 中東およびアフリカ
- サウジアラビア
- 南アフリカ
- その他の中東およびアフリカ
- 北米
- 会社概要*(事業概要、会社概要、提供製品、最近の動向)
- タレスグループ
- アトラスエレクトロニック株式会社
- レイセオン社
- ロッキード・マーティン
- L-3テクノロジーズ株式会社
- ウルトラエレクトロニクス
- コングスベルグ・グルッペン ASA
- テレダインテクノロジーズ株式会社
- ソナーダイン
- 古野電気株式会社
- 日本無線株式会社
- ナビコ
- FLIRシステム
*企業リストは参考です
表のリスト
TABLE 1 GLOBAL SONAR SYSTEM MARKET BY APPLICATION (USD MILLIONS) 2020-2029
TABLE 2 GLOBAL SONAR SYSTEM MARKET BY APPLICATION (THOUSAND UNITS) 2020-2029
TABLE 3 GLOBAL SONAR SYSTEM MARKET BY PRODUCT TYPE (USD MILLIONS) 2020-2029
TABLE 4 GLOBAL SONAR SYSTEM MARKET BY PRODUCT TYPE (THOUSAND UNITS) 2020-2029
TABLE 5 GLOBAL SONAR SYSTEM MARKET BY END USER (USD MILLIONS) 2020-2029
TABLE 6 GLOBAL SONAR SYSTEM MARKET BY END USER (THOUSAND UNITS) 2020-2029
TABLE 7 US SONAR SYSTEM MARKET BY APPLICATION (USD MILLIONS) 2020-2029
TABLE 8 US SONAR SYSTEM MARKET BY APPLICATION (THOUSAND UNITS) 2020-2029
TABLE 9 US SONAR SYSTEM MARKET BY PRODUCT TYPE (USD MILLIONS) 2020-2029
TABLE 10 US SONAR SYSTEM MARKET BY PRODUCT TYPE (THOUSAND UNITS) 2020-2029
TABLE 11 US SONAR SYSTEM MARKET BY END USER (USD MILLIONS) 2020-2029
TABLE 12 US SONAR SYSTEM MARKET BY END USER (THOUSAND UNITS) 2020-2029
TABLE 13 CANADA SONAR SYSTEM MARKET BY APPLICATION (USD MILLIONS) 2020-2029
TABLE 14 CANADA SONAR SYSTEM MARKET BY APPLICATION (THOUSAND UNITS) 2020-2029
TABLE 15 CANADA SONAR SYSTEM MARKET BY PRODUCT TYPE (USD MILLIONS) 2020-2029
TABLE 16 CANADA SONAR SYSTEM MARKET BY PRODUCT TYPE (THOUSAND UNITS) 2020-2029
TABLE 17 CANADA SONAR SYSTEM MARKET BY END USER (USD MILLIONS) 2020-2029
TABLE 18 CANADA SONAR SYSTEM MARKET BY END USER (THOUSAND UNITS) 2020-2029
TABLE 19 MEXICO SONAR SYSTEM MARKET BY APPLICATION (USD MILLIONS) 2020-2029
TABLE 20 MEXICO SONAR SYSTEM MARKET BY APPLICATION (THOUSAND UNITS) 2020-2029
TABLE 21 MEXICO SONAR SYSTEM MARKET BY PRODUCT TYPE (USD MILLIONS) 2020-2029
TABLE 22 MEXICO SONAR SYSTEM MARKET BY PRODUCT TYPE (THOUSAND UNITS) 2020-2029
TABLE 23 MEXICO SONAR SYSTEM MARKET BY END USER (USD MILLIONS) 2020-2029
TABLE 24 MEXICO SONAR SYSTEM MARKET BY END USER (THOUSAND UNITS) 2020-2029
TABLE 25 BRAZIL SONAR SYSTEM MARKET BY APPLICATION (USD MILLIONS) 2020-2029
TABLE 26 BRAZIL SONAR SYSTEM MARKET BY APPLICATION (THOUSAND UNITS) 2020-2029
TABLE 27 BRAZIL SONAR SYSTEM MARKET BY PRODUCT TYPE (USD MILLIONS) 2020-2029
TABLE 28 BRAZIL SONAR SYSTEM MARKET BY PRODUCT TYPE (THOUSAND UNITS) 2020-2029
TABLE 29 BRAZIL SONAR SYSTEM MARKET BY END USER (USD MILLIONS) 2020-2029
TABLE 30 BRAZIL SONAR SYSTEM MARKET BY END USER (THOUSAND UNITS) 2020-2029
TABLE 31 ARGENTINA SONAR SYSTEM MARKET BY APPLICATION (USD MILLIONS) 2020-2029
TABLE 32 ARGENTINA SONAR SYSTEM MARKET BY APPLICATION (THOUSAND UNITS) 2020-2029
TABLE 33 ARGENTINA SONAR SYSTEM MARKET BY PRODUCT TYPE (USD MILLIONS) 2020-2029
TABLE 34 ARGENTINA SONAR SYSTEM MARKET BY PRODUCT TYPE (THOUSAND UNITS) 2020-2029
TABLE 35 ARGENTINA SONAR SYSTEM MARKET BY END USER (USD MILLIONS) 2020-2029
TABLE 36 ARGENTINA SONAR SYSTEM MARKET BY END USER (THOUSAND UNITS) 2020-2029
TABLE 37 COLOMBIA SONAR SYSTEM MARKET BY APPLICATION (USD MILLIONS) 2020-2029
TABLE 38 COLOMBIA SONAR SYSTEM MARKET BY APPLICATION (THOUSAND UNITS) 2020-2029
TABLE 39 COLOMBIA SONAR SYSTEM MARKET BY PRODUCT TYPE (USD MILLIONS) 2020-2029
TABLE 40 COLOMBIA SONAR SYSTEM MARKET BY PRODUCT TYPE (THOUSAND UNITS) 2020-2029
TABLE 41 COLOMBIA SONAR SYSTEM MARKET BY END USER (USD MILLIONS) 2020-2029
TABLE 42 COLOMBIA SONAR SYSTEM MARKET BY END USER (THOUSAND UNITS) 2020-2029
TABLE 43 REST OF SOUTH AMERICA SONAR SYSTEM MARKET BY APPLICATION (USD MILLIONS) 2020-2029
TABLE 44 REST OF SOUTH AMERICA SONAR SYSTEM MARKET BY APPLICATION (THOUSAND UNITS) 2020-2029
TABLE 45 REST OF SOUTH AMERICA SONAR SYSTEM MARKET BY PRODUCT TYPE (USD MILLIONS) 2020-2029
TABLE 46 REST OF SOUTH AMERICA SONAR SYSTEM MARKET BY PRODUCT TYPE (THOUSAND UNITS) 2020-2029
TABLE 47 REST OF SOUTH AMERICA SONAR SYSTEM MARKET BY END USER (USD MILLIONS) 2020-2029
TABLE 48 REST OF SOUTH AMERICA SONAR SYSTEM MARKET BY END USER (THOUSAND UNITS) 2020-2029
TABLE 49 INDIA SONAR SYSTEM MARKET BY APPLICATION (USD MILLIONS) 2020-2029
TABLE 50 INDIA SONAR SYSTEM MARKET BY APPLICATION (THOUSAND UNITS) 2020-2029
TABLE 51 INDIA SONAR SYSTEM MARKET BY PRODUCT TYPE (USD MILLIONS) 2020-2029
TABLE 52 INDIA SONAR SYSTEM MARKET BY PRODUCT TYPE (THOUSAND UNITS) 2020-2029
TABLE 53 INDIA SONAR SYSTEM MARKET BY END USER (USD MILLIONS) 2020-2029
TABLE 54 INDIA SONAR SYSTEM MARKET BY END USER (THOUSAND UNITS) 2020-2029
TABLE 55 CHINA SONAR SYSTEM MARKET BY APPLICATION (USD MILLIONS) 2020-2029
TABLE 56 CHINA SONAR SYSTEM MARKET BY APPLICATION (THOUSAND UNITS) 2020-2029
TABLE 57 CHINA SONAR SYSTEM MARKET BY PRODUCT TYPE (USD MILLIONS) 2020-2029
TABLE 58 CHINA SONAR SYSTEM MARKET BY PRODUCT TYPE (THOUSAND UNITS) 2020-2029
TABLE 59 CHINA SONAR SYSTEM MARKET BY END USER (USD MILLIONS) 2020-2029
TABLE 60 CHINA SONAR SYSTEM MARKET BY END USER (THOUSAND UNITS) 2020-2029
TABLE 61 JAPAN SONAR SYSTEM MARKET BY APPLICATION (USD MILLIONS) 2020-2029
TABLE 62 JAPAN SONAR SYSTEM MARKET BY APPLICATION (THOUSAND UNITS) 2020-2029
TABLE 63 JAPAN SONAR SYSTEM MARKET BY PRODUCT TYPE (USD MILLIONS) 2020-2029
TABLE 64 JAPAN SONAR SYSTEM MARKET BY PRODUCT TYPE (THOUSAND UNITS) 2020-2029
TABLE 65 JAPAN SONAR SYSTEM MARKET BY END USER (USD MILLIONS) 2020-2029
TABLE 66 JAPAN SONAR SYSTEM MARKET BY END USER (THOUSAND UNITS) 2020-2029
TABLE 67 SOUTH KOREA SONAR SYSTEM MARKET BY APPLICATION (USD MILLIONS) 2020-2029
TABLE 68 SOUTH KOREA SONAR SYSTEM MARKET BY APPLICATION (THOUSAND UNITS) 2020-2029
TABLE 69 SOUTH KOREA SONAR SYSTEM MARKET BY PRODUCT TYPE (USD MILLIONS) 2020-2029
TABLE 70 SOUTH KOREA SONAR SYSTEM MARKET BY PRODUCT TYPE (THOUSAND UNITS) 2020-2029
TABLE 71 SOUTH KOREA SONAR SYSTEM MARKET BY END USER (USD MILLIONS) 2020-2029
TABLE 72 SOUTH KOREA SONAR SYSTEM MARKET BY END USER (THOUSAND UNITS) 2020-2029
TABLE 73 AUSTRALIA SONAR SYSTEM MARKET BY APPLICATION (USD MILLIONS) 2020-2029
TABLE 74 AUSTRALIA SONAR SYSTEM MARKET BY APPLICATION (THOUSAND UNITS) 2020-2029
TABLE 75 AUSTRALIA SONAR SYSTEM MARKET BY PRODUCT TYPE (USD MILLIONS) 2020-2029
TABLE 76 AUSTRALIA SONAR SYSTEM MARKET BY PRODUCT TYPE (THOUSAND UNITS) 2020-2029
TABLE 77 AUSTRALIA SONAR SYSTEM MARKET BY END USER (USD MILLIONS) 2020-2029
TABLE 78 AUSTRALIA SONAR SYSTEM MARKET BY END USER (THOUSAND UNITS) 2020-2029
TABLE 79 SOUTH-EAST ASIA SONAR SYSTEM MARKET BY APPLICATION (USD MILLIONS) 2020-2029
TABLE 80 SOUTH-EAST ASIA SONAR SYSTEM MARKET BY APPLICATION (THOUSAND UNITS) 2020-2029
TABLE 81 SOUTH-EAST ASIA SONAR SYSTEM MARKET BY PRODUCT TYPE (USD MILLIONS) 2020-2029
TABLE 82 SOUTH-EAST ASIA SONAR SYSTEM MARKET BY PRODUCT TYPE (THOUSAND UNITS) 2020-2029
TABLE 83 SOUTH-EAST ASIA SONAR SYSTEM MARKET BY END USER (USD MILLIONS) 2020-2029
TABLE 84 SOUTH-EAST ASIA SONAR SYSTEM MARKET BY END USER (THOUSAND UNITS) 2020-2029
TABLE 85 REST OF ASIA PACIFIC SONAR SYSTEM MARKET BY APPLICATION (USD MILLIONS) 2020-2029
TABLE 86 REST OF ASIA PACIFIC SONAR SYSTEM MARKET BY APPLICATION (THOUSAND UNITS) 2020-2029
TABLE 87 REST OF ASIA PACIFIC SONAR SYSTEM MARKET BY PRODUCT TYPE (USD MILLIONS) 2020-2029
TABLE 88 REST OF ASIA PACIFIC SONAR SYSTEM MARKET BY PRODUCT TYPE (THOUSAND UNITS) 2020-2029
TABLE 89 REST OF ASIA PACIFIC SONAR SYSTEM MARKET BY END USER (USD MILLIONS) 2020-2029
TABLE 90 REST OF ASIA PACIFIC SONAR SYSTEM MARKET BY END USER (THOUSAND UNITS) 2020-2029
TABLE 91 GERMANY SONAR SYSTEM MARKET BY APPLICATION (USD MILLIONS) 2020-2029
TABLE 92 GERMANY SONAR SYSTEM MARKET BY APPLICATION (THOUSAND UNITS) 2020-2029
TABLE 93 GERMANY SONAR SYSTEM MARKET BY PRODUCT TYPE (USD MILLIONS) 2020-2029
TABLE 94 GERMANY SONAR SYSTEM MARKET BY PRODUCT TYPE (THOUSAND UNITS) 2020-2029
TABLE 95 GERMANY SONAR SYSTEM MARKET BY END USER (USD MILLIONS) 2020-2029
TABLE 96 GERMANY SONAR SYSTEM MARKET BY END USER (THOUSAND UNITS) 2020-2029
TABLE 97 UK SONAR SYSTEM MARKET BY APPLICATION (USD MILLIONS) 2020-2029
TABLE 98 UK SONAR SYSTEM MARKET BY APPLICATION (THOUSAND UNITS) 2020-2029
TABLE 99 UK SONAR SYSTEM MARKET BY PRODUCT TYPE (USD MILLIONS) 2020-2029
TABLE 100 UK SONAR SYSTEM MARKET BY PRODUCT TYPE (THOUSAND UNITS) 2020-2029
TABLE 101 UK SONAR SYSTEM MARKET BY END USER (USD MILLIONS) 2020-2029
TABLE 102 UK SONAR SYSTEM MARKET BY END USER (THOUSAND UNITS) 2020-2029
TABLE 103 FRANCE SONAR SYSTEM MARKET BY APPLICATION (USD MILLIONS) 2020-2029
TABLE 104 FRANCE SONAR SYSTEM MARKET BY APPLICATION (THOUSAND UNITS) 2020-2029
TABLE 105 FRANCE SONAR SYSTEM MARKET BY PRODUCT TYPE (USD MILLIONS) 2020-2029
TABLE 106 FRANCE SONAR SYSTEM MARKET BY PRODUCT TYPE (THOUSAND UNITS) 2020-2029
TABLE 107 FRANCE SONAR SYSTEM MARKET BY END USER (USD MILLIONS) 2020-2029
TABLE 108 FRANCE SONAR SYSTEM MARKET BY END USER (THOUSAND UNITS) 2020-2029
TABLE 109 ITALY SONAR SYSTEM MARKET BY APPLICATION (USD MILLIONS) 2020-2029
TABLE 110 ITALY SONAR SYSTEM MARKET BY APPLICATION (THOUSAND UNITS) 2020-2029
TABLE 111 ITALY SONAR SYSTEM MARKET BY PRODUCT TYPE (USD MILLIONS) 2020-2029
TABLE 112 ITALY SONAR SYSTEM MARKET BY PRODUCT TYPE (THOUSAND UNITS) 2020-2029
TABLE 113 ITALY SONAR SYSTEM MARKET BY END USER (USD MILLIONS) 2020-2029
TABLE 114 ITALY SONAR SYSTEM MARKET BY END USER (THOUSAND UNITS) 2020-2029
TABLE 115 SPAIN SONAR SYSTEM MARKET BY APPLICATION (USD MILLIONS) 2020-2029
TABLE 116 SPAIN SONAR SYSTEM MARKET BY APPLICATION (THOUSAND UNITS) 2020-2029
TABLE 117 SPAIN SONAR SYSTEM MARKET BY PRODUCT TYPE (USD MILLIONS) 2020-2029
TABLE 118 SPAIN SONAR SYSTEM MARKET BY PRODUCT TYPE (THOUSAND UNITS) 2020-2029
TABLE 119 SPAIN SONAR SYSTEM MARKET BY END USER (USD MILLIONS) 2020-2029
TABLE 120 SPAIN SONAR SYSTEM MARKET BY END USER (THOUSAND UNITS) 2020-2029
TABLE 121 RUSSIA SONAR SYSTEM MARKET BY APPLICATION (USD MILLIONS) 2020-2029
TABLE 122 RUSSIA SONAR SYSTEM MARKET BY APPLICATION (THOUSAND UNITS) 2020-2029
TABLE 123 RUSSIA SONAR SYSTEM MARKET BY PRODUCT TYPE (USD MILLIONS) 2020-2029
TABLE 124 RUSSIA SONAR SYSTEM MARKET BY PRODUCT TYPE (THOUSAND UNITS) 2020-2029
TABLE 125 RUSSIA SONAR SYSTEM MARKET BY END USER (USD MILLIONS) 2020-2029
TABLE 126 RUSSIA SONAR SYSTEM MARKET BY END USER (THOUSAND UNITS) 2020-2029
TABLE 127 REST OF EUROPE SONAR SYSTEM MARKET BY APPLICATION (USD MILLIONS) 2020-2029
TABLE 128 REST OF EUROPE SONAR SYSTEM MARKET BY APPLICATION (THOUSAND UNITS) 2020-2029
TABLE 129 REST OF EUROPE SONAR SYSTEM MARKET BY PRODUCT TYPE (USD MILLIONS) 2020-2029
TABLE 130 REST OF EUROPE SONAR SYSTEM MARKET BY PRODUCT TYPE (THOUSAND UNITS) 2020-2029
TABLE 131 REST OF EUROPE SONAR SYSTEM MARKET BY END USER (USD MILLIONS) 2020-2029
TABLE 132 REST OF EUROPE SONAR SYSTEM MARKET BY END USER (THOUSAND UNITS) 2020-2029
TABLE 133 UAE SONAR SYSTEM MARKET BY APPLICATION (USD MILLIONS) 2020-2029
TABLE 134 UAE SONAR SYSTEM MARKET BY APPLICATION (THOUSAND UNITS) 2020-2029
TABLE 135 UAE SONAR SYSTEM MARKET BY PRODUCT TYPE (USD MILLIONS) 2020-2029
TABLE 136 UAE SONAR SYSTEM MARKET BY PRODUCT TYPE (THOUSAND UNITS) 2020-2029
TABLE 137 UAE SONAR SYSTEM MARKET BY END USER (USD MILLIONS) 2020-2029
TABLE 138 UAE SONAR SYSTEM MARKET BY END USER (THOUSAND UNITS) 2020-2029
TABLE 139 SAUDI ARABIA SONAR SYSTEM MARKET BY APPLICATION (USD MILLIONS) 2020-2029
TABLE 140 SAUDI ARABIA SONAR SYSTEM MARKET BY APPLICATION (THOUSAND UNITS) 2020-2029
TABLE 141 SAUDI ARABIA SONAR SYSTEM MARKET BY PRODUCT TYPE (USD MILLIONS) 2020-2029
TABLE 142 SAUDI ARABIA SONAR SYSTEM MARKET BY PRODUCT TYPE (THOUSAND UNITS) 2020-2029
TABLE 143 SAUDI ARABIA SONAR SYSTEM MARKET BY END USER (USD MILLIONS) 2020-2029
TABLE 144 SAUDI ARABIA SONAR SYSTEM MARKET BY END USER (THOUSAND UNITS) 2020-2029
TABLE 145 SOUTH AFRICA SONAR SYSTEM MARKET BY APPLICATION (USD MILLIONS) 2020-2029
TABLE 146 SOUTH AFRICA SONAR SYSTEM MARKET BY APPLICATION (THOUSAND UNITS) 2020-2029
TABLE 147 SOUTH AFRICA SONAR SYSTEM MARKET BY PRODUCT TYPE (USD MILLIONS) 2020-2029
TABLE 148 SOUTH AFRICA SONAR SYSTEM MARKET BY PRODUCT TYPE (THOUSAND UNITS) 2020-2029
TABLE 149 SOUTH AFRICA SONAR SYSTEM MARKET BY END USER (USD MILLIONS) 2020-2029
TABLE 150 SOUTH AFRICA SONAR SYSTEM MARKET BY END USER (THOUSAND UNITS) 2020-2029
TABLE 151 REST OF MIDDLE EAST AND AFRICA SONAR SYSTEM MARKET BY APPLICATION (USD MILLIONS) 2020-2029
TABLE 152 REST OF MIDDLE EAST AND AFRICA SONAR SYSTEM MARKET BY APPLICATION (THOUSAND UNITS) 2020-2029
TABLE 153 REST OF MIDDLE EAST AND AFRICA SONAR SYSTEM MARKET BY PRODUCT TYPE (USD MILLIONS) 2020-2029
TABLE 154 REST OF MIDDLE EAST AND AFRICA SONAR SYSTEM MARKET BY PRODUCT TYPE (THOUSAND UNITS) 2020-2029
TABLE 155 REST OF MIDDLE EAST AND AFRICA SONAR SYSTEM MARKET BY END USER (USD MILLIONS) 2020-2029
TABLE 156 REST OF MIDDLE EAST AND AFRICA SONAR SYSTEM MARKET BY END USER (THOUSAND UNITS) 2020-2029
LIST OF FIGURES
FIGURE 1 MARKET DYNAMICS
FIGURE 2 MARKET SEGMENTATION
FIGURE 3 REPORT TIMELINES: YEARS CONSIDERED
FIGURE 4 DATA TRIANGULATION
FIGURE 5 BOTTOM-UP APPROACH
FIGURE 6 TOP-DOWN APPROACH
FIGURE 7 RESEARCH FLOW
FIGURE 8 GLOBAL SONAR SYSTEM MARKET BY PRODUCT TYPE, USD MILLION, 2020-2029
FIGURE 9 GLOBAL SONAR SYSTEM MARKET BY APPLICATION, USD MILLION, 2020-2029
FIGURE 10 GLOBAL SONAR SYSTEM MARKET BY END USER, USD MILLION, 2020-2029
FIGURE 11 GLOBAL SONAR SYSTEM MARKET BY REGION, USD MILLION, 2020-2029
FIGURE 12 PORTER’S FIVE FORCES MODEL
FIGURE 13 MARKET SHARE ANALYSIS
FIGURE 14 THALES GROUP: COMPANY SNAPSHOT
FIGURE 15 ATLAS ELECTRONIK GMBH: COMPANY SNAPSHOT
FIGURE 16 RAYTHEON COMPANY: COMPANY SNAPSHOT
FIGURE 17 LOCKHEED MARTIN: COMPANY SNAPSHOT
FIGURE 18 L-3 TECHNOLOGIES INC.: COMPANY SNAPSHOT
FIGURE 19 ULTRA ELECTRONICS: COMPANY SNAPSHOT
FIGURE 20 KONGSBERG GRUPPEN ASA: COMPANY SNAPSHOT
FIGURE 21 TELEDYNE TECHNOLOGIES INC.: COMPANY SNAPSHOT
FIGURE 22 SONARDYNE: COMPANY SNAPSHOT
FIGURE 23 FURUNO ELECTRIC CO. LTD.: COMPANY SNAPSHOT
FIGURE 24 JAPAN RADIO COMPANY: COMPANY SNAPSHOT
FIGURE 25 NAVICO: COMPANY SNAPSHOT
FIGURE 26 FLIR SYSTEMS: COMPANY SNAPSHOT
DOWNLOAD FREE SAMPLE REPORT
License Type
SPEAK WITH OUR ANALYST
Want to know more about the report or any specific requirement?
WANT TO CUSTOMIZE THE REPORT?
Our Clients Speak
We asked them to research ‘ Equipment market’ all over the world, and their whole arrangement was helpful to us. thehealthanalytics.com insightful analysis and reports contributed to our current analysis and in creating a future strategy. Besides, the te
Yosuke Mitsui
Senior Associate Construction Equipment Sales & Marketing
We asked them to research ‘Equipment market’ all over the world, and their whole arrangement was helpful to us. thehealthanalytics.com insightful analysis and reports contributed to our current analysis and in creating a future strategy. Besides, the te


