

Base Year Value ()
x.x %
x.x %
CAGR ()
x.x %
x.x %
Forecast Year Value ()
x.x %
x.x %
Historical Data Period
Largest Region
Forecast Period
기판(아크릴, 유리, PET(폴리에스터 필름), 폴리카보네이트(PC), 폴리아미드), 최종 사용자(건물 및 건설, 자동차, 항공 및 항공우주, 전자, 군사 및 보안, 의료 및 안전 산업, 기타) 및 지역(북미, 유럽, 아시아 태평양, 남미, 중동 및 아프리카)별 안개 방지 코팅 시장, 2023년부터 2029년까지의 글로벌 추세 및 예측.
Instant access to hundreds of data points and trends
- Market estimates from 2014-2029
- Competitive analysis, industry segmentation, financial benchmarks
- Incorporates SWOT, Porter's Five Forces and risk management frameworks
- PDF report or online database with Word, Excel and PowerPoint export options
- 100% money back guarantee
안개 방지 코팅 시장 개요
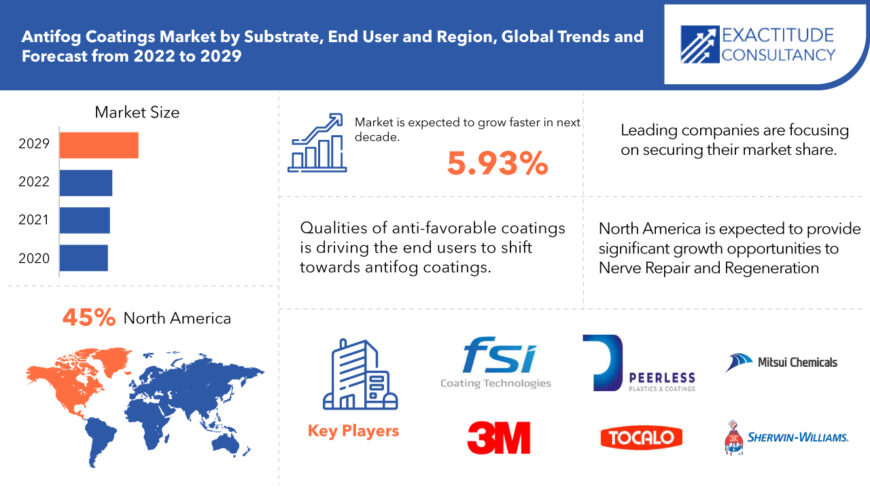
글로벌 안개 방지 코팅 시장 규모는 2022년에 162억 달러였고, 2029년까지 264억 2천만 달러로 성장할 것으로 예상되며, 연평균 성장률(CAGR)은 5.93%입니다. 안개 방지 코팅은 비 안개 코팅 이라고도 하며 , 안경뿐만 아니라 외부에서 보이는 게이지와 표시기에도 필요합니다. 안개 발생을 줄이기 위해 코팅된 투명 플라스틱 제품의 장점은 온도 변화 및/또는 높은 습도가 필요한 많은 응용 분야에서 분명합니다. 이 제품은 습한 환경에서도 강력한 내화학성 및 내자외선성과 접착력을 가지고 있습니다. 안개 방지 코팅은 항공 및 항공우주 , 건설 및 건설 , 자동차, 전자, 군사 및 보안, 의료 및 안전 산업에서 수요가 많습니다.
안개 방지제와 처리제는 표면에 물이 응축되는 것을 방지하여 표면에 안개가 생기는 것을 방지하는 물질입니다.
| 기인하다 | 세부 |
| 학습 기간 | 2022-2029 |
| 기준년도 | 2022 |
| 추정 연도 | 2023 |
| 예상 연도 | 2023-2029 |
| 역사적 기간 | 2018-2022 |
| 단위 | 가치 (백만 달러) |
| 분할 | 제품 유형별, 최종 사용자별, 지역별 |
| 기질에 따라 | |
| 최종 사용자에 의해 |
|
| 지역별로 |
|
미국 질병통제예방센터에 따르면, 의료적 치료가 필요한 직업성 눈 부상이 매일 2,000건 발생하고, 그 중 100건 이상이 1일 이상의 결근으로 이어진다고 합니다. 결과적으로 재정적 부담이 엄청납니다. 냉각기에 출입하는 식품 가공 사업 종사자도 같은 문제에 영향을 받을 수 있습니다. 실내와 실외에서 일하는 건설 노동자나 창고 자재 취급자도 마찬가지로 취약합니다. 안개 방지 코팅은 항공 및 항공우주, 건설 및 건설, 자동차, 전자, 군사 및 보안, 의료 및 안전 산업에서 사용되므로 안개 방지 코팅 제품에 대한 수요가 빠르게 증가할 것입니다.
반유리 코팅의 품질은 자동차 및 항공, 광학 이미징 장비, 보호 안경, 스포츠 및 레저를 포함한 여러 최종 사용 부문에서 성장을 증가시켰습니다. 시장은 군사 및 의료 산업에서 보호 안전 장비에 대한 수요가 증가하고, 적대적인 주변 환경에서 안전 규정을 충족하기 위한 자동차 조명에 대한 수요가 증가함에 따라 추진되고 있습니다. 인도, 미국, 중국, 파키스탄, 러시아를 포함한 많은 국가가 국방비를 늘려 시장 개발을 강화했습니다.
또한, 혹독한 주변 환경에서 군사 및 의료 산업의 보호 안전 장비에 대한 수요가 증가하고, 안전 규정을 충족하기 위해 자동차 조명에 대한 요구 사항이 시장을 주도하고 있습니다. 이러한 코팅은 빛 산란을 줄이는 능력으로 인해 인기를 얻었지만, 극한의 기상 조건에서는 균일하지 않은 특징을 보이고 서리를 생성하여 예측 기간 내내 산업에 위협이 될 수 있습니다.
[캡션 id="attachment_12564" 정렬="정렬센터" 너비="870"]
Frequently Asked Questions
What is the worth of global Antifog Coatings market?
The Antifog Coatings market size had crossed USD 16.20 Billion in 2022.
Which is the largest regional market for Antifog Coatings market?
The Largest Regional market for Antifog Coatings market is North America having a market share of 45%.
What is the CAGR of Antifog Coatings Market?
The global Antifog Coatings market registered a CAGR of 5.93% from 2023 to 2029.
Which are the top companies to hold the market share in Antifog Coatings market?
Key players profiled in the report include are FSI Coating Technologies, 3M Company, Peerless Plastics & Coatings, TOCALO Co., Ltd, Mitsui Chemicals, ALCAT Coatings, PPG., The Sherwin-Williams Co., AkzoNobel, Nippon Paint Holdings Co., RPM International Inc., Axalta Coating Systems., BASF Coatings., Kansai Paint Co. Ltd., Others.
What is the study period in this market?
The study period for Antifog Coatings market is from 2023-2029
Antifog Coatings Market Segment Analysis
The Antifog Coatings market is segmented by Substrate and end user.
On the basis of Substrate, global Antifog Coatings market is segmented into, Acrylic, Glass, PET (Polyester Film), Polycarbonate (PC), Polyamide. Acrylic to dominate the market due to its rising demand, followed by polyamide, increasing demand for interior lighting, protective eyewear, and automotive gauges applications is driving market expansion in these areas. For these goals, anti-fog coatings are commonly employed in the production of polyamide, glass substrate, and acrylic.
On the basis of End user, global Antifog Coatings market is segmented into, Building & Construction, Automotive, Aviation & Aerospace, Electronics, Military & Security, Medical & Safety Industries, Others. By market share, the Building & Construction industry segment was the most dominating.
[caption id="attachment_12565" align="aligncenter" width="680"]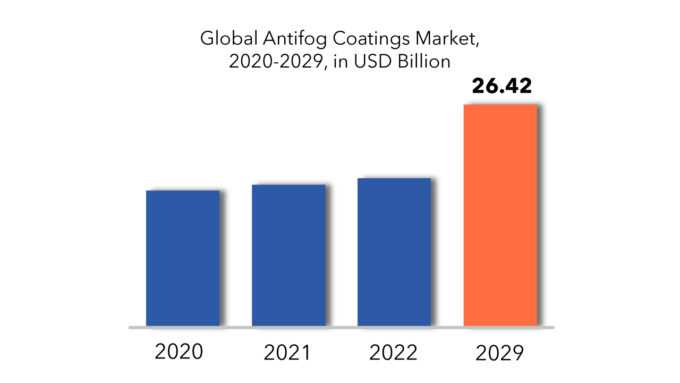
Antifog Coatings Market Players
The Key Players in Anti-fog Coatings Market are FSI Coating Technologies, 3M Company, Peerless Plastics & Coatings, TOCALO Co., Ltd, Mitsui Chemicals, ALCAT Coatings, PPG., The Sherwin-Williams Co., AkzoNobel, Nippon Paint Holdings Co., RPM International Inc., Axalta Coating Systems., BASF Coatings., Kansai Paint Co. Ltd., Others
To increase their market position, these businesses have implemented a variety of growth tactics. These companies are using expansion, new product development, mergers and acquisitions, and cooperation as important growth strategies to improve their product range and geographical presence in order to fulfil the rising demand for Antifog Coatings from emerging nations.
Who Should Buy? Or Key Stakeholders
- Industry and consulting firms
- State and national regulatory authorities
- Investors
- Suppliers and Distributors
- Research Institutes
- Others
Antifog Coatings Market Regional Analysis
Geographically, Antifog Coatings market is segmented into North America, Europe, Asia Pacific, and Rest of the world.- North America: includes the US, Canada, Mexico
- Europe: includes UK, Germany, France, Italy, Spain, Russia, and Rest of Europe
- Asia Pacific: includes China, Japan, South Korea, India, Australia, ASEAN and Rest of APAC
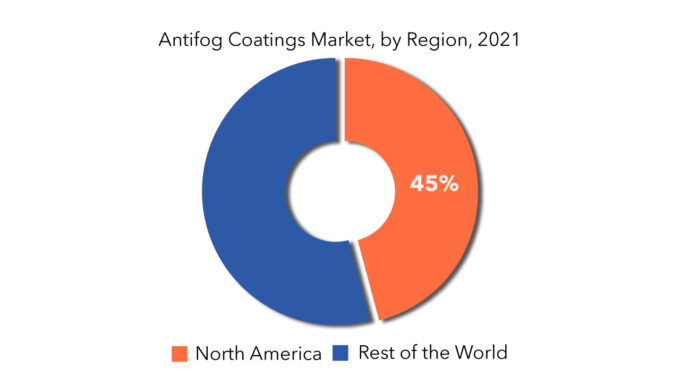
North America is the most important contributor to the growth of the Anti-fog Coatings market, with a 50% share in 2020. This is due to growing demand from the automotive and building & construction sectors. The usage of digital gadgets, protective eyewear, and apparel has expanded as the sports industry in the United States and Canada has grown. The anti-fog coatings market in Europe is being driven by rising demand for colorful sunglasses in the fashion and cosmetics industries. The anti-fog coatings market in Europe is driven by the need for colorful sunglasses in the fashion and cosmetics industries.
Asia Pacific is anticipated to rise at a rapid rate. The expanding population and consumer desire to improve aesthetics have a significant influence in Asia Pacific. Throughout the forecast period, an increase in research activities toward nano-based anti-fog coatings comprising blended PAA and PEG is projected to boost the anti-fog coatings market.
Key Market Segments: Antifog Coatings Market
Antifog Coatings Market by Substrate, 2022-2029, (USD Millions), (Thousand Units)- Acrylic
- Glass
- Pet (Polyester Film)
- Polycarbonate (Pc)
- Polyamide
- Building & Construction
- Automotive
- Aviation & Aerospace
- Electronics
- Military & Security
- Medical & Safety Industries
- Others
- North America
- Europe
- Apac
- Mea
- Latin America
[video width="1920" height="1080" mp4="https://gwsdigital.com/exactitudeconsultancy/wp-content/uploads/2023/01/Anti-fog-Coatings-Market.mp4" poster="https://gwsdigital.com/exactitudeconsultancy/wp-content/uploads/2022/02/exactitude-1-3.jpg"][/video]
Key Question Answered
- What is the current market size of this high growth market?
- What is the overall growth rate?
- What are the key growth areas, end users, end uses and types?
- Key reasons for growth
- Challenges for growth
- What technological developments are happening in this area?
- 소개
- 시장 정의
- 시장 세분화
- 연구 타임라인
- 가정 및 제한 사항
- 연구 방법론
- 데이터 마이닝
- 2차 연구
- 1차 연구
- 주제별 전문가의 조언
- 품질 검사
- 최종 검토
- 데이터 삼각 측량
- 하향식 접근 방식
- 탑다운 접근 방식
- 연구 흐름
- 데이터 소스
- 데이터 마이닝
- 요약
- 시장 개요
- 글로벌 안개 방지 코팅 시장 전망
- 시장 동인
- 시장 제약
- 시장 기회
- 코로나19가 글로벌 안개 방지 코팅 시장에 미치는 영향
- 글로벌 안개 방지 코팅 시장 전망
- 기판별 글로벌 안개 방지 코팅 시장(백만 달러)
- 아크릴
- 유리
- PET(폴리에스터 필름)
- 폴리카보네이트(PC)
- 폴리아미드
- 최종 사용 산업별 글로벌 안개 방지 코팅 시장(백만 달러)
- 건물 및 건설
- 자동차
- 항공 및 항공우주
- 전자제품
- 군사 및 보안
- 의료 및 안전 산업
- 기타
- 지역별 글로벌 안개 방지 코팅 시장(백만 달러)
- 소개
- 아시아 태평양
- 중국
- 인도
- 일본
- 대한민국
- 호주
- 동남아시아
- 아시아 태평양의 나머지 지역
- 북아메리카
- 미국
- 캐나다
- 멕시코
- 유럽
- 독일
- 영국
- 프랑스
- 이탈리아
- 스페인
- 러시아 제국
- 유럽의 나머지 지역
- 남아메리카
- 브라질
- 아르헨티나
- 콜롬비아
- 남미의 나머지 지역
- 중동 및 아프리카
- 아랍에미리트
- 사우디 아라비아
- 남아프리카 공화국
- 중동 및 아프리카의 나머지 지역
- 회사 프로필* (사업 개요, 회사 스냅샷, 제공되는 제품, 최근 개발 사항)
- FSI 코팅 기술
- 3M 회사
- 피어리스 플라스틱 & 코팅
- 토칼로 주식회사
- 미쓰이 케미컬
- ALCAT 코팅
- 셔윈-윌리엄스 주식회사
- AkzoNobel, 일본 페인트 홀딩스(주)
*회사 목록은 표시용입니다.
표 목록
TABLE 1 GLOBAL ANTIFOG COATINGS MARKET BY SUBSTRATE (USD MILLIONS), 2020-2029
TABLE 2 GLOBAL ANTIFOG COATINGS MARKET BY SUBSTRATE (THOUSAND UNITS), 2020-2029
TABLE 3 GLOBAL ANTIFOG COATINGS MARKET BY END USE INDUSTRY (USD MILLIONS), 2020-2029
TABLE 4 GLOBAL ANTIFOG COATINGS MARKET BY END USE INDUSTRY (THOUSAND UNITS), 2020-2029
TABLE 5 GLOBAL ANTIFOG COATINGS MARKET BY REGION (USD MILLIONS), 2020-2029
TABLE 6 GLOBAL ANTIFOG COATINGS MARKET BY REGION (THOUSAND UNITS), 2020-2029
TABLE 7 NORTH AMERICA ANTIFOG COATINGS MARKET BY COUNTRY (USD MILLIONS), 2020-2029
TABLE 8 NORTH AMERICA ANTIFOG COATINGS MARKET BY COUNTRY (THOUSAND UNITS), 2020-2029
TABLE 9 US ANTIFOG COATINGS MARKET BY SUBSTRATE (USD MILLIONS), 2020-2029
TABLE 10 US ANTIFOG COATINGS MARKET BY SUBSTRATE (THOUSAND UNITS), 2020-2029
TABLE 11 US ANTIFOG COATINGS MARKET BY END USE INDUSTRY (USD MILLIONS), 2020-2029
TABLE 12 US ANTIFOG COATINGS MARKET BY END USE INDUSTRY (THOUSAND UNITS), 2020-2029
TABLE 13 Canada ANTIFOG COATINGS MARKET BY SUBSTRATE (USD MILLIONS), 2020-2029
TABLE 14 Canada ANTIFOG COATINGS MARKET BY SUBSTRATE (THOUSAND UNITS), 2020-2029
TABLE 15 Canada ANTIFOG COATINGS MARKET BY END USE INDUSTRY (USD MILLIONS), 2020-2029
TABLE 16 Canada ANTIFOG COATINGS MARKET BY END USE INDUSTRY (THOUSAND UNITS), 2020-2029
TABLE 17 MEXICO ANTIFOG COATINGS MARKET BY SUBSTRATE (USD MILLIONS), 2020-2029
TABLE 18 MEXICO ANTIFOG COATINGS MARKET BY SUBSTRATE (THOUSAND UNITS), 2020-2029
TABLE 19 MEXICO ANTIFOG COATINGS MARKET BY END USE INDUSTRY (USD MILLIONS), 2020-2029
TABLE 20 MEXICO ANTIFOG COATINGS MARKET BY END USE INDUSTRY (THOUSAND UNITS), 2020-2029
TABLE 21 SOUTH AMERICA ANTIFOG COATINGS MARKET BY COUNTRY (USD MILLIONS), 2020-2029
TABLE 22 SOUTH AMERICA ANTIFOG COATINGS MARKET BY COUNTRY (THOUSAND UNITS), 2020-2029
TABLE 23 BRAZIL ANTIFOG COATINGS MARKET BY SUBSTRATE (USD MILLIONS), 2020-2029
TABLE 24 BRAZIL ANTIFOG COATINGS MARKET BY SUBSTRATE (THOUSAND UNITS), 2020-2029
TABLE 25 BRAZIL ANTIFOG COATINGS MARKET BY END USE INDUSTRY (USD MILLIONS), 2020-2029
TABLE 26 BRAZIL ANTIFOG COATINGS MARKET BY END USE INDUSTRY (THOUSAND UNITS), 2020-2029
TABLE 27 ARGENTINA ANTIFOG COATINGS MARKET BY SUBSTRATE (USD MILLIONS), 2020-2029
TABLE 28 ARGENTINA ANTIFOG COATINGS MARKET BY SUBSTRATE (THOUSAND UNITS), 2020-2029
TABLE 29 ARGENTINA ANTIFOG COATINGS MARKET BY END USE INDUSTRY (USD MILLIONS), 2020-2029
TABLE 30 ARGENTINA ANTIFOG COATINGS MARKET BY END USE INDUSTRY (THOUSAND UNITS), 2020-2029
TABLE 31 COLOMBIA ANTIFOG COATINGS MARKET BY SUBSTRATE (USD MILLIONS), 2020-2029
TABLE 32 COLOMBIA ANTIFOG COATINGS MARKET BY SUBSTRATE (THOUSAND UNITS), 2020-2029
TABLE 33 COLOMBIA ANTIFOG COATINGS MARKET BY END USE INDUSTRY (USD MILLIONS), 2020-2029
TABLE 34 COLOMBIA ANTIFOG COATINGS MARKET BY END USE INDUSTRY (THOUSAND UNITS), 2020-2029
TABLE 35 REST OF SOUTH AMERICA ANTIFOG COATINGS MARKET BY SUBSTRATE (USD MILLIONS), 2020-2029
TABLE 36 REST OF SOUTH AMERICA ANTIFOG COATINGS MARKET BY SUBSTRATE (THOUSAND UNITS), 2020-2029
TABLE 37 REST OF SOUTH AMERICA ANTIFOG COATINGS MARKET BY END USE INDUSTRY (USD MILLIONS), 2020-2029
TABLE 38 REST OF SOUTH AMERICA ANTIFOG COATINGS MARKET BY END USE INDUSTRY (THOUSAND UNITS), 2020-2029
TABLE 39 ASIA-PACIFIC ANTIFOG COATINGS MARKET BY COUNTRY (USD MILLIONS), 2020-2029
TABLE 40 ASIA-PACIFIC ANTIFOG COATINGS MARKET BY COUNTRY (THOUSAND UNITS), 2020-2029
TABLE 41 INDIA ANTIFOG COATINGS MARKET BY SUBSTRATE (USD MILLIONS), 2020-2029
TABLE 42 INDIA ANTIFOG COATINGS MARKET BY SUBSTRATE (THOUSAND UNITS), 2020-2029
TABLE 43 INDIA ANTIFOG COATINGS MARKET BY END USE INDUSTRY (USD MILLIONS), 2020-2029
TABLE 44 INDIA ANTIFOG COATINGS MARKET BY END USE INDUSTRY (THOUSAND UNITS), 2020-2029
TABLE 45 CHINA ANTIFOG COATINGS MARKET BY SUBSTRATE (USD MILLIONS), 2020-2029
TABLE 46 CHINA ANTIFOG COATINGS MARKET BY SUBSTRATE (THOUSAND UNITS), 2020-2029
TABLE 47 CHINA ANTIFOG COATINGS MARKET BY END USE INDUSTRY (USD MILLIONS), 2020-2029
TABLE 48 CHINA ANTIFOG COATINGS MARKET BY END USE INDUSTRY (THOUSAND UNITS), 2020-2029
TABLE 49 JAPAN ANTIFOG COATINGS MARKET BY SUBSTRATE (USD MILLIONS), 2020-2029
TABLE 50 JAPAN ANTIFOG COATINGS MARKET BY SUBSTRATE (THOUSAND UNITS), 2020-2029
TABLE 51 JAPAN ANTIFOG COATINGS MARKET BY END USE INDUSTRY (USD MILLIONS), 2020-2029
TABLE 52 JAPAN ANTIFOG COATINGS MARKET BY END USE INDUSTRY (THOUSAND UNITS), 2020-2029
TABLE 53 SOUTH KOREA ANTIFOG COATINGS MARKET BY SUBSTRATE (USD MILLIONS), 2020-2029
TABLE 54 SOUTH KOREA ANTIFOG COATINGS MARKET BY SUBSTRATE (THOUSAND UNITS), 2020-2029
TABLE 55 SOUTH KOREA ANTIFOG COATINGS MARKET BY END USE INDUSTRY (USD MILLIONS), 2020-2029
TABLE 56 SOUTH KOREA ANTIFOG COATINGS MARKET BY END USE INDUSTRY (THOUSAND UNITS), 2020-2029
TABLE 57 AUSTRALIA ANTIFOG COATINGS MARKET BY SUBSTRATE (USD MILLIONS), 2020-2029
TABLE 58 AUSTRALIA ANTIFOG COATINGS MARKET BY SUBSTRATE (THOUSAND UNITS), 2020-2029
TABLE 59 AUSTRALIA ANTIFOG COATINGS MARKET BY END USE INDUSTRY (USD MILLIONS), 2020-2029
TABLE 60 AUSTRALIA ANTIFOG COATINGS MARKET BY END USE INDUSTRY (THOUSAND UNITS), 2020-2029
TABLE 61 SOUTH EAST ASIA ANTIFOG COATINGS MARKET BY SUBSTRATE (USD MILLIONS), 2020-2029
TABLE 62 SOUTH EAST ASIA ANTIFOG COATINGS MARKET BY SUBSTRATE (THOUSAND UNITS), 2020-2029
TABLE 63 SOUTH EAST ASIA ANTIFOG COATINGS MARKET BY END USE INDUSTRY (USD MILLIONS), 2020-2029
TABLE 64 SOUTH EAST ASIA ANTIFOG COATINGS MARKET BY END USE INDUSTRY (THOUSAND UNITS), 2020-2029
TABLE 65 REST OF ASIA PACIFIC ANTIFOG COATINGS MARKET BY SUBSTRATE (USD MILLIONS), 2020-2029
TABLE 66 REST OF ASIA PACIFIC ANTIFOG COATINGS MARKET BY SUBSTRATE (THOUSAND UNITS), 2020-2029
TABLE 67 REST OF ASIA PACIFIC ANTIFOG COATINGS MARKET BY END USE INDUSTRY (USD MILLIONS), 2020-2029
TABLE 68 REST OF ASIA PACIFIC ANTIFOG COATINGS MARKET BY END USE INDUSTRY (THOUSAND UNITS), 2020-2029
TABLE 69 EUROPE ANTIFOG COATINGS MARKET BY COUNTRY (USD MILLIONS), 2020-2029
TABLE 70 EUROPE ANTIFOG COATINGS MARKET BY COUNTRY (THOUSAND UNITS), 2020-2029
TABLE 71 GERMANY ANTIFOG COATINGS MARKET BY SUBSTRATE (USD MILLIONS), 2020-2029
TABLE 72 GERMANY ANTIFOG COATINGS MARKET BY SUBSTRATE (THOUSAND UNITS), 2020-2029
TABLE 73 GERMANY ANTIFOG COATINGS MARKET BY END USE INDUSTRY (USD MILLIONS), 2020-2029
TABLE 74 GERMANY ANTIFOG COATINGS MARKET BY END USE INDUSTRY (THOUSAND UNITS), 2020-2029
TABLE 75 UK ANTIFOG COATINGS MARKET BY SUBSTRATE (USD MILLIONS), 2020-2029
TABLE 76 UK ANTIFOG COATINGS MARKET BY SUBSTRATE (THOUSAND UNITS), 2020-2029
TABLE 77 UK ANTIFOG COATINGS MARKET BY END USE INDUSTRY (USD MILLIONS), 2020-2029
TABLE 78 UK ANTIFOG COATINGS MARKET BY END USE INDUSTRY (THOUSAND UNITS), 2020-2029
TABLE 79 FRANCE ANTIFOG COATINGS MARKET BY SUBSTRATE (USD MILLIONS), 2020-2029
TABLE 80 FRANCE ANTIFOG COATINGS MARKET BY SUBSTRATE (THOUSAND UNITS), 2020-2029
TABLE 81 FRANCE ANTIFOG COATINGS MARKET BY END USE INDUSTRY (USD MILLIONS), 2020-2029
TABLE 82 FRANCE ANTIFOG COATINGS MARKET BY END USE INDUSTRY (THOUSAND UNITS), 2020-2029
TABLE 83 ITALY ANTIFOG COATINGS MARKET BY SUBSTRATE (USD MILLIONS), 2020-2029
TABLE 84 ITALY ANTIFOG COATINGS MARKET BY SUBSTRATE (THOUSAND UNITS), 2020-2029
TABLE 85 ITALY ANTIFOG COATINGS MARKET BY END USE INDUSTRY (USD MILLIONS), 2020-2029
TABLE 86 ITALY ANTIFOG COATINGS MARKET BY END USE INDUSTRY (THOUSAND UNITS), 2020-2029
TABLE 87 SPAIN ANTIFOG COATINGS MARKET BY SUBSTRATE (USD MILLIONS), 2020-2029
TABLE 88 SPAIN ANTIFOG COATINGS MARKET BY SUBSTRATE (THOUSAND UNITS), 2020-2029
TABLE 89 SPAIN ANTIFOG COATINGS MARKET BY END USE INDUSTRY (USD MILLIONS), 2020-2029
TABLE 90 SPAIN ANTIFOG COATINGS MARKET BY END USE INDUSTRY (THOUSAND UNITS), 2020-2029
TABLE 91 RUSSIA ANTIFOG COATINGS MARKET BY SUBSTRATE (USD MILLIONS), 2020-2029
TABLE 92 RUSSIA ANTIFOG COATINGS MARKET BY SUBSTRATE (THOUSAND UNITS), 2020-2029
TABLE 93 RUSSIA ANTIFOG COATINGS MARKET BY END USE INDUSTRY (USD MILLIONS), 2020-2029
TABLE 94 RUSSIA ANTIFOG COATINGS MARKET BY END USE INDUSTRY (THOUSAND UNITS), 2020-2029
TABLE 95 REST OF EUROPE ANTIFOG COATINGS MARKET BY SUBSTRATE (USD MILLIONS), 2020-2029
TABLE 96 REST OF EUROPE ANTIFOG COATINGS MARKET BY SUBSTRATE (THOUSAND UNITS), 2020-2029
TABLE 97 REST OF EUROPE ANTIFOG COATINGS MARKET BY END USE INDUSTRY (USD MILLIONS), 2020-2029
TABLE 98 REST OF EUROPE ANTIFOG COATINGS MARKET BY END USE INDUSTRY (THOUSAND UNITS), 2020-2029
TABLE 99 MIDDLE EAST AND AFRICA ANTIFOG COATINGS MARKET BY COUNTRY (USD MILLIONS), 2020-2029
TABLE 100 MIDDLE EAST AND AFRICA ANTIFOG COATINGS MARKET BY COUNTRY (THOUSAND UNITS), 2020-2029
TABLE 101 UAE ANTIFOG COATINGS MARKET BY SUBSTRATE (USD MILLIONS), 2020-2029
TABLE 102 UAE ANTIFOG COATINGS MARKET BY SUBSTRATE (THOUSAND UNITS), 2020-2029
TABLE 103 UAE ANTIFOG COATINGS MARKET BY END USE INDUSTRY (USD MILLIONS), 2020-2029
TABLE 104 UAE ANTIFOG COATINGS MARKET BY END USE INDUSTRY (THOUSAND UNITS), 2020-2029
TABLE 105 SAUDI ARABIA ANTIFOG COATINGS MARKET BY SUBSTRATE (USD MILLIONS), 2020-2029
TABLE 106 SAUDI ARABIA ANTIFOG COATINGS MARKET BY SUBSTRATE (THOUSAND UNITS), 2020-2029
TABLE 107 SAUDI ARABIA ANTIFOG COATINGS MARKET BY END USE INDUSTRY (USD MILLIONS), 2020-2029
TABLE 108 SAUDI ARABIA ANTIFOG COATINGS MARKET BY END USE INDUSTRY (THOUSAND UNITS), 2020-2029
TABLE 109 SOUTH AFRICA ANTIFOG COATINGS MARKET BY SUBSTRATE (USD MILLIONS), 2020-2029
TABLE 110 SOUTH AFRICA ANTIFOG COATINGS MARKET BY SUBSTRATE (THOUSAND UNITS), 2020-2029
TABLE 111 SOUTH AFRICA ANTIFOG COATINGS MARKET BY END USE INDUSTRY (USD MILLIONS), 2020-2029
TABLE 112 SOUTH AFRICA ANTIFOG COATINGS MARKET BY END USE INDUSTRY (THOUSAND UNITS), 2020-2029
TABLE 113 REST OF MIDDLE EAST AND AFRICA ANTIFOG COATINGS MARKET BY SUBSTRATE (USD MILLIONS), 2020-2029
TABLE 114 REST OF MIDDLE EAST AND AFRICA ANTIFOG COATINGS MARKET BY SUBSTRATE (THOUSAND UNITS), 2020-2029
TABLE 115 REST OF MIDDLE EAST AND AFRICA ANTIFOG COATINGS MARKET BY END USE INDUSTRY (USD MILLIONS), 2020-2029
TABLE 116 REST OF MIDDLE EAST AND AFRICA ANTIFOG COATINGS MARKET BY END USE INDUSTRY (THOUSAND UNITS), 2020-2029
LIST OF FIGURES
FIGURE 1 MARKET DYNAMICS
FIGURE 2 MARKET SEGMENTATION
FIGURE 3 REPORT TIMELINES: YEARS CONSIDERED
FIGURE 4 DATA TRIANGULATION
FIGURE 5 BOTTOM-UP APPROACH
FIGURE 6 TOP-DOWN APPROACH
FIGURE 7 RESEARCH FLOW
FIGURE 8 GLOBAL ANTIFOG COATINGS MARKET BY SUBSTRATE, USD MILLION, 2020-2029
FIGURE 9 GLOBAL ANTIFOG COATINGS MARKET BY END USE INDUSTRY, USD MILLION, 2020-2029
FIGURE 10 GLOBAL ANTIFOG COATINGS MARKET BY REGION, USD MILLION, 2020-2029
FIGURE 11 PORTER’S FIVE FORCES MODEL
FIGURE 12 GLOBAL ANTIFOG COATINGS MARKET BY SUBSTRATE, USD MILLION, 2020-2029
FIGURE 13 GLOBAL ANTIFOG COATINGS MARKET BY END USE INDUSTRY, USD MILLION, 2020-2029
FIGURE 14 GLOBAL ANTIFOG COATINGS MARKET BY REGION, USD MILLION, 2020-2029
FIGURE 15 ANTIFOG COATINGS MARKET BY REGION 2020
FIGURE 16 MARKET SHARE ANALYSIS
FIGURE 17 FSI COATING TECHNOLOGIES COMPANY SNAPSHOT
FIGURE 18 3M COMPANY SNAPSHOT
FIGURE 19 PEERLESS PLASTICS & COATINGS COMPANY SNAPSHOT
FIGURE 20 TOCALO CO. COMPANY SNAPSHOT
FIGURE 21 MITSUI CHEMICALS COMPANY SNAPSHOT
FIGURE 22 ALCAT COATINGS COMPANY SNAPSHOT
FIGURE 23 PPG. COMPANY SNAPSHOT
FIGURE 24 THE SHERWIN-WILLIAMS CO. COMPANY SNAPSHOT
FIGURE 25 AKZONOBEL, NIPPON PAINT HOLDINGS CO. COMPANY SNAPSHOT
DOWNLOAD FREE SAMPLE REPORT
License Type
SPEAK WITH OUR ANALYST
Want to know more about the report or any specific requirement?
WANT TO CUSTOMIZE THE REPORT?
Our Clients Speak
We asked them to research ‘ Equipment market’ all over the world, and their whole arrangement was helpful to us. thehealthanalytics.com insightful analysis and reports contributed to our current analysis and in creating a future strategy. Besides, the te
Yosuke Mitsui
Senior Associate Construction Equipment Sales & Marketing
We asked them to research ‘Equipment market’ all over the world, and their whole arrangement was helpful to us. thehealthanalytics.com insightful analysis and reports contributed to our current analysis and in creating a future strategy. Besides, the te


