

Base Year Value ()
x.x %
x.x %
CAGR ()
x.x %
x.x %
Forecast Year Value ()
x.x %
x.x %
Historical Data Period
Largest Region
Forecast Period
솔루션(감지 시스템, 소프트웨어, 처리 장치), 플랫폼(공중, 육상, 우주, 해양, 무기), 애플리케이션(상업, 군사 및 정부) 및 지역(북미, 유럽, 아시아 태평양, 남미, 중동 및 아프리카)별 자율 항법 시장 글로벌 트렌드 및 2022년부터 2029년까지의 예측
Instant access to hundreds of data points and trends
- Market estimates from 2014-2029
- Competitive analysis, industry segmentation, financial benchmarks
- Incorporates SWOT, Porter's Five Forces and risk management frameworks
- PDF report or online database with Word, Excel and PowerPoint export options
- 100% money back guarantee
자율 주행 시장 개요:
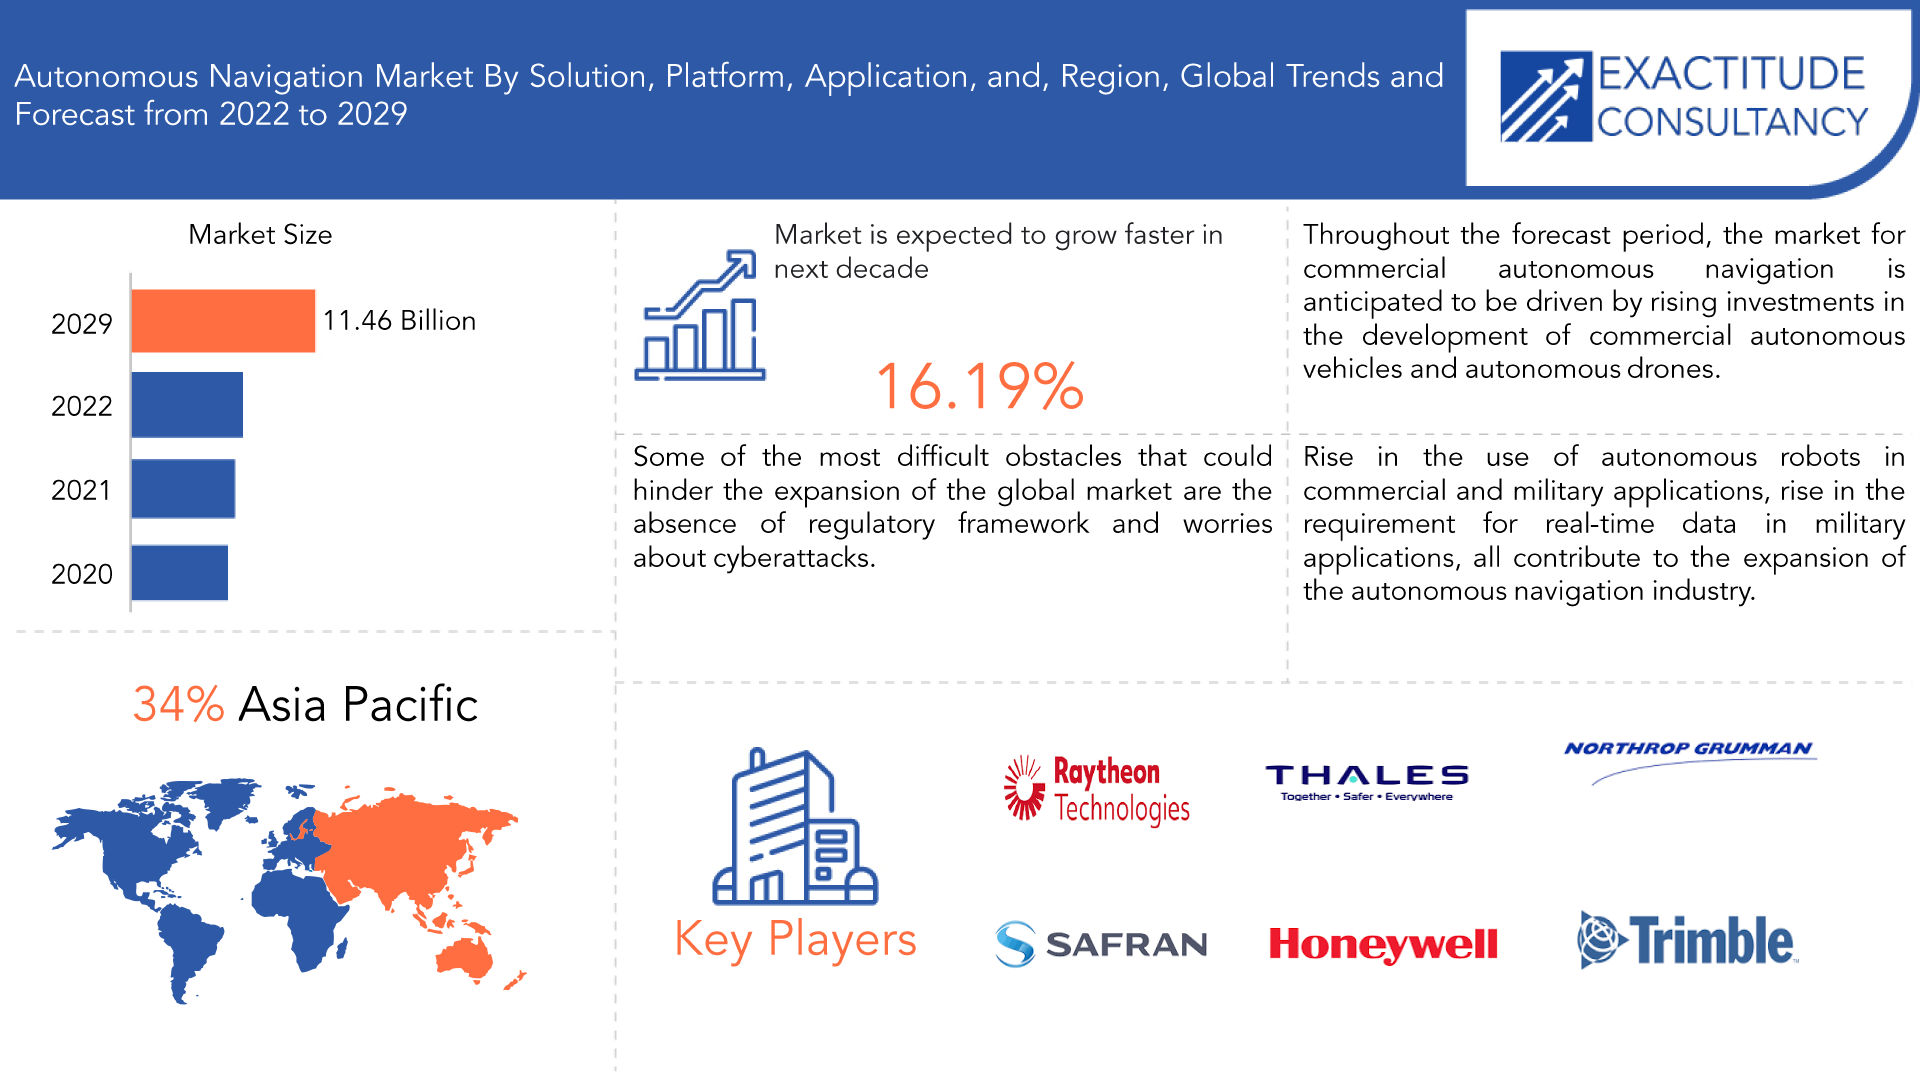
글로벌 자율 주행 시장 규모는 40억 1천만 달러에 달하며, 2029년까지 114억 6천만 달러에 도달할 것으로 예상됩니다. 2022년에서 2029년까지 연평균 성장률은 16.19%입니다.
인간의 도움 없이 경로를 계획하고 수행할 수 있는 시스템을 자율적이라고 합니다. 환경에 기반한 의사 결정은 복잡한 시스템 조합의 도움을 받습니다. 자동차, 보트, 드론 , 로봇을 포함한 다양한 차량에 장착됩니다. 정확하고 안전한 차량 내비게이션을 위해 관성 내비게이션 시스템, 위성 내비게이션 시스템, 카메라 , 레이더 , 초음파 및 음향 내비게이션 , 자율 내비게이션 알고리즘을 포함한 최신 기술이 사용됩니다 .
전 세계 정부의 기술 향상과 상당한 재정 투자로 인해 무인 항공기(UAV), 무인 지상 차량(UGV) 등과 같은 무인 차량의 군사적 용도 사용이 확대되었습니다. 효율성과 연결 범위를 높이기 위해 UAV 의 통신 및 내비게이션 시스템을 업그레이드하는 것이 필수적이 되었는데, 이는 군사 작전을 위한 무인 차량 사용의 증가에 기인할 수 있습니다 . 군 정부 감시 목적 으로 자율 내비게이션을 사용할 때 상황 인식이 중요합니다 .
| 기인하다 | 세부 |
| 학습 기간 | 2022-2029 |
| 기준년도 | 2021 |
| 추정 연도 | 2022 |
| 예상 연도 | 2022-2029 |
| 역사적 기간 | 2018-2020 |
| 단위 | 가치(10억 달러) |
| 분할 | 솔루션, 플랫폼, 애플리케이션 및 지역별. |
| 솔루션별로 |
|
| 플랫폼별로 |
|
| 응용 프로그램으로 |
|
| 지역별로 |
|
전자 상거래 사업은 회사의 접근성, 빠른 대응 시간, 신뢰할 수 있는 기능으로 인해 확장되었습니다. 수요 증가로 물류 운영에 로봇을 사용하기가 더 쉬워졌습니다. 물류 서비스는 로봇 의 빠르고 정확하며 저렴한 배치 덕분에 기계화되었습니다 .
[캡션 id="attachment_17945" 정렬="정렬센터" 너비="1920"]
Frequently Asked Questions
What is the worth of the global autonomous navigation market?
The global autonomous navigation market was valued at 4.01 billion in 2022 and is projected to reach 11.46 billion by 2029, growing at a CAGR of 16.19% from 2022 to 2029
Which market segments are covered in the report on the autonomous navigation market?
Based on solution, platform, application, and region the autonomous navigation market report's divisions are broken down.
What is the CAGR of the autonomous navigation market?
The global autonomous navigation market registered a CAGR of 16.19% from 2022 to 2029. The industry segment was the highest revenue contributor to the market.
Which are the top companies to hold the market share in the autonomous navigation market?
Key players profiled in the report include Raytheon, Thales, Northrop Grumman, Safran, Honeywell International, Rh Marine, Northrop Grumman, Kongsberg Gruppen, Furuno, Moog Inc., L3 Harris Technologies, General Dynamics, and others.
Which is the largest regional market for the autonomous navigation market?
Throughout the forecast period, the market for autonomous navigation in Asia Pacific is anticipated to grow at the greatest CAGR. The demand for high-tech automobiles and the autonomous navigation market in China, which is the largest in the Asia Pacific area, are both expanding significantly. Given the country's expanding disposable income, China is one of the major markets for high-tech automobiles. The Chinese market, which leans towards tiny and inexpensive passenger vehicles, has attracted investment from almost all major automobile makers.
Autonomous Navigation Market Segment Analysis:
Based on solution, platform, application, and region, the global market for autonomous navigation is divided into these categories.
On the basis of the solution autonomous navigation is divided into Sensing System, Software, and Processing Unit. Two of the most crucial sensors that can give an autonomous system situation awareness and be used for activities like mapping, visual localization, path planning, and obstacle avoidance are LiDAR and cameras. Autonomous vehicles use data analysis and management software to perform a variety of tasks, including smooth movement, health monitoring, and accident avoidance. The system's integrated software is in charge of performing complicated procedures and offering learning capabilities.
On the basis of the platform the airborne platform autonomous navigation is divided into Airborne, Land, Space, Marine, and Weapon. The airborne platform segment is anticipated to experience the highest revenue growth throughout the projection period of all the platform segments. Unmanned aerial vehicles are being used in more military applications, which is a major driver of this market segment's growth. High investment in the creation of autonomous drones is another element promoting the expansion of the airborne market.
[caption id="attachment_17946" align="aligncenter" width="1920"]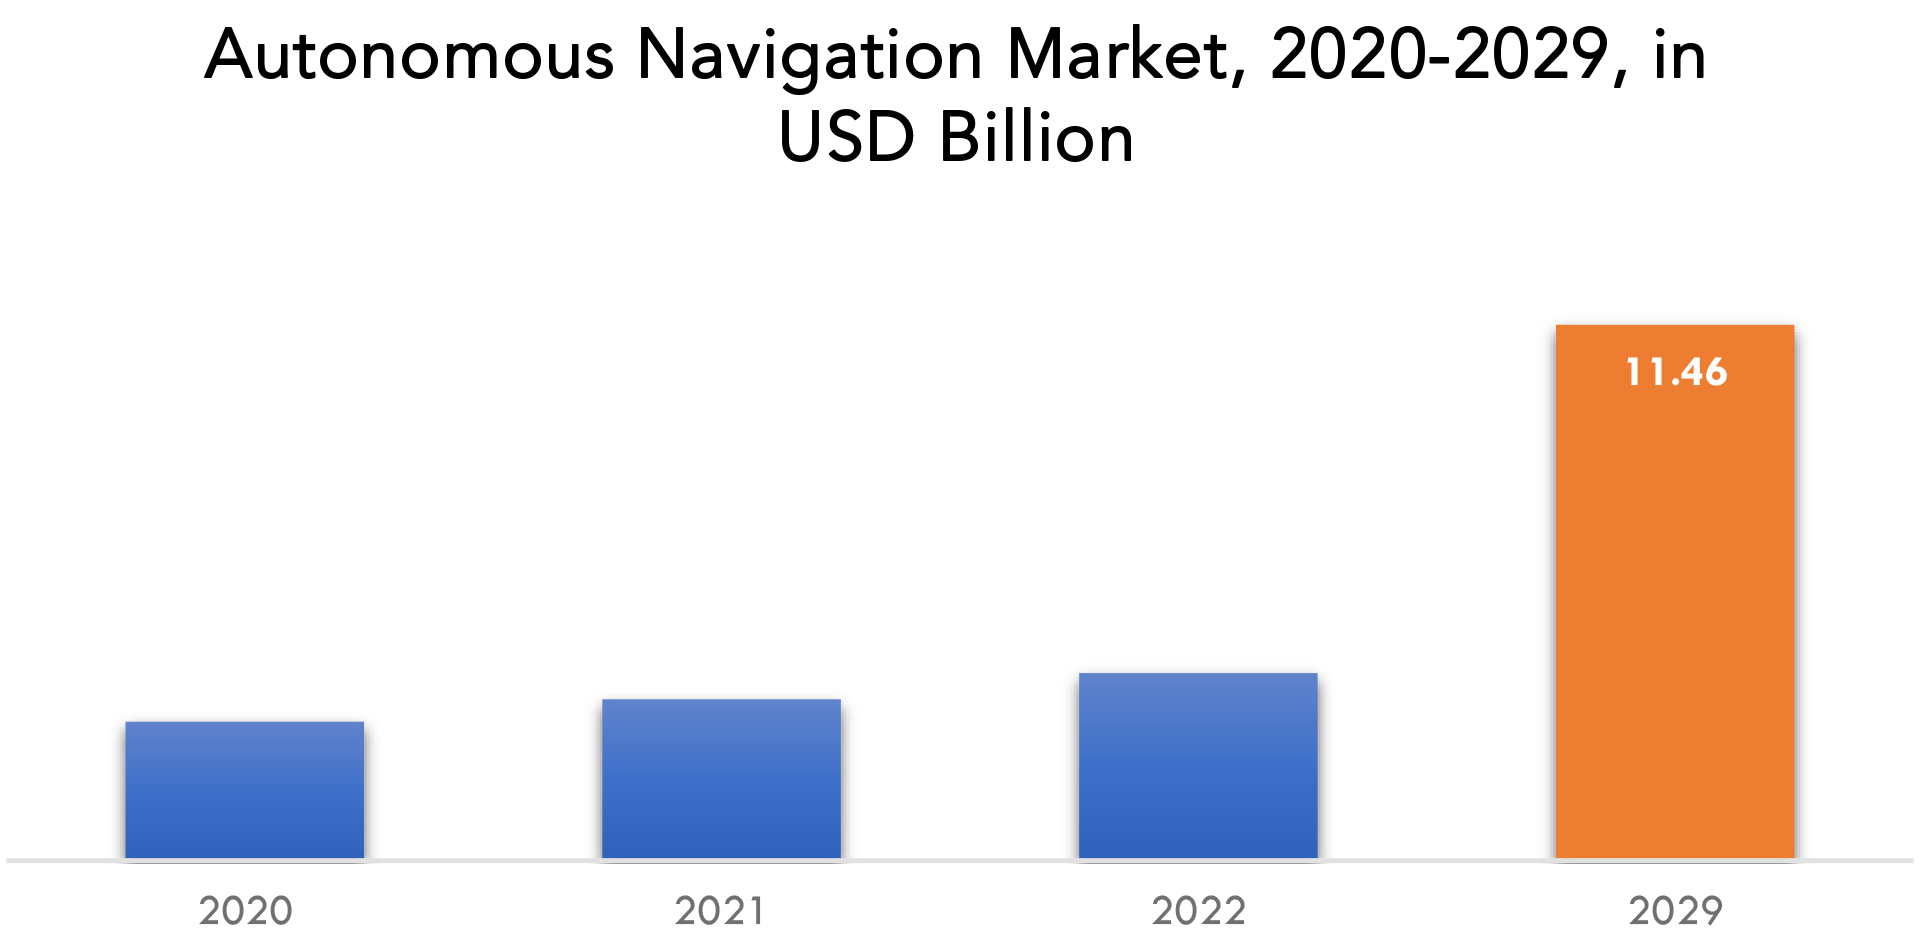
Autonomous Navigation Market Players:
The major players operating in the global autonomous navigation industry include the major market players include Raytheon, Thales, Northrop Grumman, Safran, Honeywell International, Rh Marine, Northrop Grumman, Kongsberg Gruppen, Furuno, Moog Inc., L3 Harris Technologies, General Dynamics, and others.
Industry Development:- 15 February 2023: Safran Seats is awarded the Janus Label of Excellence by the Institute François du Design for Euphony. With Euphony, each individual passenger can enjoy high-quality sound in every position of the seat, enabling them to make the most of the entertainment content provided by the airline free from headsets and cables.
- 5 October 2022: Safran Data Systems was selected to develop a ground network for lunar missions.
Who Should Buy? Or Key Stakeholders
- Manufacturing
- End-Use Industries
- Automotive Industries
- Industrial Vehicles
- Aviation
- Regulatory Authorities
- Research Organizations
- Metal Processing Industries
- Construction
- Others
Autonomous Navigation Market Regional Analysis:
Geographically, the Autonomous Navigation market is segmented into North America, South America, Europe, APAC, and MEA.
- North America: includes the US, Canada, Mexico
- Europe: includes UK, Germany, France, Italy, Spain, Russia, and Rest of Europe
- Asia Pacific: includes China, Japan, South Korea, India, Australia, ASEAN and the Rest of APAC
- South America: includes Brazil, Argentina and Rest of South America
- Middle East & Africa: includes Turkey, UAE, Saudi Arabia, South Africa, and the Rest of MEA
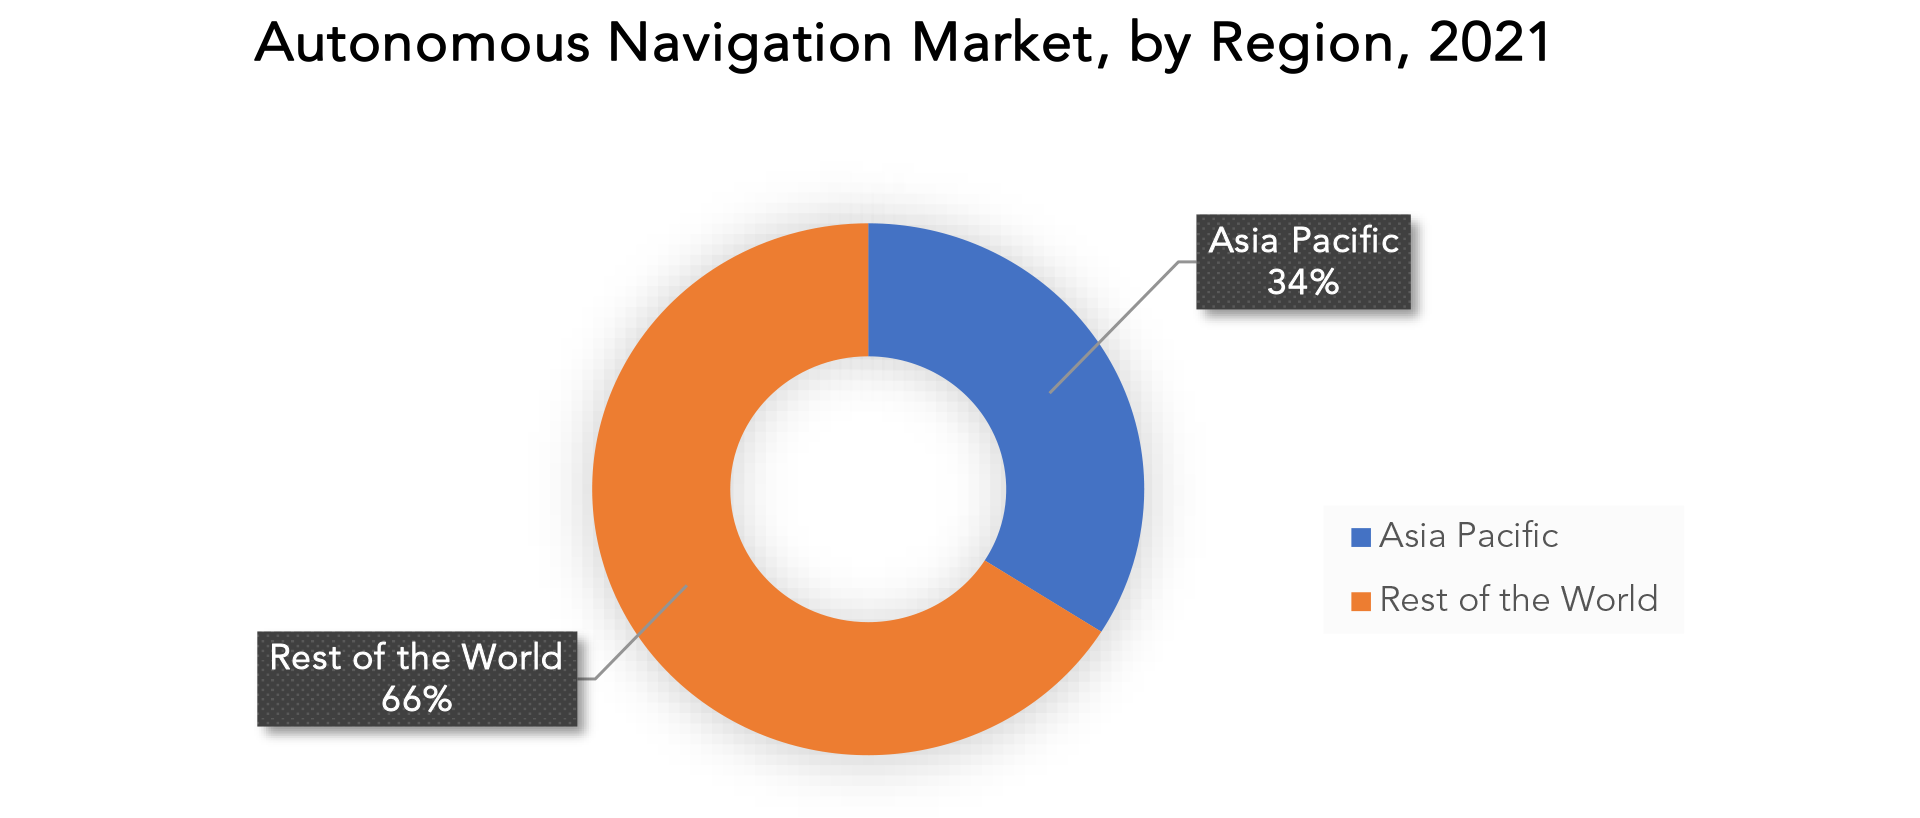
Throughout the forecast period, the market for autonomous navigation in Asia Pacific is anticipated to grow at the greatest CAGR. The demand for high-tech automobiles and the autonomous navigation market in China, which is the largest in the Asia Pacific area, are both expanding significantly. Given the country's expanding disposable income, China is one of the major markets for high-tech automobiles. The Chinese market, which leans towards tiny and inexpensive passenger vehicles, has attracted investment from almost all major automobile Makers. Given that the current automobile penetration is low in comparison to that of industrialized countries, an increase in demand is anticipated. The demand for vehicles has grown as a result of China's rising automotive manufacturing levels.
Key Market Segments: Autonomous Navigation Market
Autonomous Navigation Market By Solution, 2020-2029, (USD Billion)- Sensing System
- Software
- Processing Unit
- Airborne
- Land
- Space
- Marine
- Weapon
- Commercial
- Military & Government
- North America
- Europe
- Asia Pacific
- South America
- Middle East And Africa
Exactitude Consultancy Services Key Objectives:
- Increasing sales and market share
- Developing new technology
- Improving profitability
- Entering new markets
- Enhancing brand reputation
Key Question Answered
- What is the expected growth rate of the autonomous navigation market over the next 7 years?
- Who are the major players in the autonomous navigation market and what is their market share?
- What are the end-user industries driving demand for the market and what is their outlook?
- What are the opportunities for growth in emerging markets such as Asia-Pacific, the Middle East, and Africa?
- How is the economic environment affecting the autonomous navigation market, including factors such as interest rates, inflation, and exchange rates?
- What is the expected impact of government policies and regulations on the autonomous navigation market?
- What is the current and forecasted size and growth rate of the global autonomous navigation market?
- What are the key drivers of growth in the autonomous navigation market?
- Who are the major players in the market and what is their market share?
- What are the distribution channels and supply chain dynamics in the autonomous navigation market?
- What are the technological advancements and innovations in the autonomous navigation market and their impact on product development and growth?
- What are the regulatory considerations and their impact on the market?
- What are the challenges faced by players in the autonomous navigation market and how are they addressing these challenges?
- What are the opportunities for growth and expansion in the autonomous navigation market?
- What are the product offerings and specifications of leading players in the market?
- 소개
- 시장 정의
- 시장 세분화
- 연구 일정
- 가정 및 제한
- 연구 방법론
- 데이터 마이닝
- 2차 연구
- 1차 연구
- 주제별 전문가의 조언
- 품질 검사
- 최종 검토
- 데이터 삼각 측량
- 바텀업 방식
- 탑다운 접근 방식
- 연구 흐름
- 데이터 소스
- 데이터 마이닝
- 요약
- 시장 개요
- 글로벌 자율 주행 시장 전망
- 시장 동인
- 시장 제약
- 시장 기회
- 자율 주행 시장에 대한 COVID-19의 영향
- 포터의 5가지 힘 모델
- 신규 진입자의 위협
- 대체품으로부터의 위협
- 공급업체의 협상력
- 고객의 협상력
- 경쟁의 정도
- 산업 가치 사슬 분석
- 글로벌 자율 주행 시장 전망
- 솔루션별 글로벌 자율 주행 시장, 2020-2029, (USD 십억)
- 감지 시스템
- 소프트웨어
- 처리 장치
- 플랫폼별 글로벌 자율 주행 시장, 2020-2029, (USD 십억)
- 공수
- 땅
- 공간
- 선박
- 무기
- 2020-2029년 응용 분야별 글로벌 자율 주행 시장(USD Billion)
- 광고
- 군대 및 정부
- 지역별 글로벌 자율 주행 시장, 2020-2029, (USD 십억)
- 북아메리카
- 우리를
- 캐나다
- 멕시코
- 남아메리카
- 브라질
- 아르헨티나
- 콜롬비아
- 남미의 나머지 지역
- 유럽
- 독일
- 영국
- 프랑스
- 이탈리아
- 스페인
- 러시아 제국
- 유럽의 나머지 지역
- 아시아 태평양
- 인도
- 중국
- 일본
- 대한민국
- 호주
- 동남아시아
- 아시아 태평양의 나머지 지역
- 중동 및 아프리카
- 아랍에미리트
- 사우디 아라비아
- 남아프리카 공화국
- 중동 및 아프리카의 나머지 지역
- 북아메리카
- 회사 프로필* (사업 개요, 회사 스냅샷, 제공 제품, 최근 개발)
- 레이시온
- 탈레스
- 노스롭 그루먼
- 사프란
- 허니웰 인터내셔널
- RH 마린
- 노스롭 그루먼
- 콩스버그 그룹
- 후루노
- 주식회사 무그
- L3 해리스 테크놀로지스
- 일반 역학
*회사 목록은 표시용입니다.
표 목록
TABLE 1 GLOBAL AUTONOMOUS NAVIGATION MARKET BY SOLUTION (USD BILLION) 2020-2029
TABLE 2 GLOBAL AUTONOMOUS NAVIGATION MARKET BY PLATFORM (USD BILLION) 2020-2029
TABLE 3 GLOBAL AUTONOMOUS NAVIGATION MARKET BY APPLICATION (USD BILLION) 2020-2029
TABLE 4 GLOBAL AUTONOMOUS NAVIGATION MARKET BY REGION (USD BILLION) 2020-2029
TABLE 5 NORTH AMERICA AUTONOMOUS NAVIGATION MARKET BY COUNTRY (USD BILLION) 2020-2029
TABLE 6 NORTH AMERICA AUTONOMOUS NAVIGATION MARKET BY SOLUTION (USD BILLION) 2020-2029
TABLE 7 NORTH AMERICA AUTONOMOUS NAVIGATION MARKET BY PLATFORM (USD BILLION) 2020-2029
TABLE 8 NORTH AMERICA AUTONOMOUS NAVIGATION MARKET BY APPLICATION (USD BILLION) 2020-2029
TABLE 9 US AUTONOMOUS NAVIGATION MARKET BY SOLUTION (USD BILLION) 2020-2029
TABLE 10 US AUTONOMOUS NAVIGATION MARKET BY PLATFORM (USD BILLION) 2020-2029
TABLE 11 US AUTONOMOUS NAVIGATION MARKET BY APPLICATION (USD BILLION) 2020-2029
TABLE 12 CANADA AUTONOMOUS NAVIGATION MARKET BY SOLUTION (USD BILLION) 2020-2029
TABLE 13 CANADA AUTONOMOUS NAVIGATION MARKET BY PLATFORM (USD BILLION) 2020-2029
TABLE 14 CANADA AUTONOMOUS NAVIGATION MARKET BY APPLICATION (USD BILLION) 2020-2029
TABLE 15 MEXICO AUTONOMOUS NAVIGATION MARKET BY SOLUTION (USD BILLION) 2020-2029
TABLE 16 MEXICO AUTONOMOUS NAVIGATION MARKET BY PLATFORM (USD BILLION) 2020-2029
TABLE 17 MEXICO AUTONOMOUS NAVIGATION MARKET BY APPLICATION (USD BILLION) 2020-2029
TABLE 18 SOUTH AMERICA AUTONOMOUS NAVIGATION MARKET BY COUNTRY (USD BILLION) 2020-2029
TABLE 19 SOUTH AMERICA AUTONOMOUS NAVIGATION MARKET BY SOLUTION (USD BILLION) 2020-2029
TABLE 20 SOUTH AMERICA AUTONOMOUS NAVIGATION MARKET BY PLATFORM (USD BILLION) 2020-2029
TABLE 21 SOUTH AMERICA AUTONOMOUS NAVIGATION MARKET BY APPLICATION (USD BILLION) 2020-2029
TABLE 22 BRAZIL AUTONOMOUS NAVIGATION MARKET BY SOLUTION (USD BILLION) 2020-2029
TABLE 23 BRAZIL AUTONOMOUS NAVIGATION MARKET BY PLATFORM (USD BILLION) 2020-2029
TABLE 24 BRAZIL AUTONOMOUS NAVIGATION MARKET BY APPLICATION (USD BILLION) 2020-2029
TABLE 25 ARGENTINA AUTONOMOUS NAVIGATION MARKET BY SOLUTION (USD BILLION) 2020-2029
TABLE 26 ARGENTINA AUTONOMOUS NAVIGATION MARKET BY PLATFORM (USD BILLION) 2020-2029
TABLE 27 ARGENTINA AUTONOMOUS NAVIGATION MARKET BY APPLICATION (USD BILLION) 2020-2029
TABLE 28 COLOMBIA AUTONOMOUS NAVIGATION MARKET BY SOLUTION (USD BILLION) 2020-2029
TABLE 29 COLOMBIA AUTONOMOUS NAVIGATION MARKET BY PLATFORM (USD BILLION) 2020-2029
TABLE 30 COLOMBIA AUTONOMOUS NAVIGATION MARKET BY APPLICATION (USD BILLION) 2020-2029
TABLE 31 REST OF SOUTH AMERICA AUTONOMOUS NAVIGATION MARKET BY SOLUTION (USD BILLION) 2020-2029
TABLE 32 REST OF SOUTH AMERICA AUTONOMOUS NAVIGATION MARKET BY PLATFORM (USD BILLION) 2020-2029
TABLE 33 REST OF SOUTH AMERICA AUTONOMOUS NAVIGATION MARKET BY APPLICATION (USD BILLION) 2020-2029
TABLE 34 ASIA-PACIFIC AUTONOMOUS NAVIGATION MARKET BY COUNTRY (USD BILLION) 2020-2029
TABLE 35 ASIA-PACIFIC AUTONOMOUS NAVIGATION MARKET BY SOLUTION (USD BILLION) 2020-2029
TABLE 36 ASIA-PACIFIC AUTONOMOUS NAVIGATION MARKET BY PLATFORM (USD BILLION) 2020-2029
TABLE 37 ASIA-PACIFIC AUTONOMOUS NAVIGATION MARKET BY APPLICATION (USD BILLION) 2020-2029
TABLE 38 INDIA AUTONOMOUS NAVIGATION MARKET BY SOLUTION (USD BILLION) 2020-2029
TABLE 39 INDIA AUTONOMOUS NAVIGATION MARKET BY PLATFORM (USD BILLION) 2020-2029
TABLE 40 INDIA AUTONOMOUS NAVIGATION MARKET BY APPLICATION (USD BILLION) 2020-2029
TABLE 41 CHINA AUTONOMOUS NAVIGATION MARKET BY SOLUTION (USD BILLION) 2020-2029
TABLE 42 CHINA AUTONOMOUS NAVIGATION MARKET BY PLATFORM (USD BILLION) 2020-2029
TABLE 43 CHINA AUTONOMOUS NAVIGATION MARKET BY APPLICATION (USD BILLION) 2020-2029
TABLE 44 JAPAN AUTONOMOUS NAVIGATION MARKET BY SOLUTION (USD BILLION) 2020-2029
TABLE 45 JAPAN AUTONOMOUS NAVIGATION MARKET BY PLATFORM (USD BILLION) 2020-2029
TABLE 46 JAPAN AUTONOMOUS NAVIGATION MARKET BY APPLICATION (USD BILLION) 2020-2029
TABLE 47 SOUTH KOREA AUTONOMOUS NAVIGATION MARKET BY SOLUTION (USD BILLION) 2020-2029
TABLE 48 SOUTH KOREA AUTONOMOUS NAVIGATION MARKET BY PLATFORM (USD BILLION) 2020-2029
TABLE 49 SOUTH KOREA AUTONOMOUS NAVIGATION MARKET BY APPLICATION (USD BILLION) 2020-2029
TABLE 50 AUSTRALIA AUTONOMOUS NAVIGATION MARKET BY SOLUTION (USD BILLION) 2020-2029
TABLE 51 AUSTRALIA AUTONOMOUS NAVIGATION MARKET BY PLATFORM (USD BILLION) 2020-2029
TABLE 52 AUSTRALIA AUTONOMOUS NAVIGATION MARKET BY APPLICATION (USD BILLION) 2020-2029
TABLE 53 SOUTH-EAST ASIA AUTONOMOUS NAVIGATION MARKET BY SOLUTION (USD BILLION) 2020-2029
TABLE 54 SOUTH-EAST ASIA AUTONOMOUS NAVIGATION MARKET BY PLATFORM (USD BILLION) 2020-2029
TABLE 55 SOUTH-EAST ASIA AUTONOMOUS NAVIGATION MARKET BY APPLICATION (USD BILLION) 2020-2029
TABLE 56 REST OF ASIA PACIFIC AUTONOMOUS NAVIGATION MARKET BY SOLUTION (USD BILLION) 2020-2029
TABLE 57 REST OF ASIA PACIFIC AUTONOMOUS NAVIGATION MARKET BY PLATFORM (USD BILLION) 2020-2029
TABLE 58 REST OF ASIA PACIFIC AUTONOMOUS NAVIGATION MARKET BY APPLICATION (USD BILLION) 2020-2029
TABLE 59 EUROPE AUTONOMOUS NAVIGATION MARKET BY COUNTRY (USD BILLION) 2020-2029
TABLE 60 EUROPE AUTONOMOUS NAVIGATION MARKET BY SOLUTION (USD BILLION) 2020-2029
TABLE 61 EUROPE AUTONOMOUS NAVIGATION MARKET BY PLATFORM (USD BILLION) 2020-2029
TABLE 62 EUROPE AUTONOMOUS NAVIGATION MARKET BY APPLICATION (USD BILLION) 2020-2029
TABLE 63 GERMANY AUTONOMOUS NAVIGATION MARKET BY SOLUTION (USD BILLION) 2020-2029
TABLE 64 GERMANY AUTONOMOUS NAVIGATION MARKET BY PLATFORM (USD BILLION) 2020-2029
TABLE 65 GERMANY AUTONOMOUS NAVIGATION MARKET BY APPLICATION (USD BILLION) 2020-2029
TABLE 66 UK AUTONOMOUS NAVIGATION MARKET BY SOLUTION (USD BILLION) 2020-2029
TABLE 67 UK AUTONOMOUS NAVIGATION MARKET BY PLATFORM (USD BILLION) 2020-2029
TABLE 68 UK AUTONOMOUS NAVIGATION MARKET BY APPLICATION (USD BILLION) 2020-2029
TABLE 69 FRANCE AUTONOMOUS NAVIGATION MARKET BY SOLUTION (USD BILLION) 2020-2029
TABLE 70 FRANCE AUTONOMOUS NAVIGATION MARKET BY PLATFORM (USD BILLION) 2020-2029
TABLE 71 FRANCE AUTONOMOUS NAVIGATION MARKET BY APPLICATION (USD BILLION) 2020-2029
TABLE 72 ITALY AUTONOMOUS NAVIGATION MARKET BY SOLUTION (USD BILLION) 2020-2029
TABLE 73 ITALY AUTONOMOUS NAVIGATION MARKET BY PLATFORM (USD BILLION) 2020-2029
TABLE 74 ITALY AUTONOMOUS NAVIGATION MARKET BY APPLICATION (USD BILLION) 2020-2029
TABLE 75 SPAIN AUTONOMOUS NAVIGATION MARKET BY SOLUTION (USD BILLION) 2020-2029
TABLE 76 SPAIN AUTONOMOUS NAVIGATION MARKET BY PLATFORM (USD BILLION) 2020-2029
TABLE 77 SPAIN AUTONOMOUS NAVIGATION MARKET BY APPLICATION (USD BILLION) 2020-2029
TABLE 78 RUSSIA AUTONOMOUS NAVIGATION MARKET BY SOLUTION (USD BILLION) 2020-2029
TABLE 79 RUSSIA AUTONOMOUS NAVIGATION MARKET BY PLATFORM (USD BILLION) 2020-2029
TABLE 80 RUSSIA AUTONOMOUS NAVIGATION MARKET BY APPLICATION (USD BILLION) 2020-2029 TABLE 81 REST OF EUROPE AUTONOMOUS NAVIGATION MARKET BY SOLUTION (USD BILLION) 2020-2029
TABLE 82 REST OF EUROPE AUTONOMOUS NAVIGATION MARKET BY PLATFORM (USD BILLION) 2020-2029
TABLE 83 REST OF EUROPE AUTONOMOUS NAVIGATION MARKET BY APPLICATION (USD BILLION) 2020-2029
TABLE 84 MIDDLE EAST AND AFRICA AUTONOMOUS NAVIGATION MARKET BY COUNTRY (USD BILLION) 2020-2029
TABLE 85 MIDDLE EAST AND AFRICA AUTONOMOUS NAVIGATION MARKET BY SOLUTION (USD BILLION) 2020-2029
TABLE 86 MIDDLE EAST AND AFRICA AUTONOMOUS NAVIGATION MARKET BY PLATFORM (USD BILLION) 2020-2029
TABLE 87 MIDDLE EAST AND AFRICA AUTONOMOUS NAVIGATION MARKET BY APPLICATION (USD BILLION) 2020-2029
TABLE 88 UAE AUTONOMOUS NAVIGATION MARKET BY SOLUTION (USD BILLION) 2020-2029
TABLE 89 UAE AUTONOMOUS NAVIGATION MARKET BY PLATFORM (USD BILLION) 2020-2029
TABLE 90 UAE AUTONOMOUS NAVIGATION MARKET BY APPLICATION (USD BILLION) 2020-2029
TABLE 91 SAUDI ARABIA AUTONOMOUS NAVIGATION MARKET BY SOLUTION (USD BILLION) 2020-2029
TABLE 92 SAUDI ARABIA AUTONOMOUS NAVIGATION MARKET BY PLATFORM (USD BILLION) 2020-2029
TABLE 93 SAUDI ARABIA AUTONOMOUS NAVIGATION MARKET BY APPLICATION (USD BILLION) 2020-2029
TABLE 94 SOUTH AFRICA AUTONOMOUS NAVIGATION MARKET BY SOLUTION (USD BILLION) 2020-2029
TABLE 95 SOUTH AFRICA AUTONOMOUS NAVIGATION MARKET BY PLATFORM (USD BILLION) 2020-2029
TABLE 96 SOUTH AFRICA AUTONOMOUS NAVIGATION MARKET BY APPLICATION (USD BILLION) 2020-2029
TABLE 97 REST OF MIDDLE EAST AND AFRICA AUTONOMOUS NAVIGATION MARKET BY SOLUTION (USD BILLION) 2020-2029
TABLE 98 REST OF MIDDLE EAST AND AFRICA AUTONOMOUS NAVIGATION MARKET BY PLATFORM (USD BILLION) 2020-2029
TABLE 99 REST OF MIDDLE EAST AND AFRICA AUTONOMOUS NAVIGATION MARKET BY APPLICATION (USD BILLION) 2020-2029
LIST OF FIGURES
FIGURE 1 MARKET DYNAMICS
FIGURE 2 MARKET SEGMENTATION
FIGURE 3 REPORT TIMELINES: YEARS CONSIDERED
FIGURE 4 DATA TRIANGULATION
FIGURE 5 BOTTOM-UP APPROACH
FIGURE 6 TOP-DOWN APPROACH
FIGURE 7 RESEARCH FLOW
FIGURE 8 GLOBAL AUTONOMOUS NAVIGATION MARKET BY SOLUTION, USD BILLION, 2020-2029
FIGURE 9 GLOBAL AUTONOMOUS NAVIGATION MARKET BY PLATFORM, USD BILLION, 2020-2029
FIGURE 10 GLOBAL AUTONOMOUS NAVIGATION MARKET BY APPLICATION, USD BILLION, 2020-2029
FIGURE 11 GLOBAL AUTONOMOUS NAVIGATION MARKET BY REGION, USD BILLION, 2020-2029
FIGURE 12 PORTER’S FIVE FORCES MODEL
FIGURE 13 GLOBAL AUTONOMOUS NAVIGATION MARKET BY SOLUTION, USD BILLION, 2021
FIGURE 14 GLOBAL AUTONOMOUS NAVIGATION MARKET BY PLATFORM, USD BILLION, 2021
FIGURE 15 GLOBAL AUTONOMOUS NAVIGATION MARKET BY APPLICATION, USD BILLION, 2021
FIGURE 16 GLOBAL AUTONOMOUS NAVIGATION MARKET BY REGION 2021 USD BILLION
FIGURE 17 MARKET SHARE ANALYSIS
FIGURE 18 RAYTHEON: COMPANY SNAPSHOT
FIGURE 19 THALES: COMPANY SNAPSHOT
FIGURE 20 NORTHROP GRUMMAN: COMPANY SNAPSHOT
FIGURE 21 SAFRAN: COMPANY SNAPSHOT
FIGURE 22 HONEYWELL INTERNATIONAL: COMPANY SNAPSHOT
FIGURE 23 RH MARINE: COMPANY SNAPSHOT
FIGURE 24 NORTHROP GRUMMAN: COMPANY SNAPSHOT
FIGURE 25 KONGSBERG GRUPPEN: COMPANY SNAPSHOT
FIGURE 26 FURUNO: COMPANY SNAPSHOT
FIGURE 27 MOOG INC.: COMPANY SNAPSHOT
FIGURE 28 L3 HARRIS TECHNOLOGIES: COMPANY SNAPSHOT
FIGURE 29 GENERAL DYNAMICS: COMPANY SNAPSHOT
DOWNLOAD FREE SAMPLE REPORT
License Type
SPEAK WITH OUR ANALYST
Want to know more about the report or any specific requirement?
WANT TO CUSTOMIZE THE REPORT?
Our Clients Speak
We asked them to research ‘ Equipment market’ all over the world, and their whole arrangement was helpful to us. thehealthanalytics.com insightful analysis and reports contributed to our current analysis and in creating a future strategy. Besides, the te
Yosuke Mitsui
Senior Associate Construction Equipment Sales & Marketing
We asked them to research ‘Equipment market’ all over the world, and their whole arrangement was helpful to us. thehealthanalytics.com insightful analysis and reports contributed to our current analysis and in creating a future strategy. Besides, the te


