

Base Year Value ()
x.x %
x.x %
CAGR ()
x.x %
x.x %
Forecast Year Value ()
x.x %
x.x %
Historical Data Period
Largest Region
Forecast Period
배터리 유형(리튬 이온, 리튬 폴리머), 표시기(LED 조명, 디지털 디스플레이), 용량(1,000–5,000mAh, 5,001–10,000mAh, 10,001–15,000mAh, 15,001–20,000mAh, 20,001mAh 이상), 응용 분야(스마트폰, 태블릿, 랩톱, 휴대용 미디어 장치, 웨어러블 장치, 디지털 카메라) 및 지역별(북미, 유럽, 아시아 태평양, 남미, 중동 및 아프리카) 2023년부터 2029년까지의 글로벌 트렌드 및 예측
Instant access to hundreds of data points and trends
- Market estimates from 2014-2029
- Competitive analysis, industry segmentation, financial benchmarks
- Incorporates SWOT, Porter's Five Forces and risk management frameworks
- PDF report or online database with Word, Excel and PowerPoint export options
- 100% money back guarantee
파워뱅크 시장 개요:
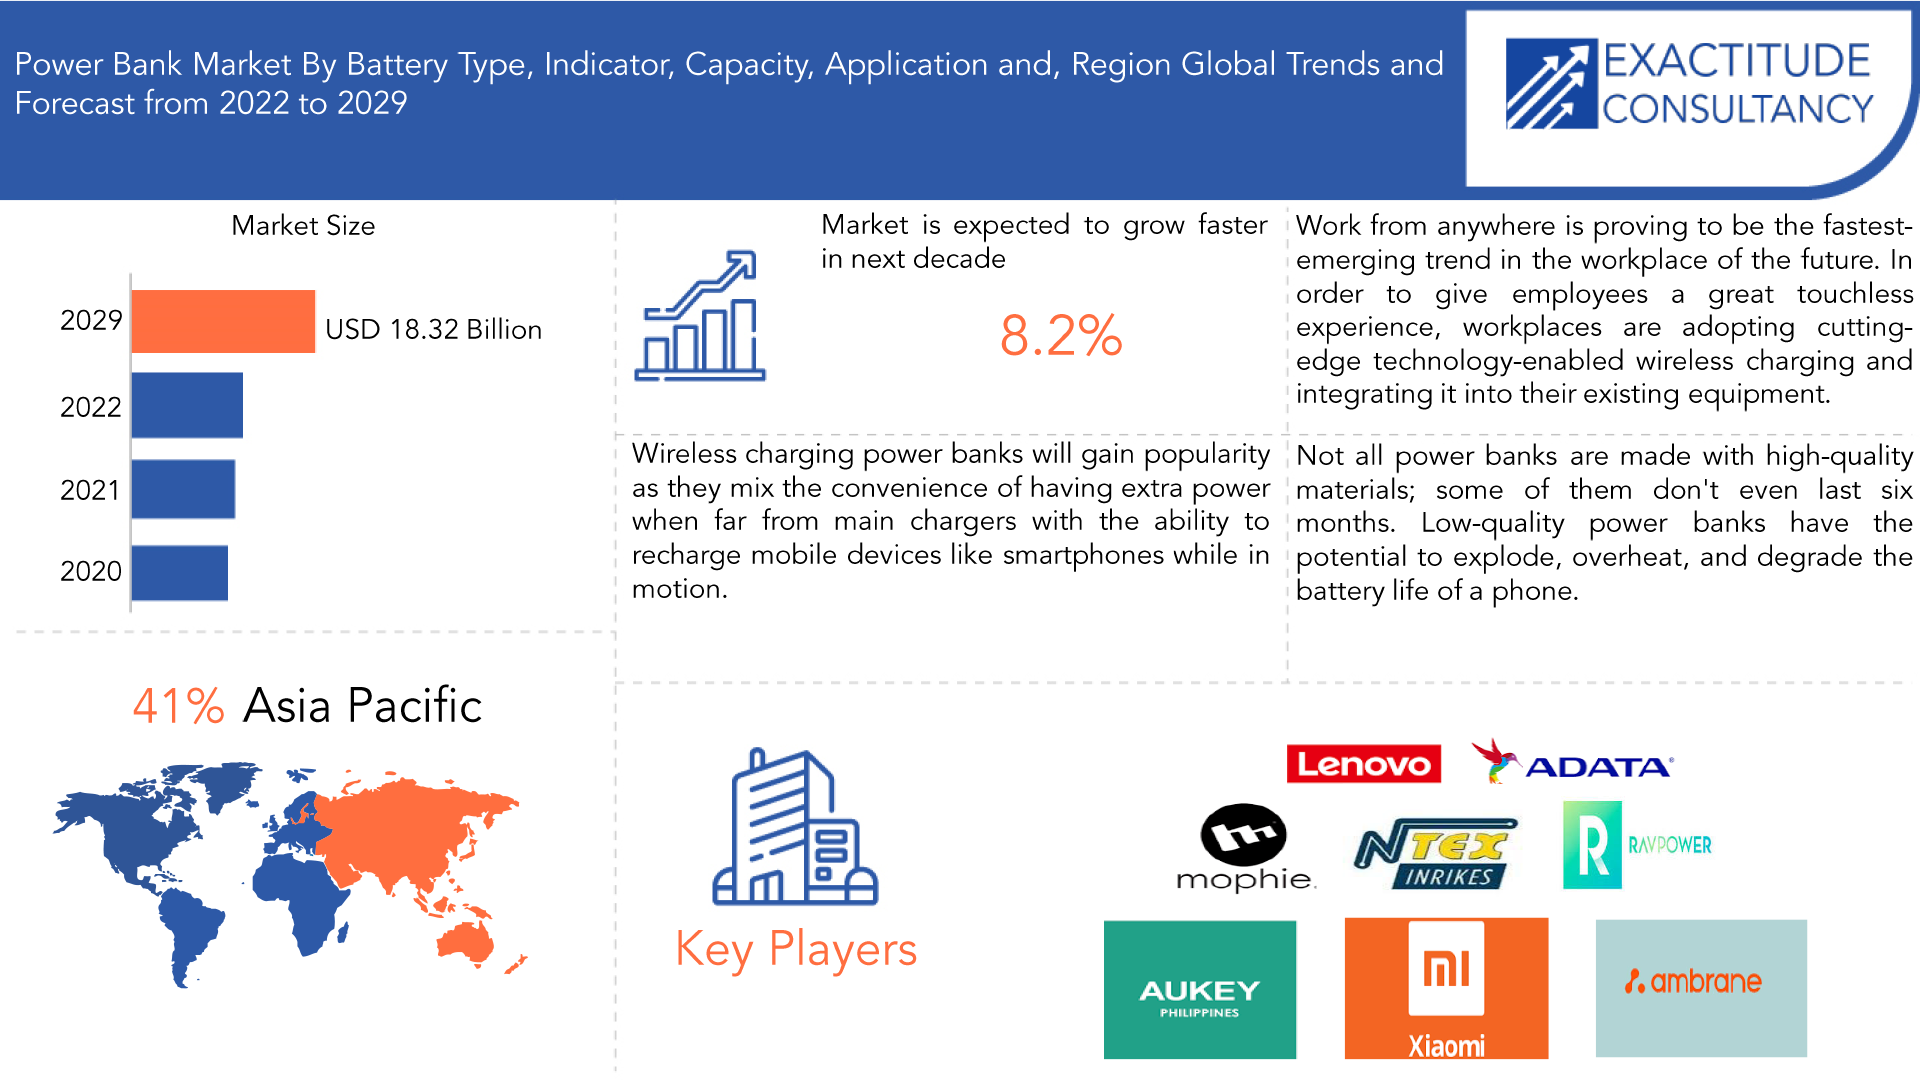
글로벌 파워뱅크 시장은 2022년 106억2000만 달러 규모로 평가됐으며, 2029년까지 183억2000만 달러에 도달할 것으로 예상되며, 2022년부터 2029년까지 연평균 성장률 8.2%로 성장할 것으로 전망된다.
파워뱅크라고 불리는 전기 기기는 다른 전자 기기와 시스템을 충전하는 전원으로 자주 사용됩니다. 더 많은 사람들이 스마트폰, 태블릿, 노트패드 및 디지털 시계와 헤드폰과 같은 다른 기기를 사용함에 따라 파워뱅크는 점점 덜 인기를 얻고 있습니다. 파워뱅크는 전력 부족 문제를 해결하고 연결된 기기에 필요한 전력을 공급합니다. 새로운 기술 항목과 전력 요구 사항의 도입은 IoT, 인공 지능, 혼합 현실과 같은 새로운 기술의 등장과 인터넷 보급으로 인해 촉진되었으며, 이는 파워뱅크 산업의 확장을 촉진하고 있습니다.
스마트폰의 글로벌 채택이 증가함에 따라 파워뱅크는 사람들에게 필수품이 되었습니다. 인터넷 비디오 스트리밍, 게임 프로그램, 소셜 미디어 트렌드의 증가는 모두 휴대폰을 완전히 충전하고 지속적으로 사용하기 위해 안정적인 전원을 요구합니다. 그러나 소비자들은 이동 중에 파워뱅크를 가지고 다니는 것이 매우 번거롭다고 느낍니다. 그 결과, 파워뱅크를 임대하는 시장이 전 세계적으로 생겨나 소비자들이 일정 시간 동안 그렇게 할 수 있게 되었습니다.
| 기인하다 | 세부 |
| 학습 기간 | 2022-2029 |
| 기준년도 | 2021 |
| 추정 연도 | 2022 |
| 예상 연도 | 2022-2029 |
| 역사적 기간 | 2018-2020 |
| 단위 | 가치(10억 달러), 거래량(천 단위) |
| 분할 | 배터리 유형, 표시기, 용량, 응용 분야 및 지역별로 분류됩니다. |
| 배터리 유형별 |
|
| 지표별 |
|
| 용량별 |
|
| 응용 프로그램으로 |
|
| 지역별로 |
|
Folks around the world are moving more and more toward smartphones so users are gravitating more and more toward renting power banks. As smartphones grow more widely used worldwide, power banks have become a need for consumers. A consistent power source is required for internet video streaming, gaming apps, and the growing popularity of social media for the phone to be fully charged and to be used continuously. Consumers, however, believe that carrying a power bank around is difficult. As a result, a booming global market for renting power banks has arisen, allowing customers to do so for a certain period.
Development of power banks using solar and hydrogen fuel cells to facilitate market expansion. For instance, the MINIPAK, a power bank fueled by hydrogen fuel cells, was unveiled by TW Horizon Fuel Cell Technology (China). It uses replaceable and refillable fuel cartridges to recharge a device. The UN standard for metal hydrides is met by the HYDROSTIK cartridge. Uimi Technology Private Limited, Elixier Tech Innovations LLP, Voltaic Systems, EasyAcc, and Bonai are a few companies that sell solar power banks. Solar power banks are a useful option for outages. Solar power banks are fantastic substitutes that use renewable energy sources and may operate continually. It has a user-friendly interface and does not harm the environment telecom power system. These factors will likely lead to a sharp increase in the use of solar power banks.
[caption id="attachment_19603" align="aligncenter" width="1920"]
Frequently Asked Questions
• What is the worth of the global power bank market?
The global power bank market was valued at 10.62 billion in 2022 and is projected to reach 18.32 billion by 2029, growing at a CAGR of 8.2% from 2022 to 2029
• Which market segments are covered in the report on the power bank market?
Based on battery type, indicator, capacity, application, and region the power bank market reports divisions are broken down.
• What is the CAGR of the power bank market?
The global Power Bank market registered a CAGR of 8.2% from 2022 to 2029. The industry segment was the highest revenue contributor to the market.
• Which are the top companies to hold the market share in the power bank market?
Key players profiled in the report include International Paper, Anker Innovations, AUKEY, Xiaomi, ADATA, RAVPower, GRIFFIN, Lenovo, mophie, AMBRANE, NTEX, and others
• Which is the largest regional market for the Power Bank market?
Asia Pacific area is anticipated to experience the quickest growth due to the increasing electronics sector in several developing nations like China and India. The Indian electronics sector is predicted to develop at a rate of 41% and reach USD 400 billion by 2020, according to the Indian Brand Equity Foundation (IBEF). Also, rising investments in the electronics sector contribute to the expansion of the power bank market.
Power Bank Market Segment Analysis:
The power bank market is segmented based on battery type, indicator, capacity, application, and region. By battery type, the market is bifurcated into lithium ion and lithium polymer. By indicator, the market is bifurcated into LED lighting and digital display. By capacity, the market is bifurcated into 1,000–5,000 MAH, 5,001–10,000 MAH, 10,001–15,000 MAH, 15,001–20,000 MAH, ABOVE 20,001 MAH. By application, the market is bifurcated into smartphones, tablets, laptops, portable media devices, wearable devices, and digital cameras.
Based on battery type, indicator, capacity, application, and region, the global market for power banks is divided into these categories.
Lithium-ion and lithium polymer batteries are the two main battery types utilized in power banks. Lithium polymer batteries are rechargeable batteries that have a lithium-ion battery inside a soft polymer casing. Comparatively speaking, lithium polymer power banks are smaller and lighter than lithium-ion power banks. Lithium ions are used by rechargeable lithium-ion batteries, to transfer ions from the electrolyte's negative electrode to the positive electrode. Per unit of mass and space, these batteries offer a high voltage and charge storage capacity. Low, medium, and high price ranges are some of the power bank pricing ranges. Mobile devices such as cell phones, tablets, digital cameras, computers, and others can all be charged using power banks.
Based on the capacity power bank is subdivided into 1,000–5,000 mAh, 5,001–10,000 mAh, 10,001–15,000 mAh, 15,001–20,000 mAh, and Above 20,001 mAh. 1000 mAh is equal to a 1 Amp Hour (AH) rating while holding 5000mAh, which is sufficient for two recharges. Fast charge: when time is of the essence, charge devices more quickly than usual. Enabling pass-through charging enables you to securely charge both the power bank and a device at once. Time to recharge: 3.5 hours. The 10,000 mAh power bank is ideal for people who possess Android or iPhone smartphones because it lets you charge two devices at once. You may charge your gadget using this power bank's USB and Type-C outlets. The smartphone should be able to be charged up to more than six times using a 20,000mAh power bank. Also, the power bank indicator is divided into LED Lighting, and Digital Display.
[caption id="attachment_19609" align="aligncenter" width="1920"]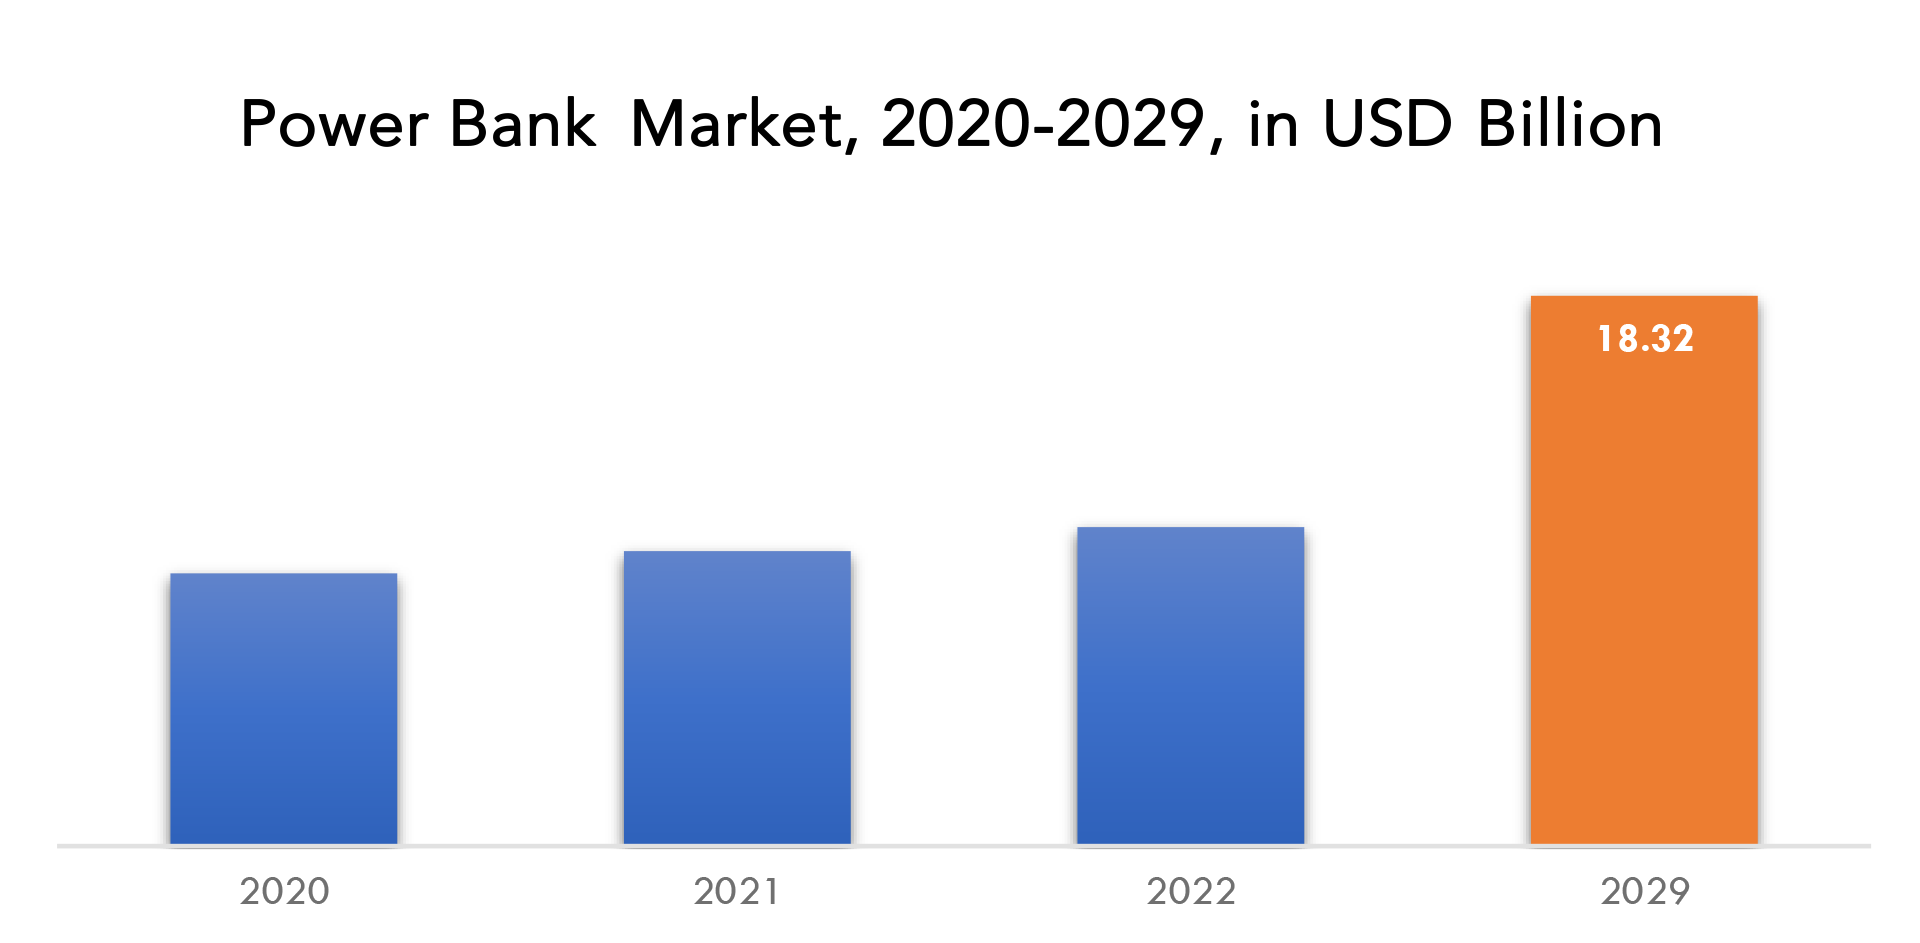
Power Bank Market Players:
The major players operating in the global Power Bank industry include the major market players Anker Innovations, AUKEY, Xiaomi, ADATA, RAVPower, GRIFFIN, Lenovo, mophie, AMBRANE, NTEX, and others
7 February 2023: Lenovo (HKSE: 992) (ADR: LNVGY) and WEKA announced a new global agreement focused on offering solutions for next-generation data management architectures and performance-intensive workloads for delivery in more than 160 markets worldwide. These comprehensive solutions will accelerate artificial intelligence (AI) and analytics for high-performance workloads, including finance, genomics, life science, media, and entertainment applications around the world by fast-moving time to insights while reducing associated prices.
31 January 2023: Lenovo™ announced at Information Systems Europe (ISE 2023) in Barcelona the all-new Think Smart™ View Plus running Microsoft Teams display1, a standalone collaboration display with premium audio, video, and whiteboarding features. The smart collaboration solution is purpose-built for hot desking, phone booths, executive desks, and home office use cases.
Who Should Buy? Or Key Stakeholders
- Manufacturing
- End-Use Industries
- BFSI
- Information Technology
- Manufacturing & Construction
- Regulatory Authorities
- Research Organizations
- Automotive
- Telecommunication
Power Bank Market Regional Analysis:
Geographically, the Power Bank market is segmented into North America, South America, Europe, APAC, and MEA.
- North America: includes the US, Canada, Mexico
- Europe: includes the UK, Germany, France, Italy, Spain, Russia, and the Rest of Europe
- Asia Pacific: includes China, Japan, South Korea, India, Australia, ASEAN, and the Rest of APAC
- South America: includes Brazil, Argentina, and the Rest of South America
- Middle East & Africa: includes Turkey, UAE, Saudi Arabia, South Africa, and the Rest of MEA
Due to the increasing electronics sector in several developing nations like China and India, the Asia Pacific area is anticipated to experience the quickest growth. The Indian electronics sector is predicted to develop at a rate of 41% and reach USD 400 billion by 2020, according to the Indian Brand Equity Foundation (IBEF). Also, rising investments in the electronics sector contribute to the expansion of the power bank market. Thailand Board of Investment estimates that the investment value growth rate in the electronics sector increased from 0.9% in 2017 to 6.3% in 2018. Also, the market for power banks is flourishing due to the electronics industry's growing export capacity.
[caption id="attachment_19610" align="aligncenter" width="1920"]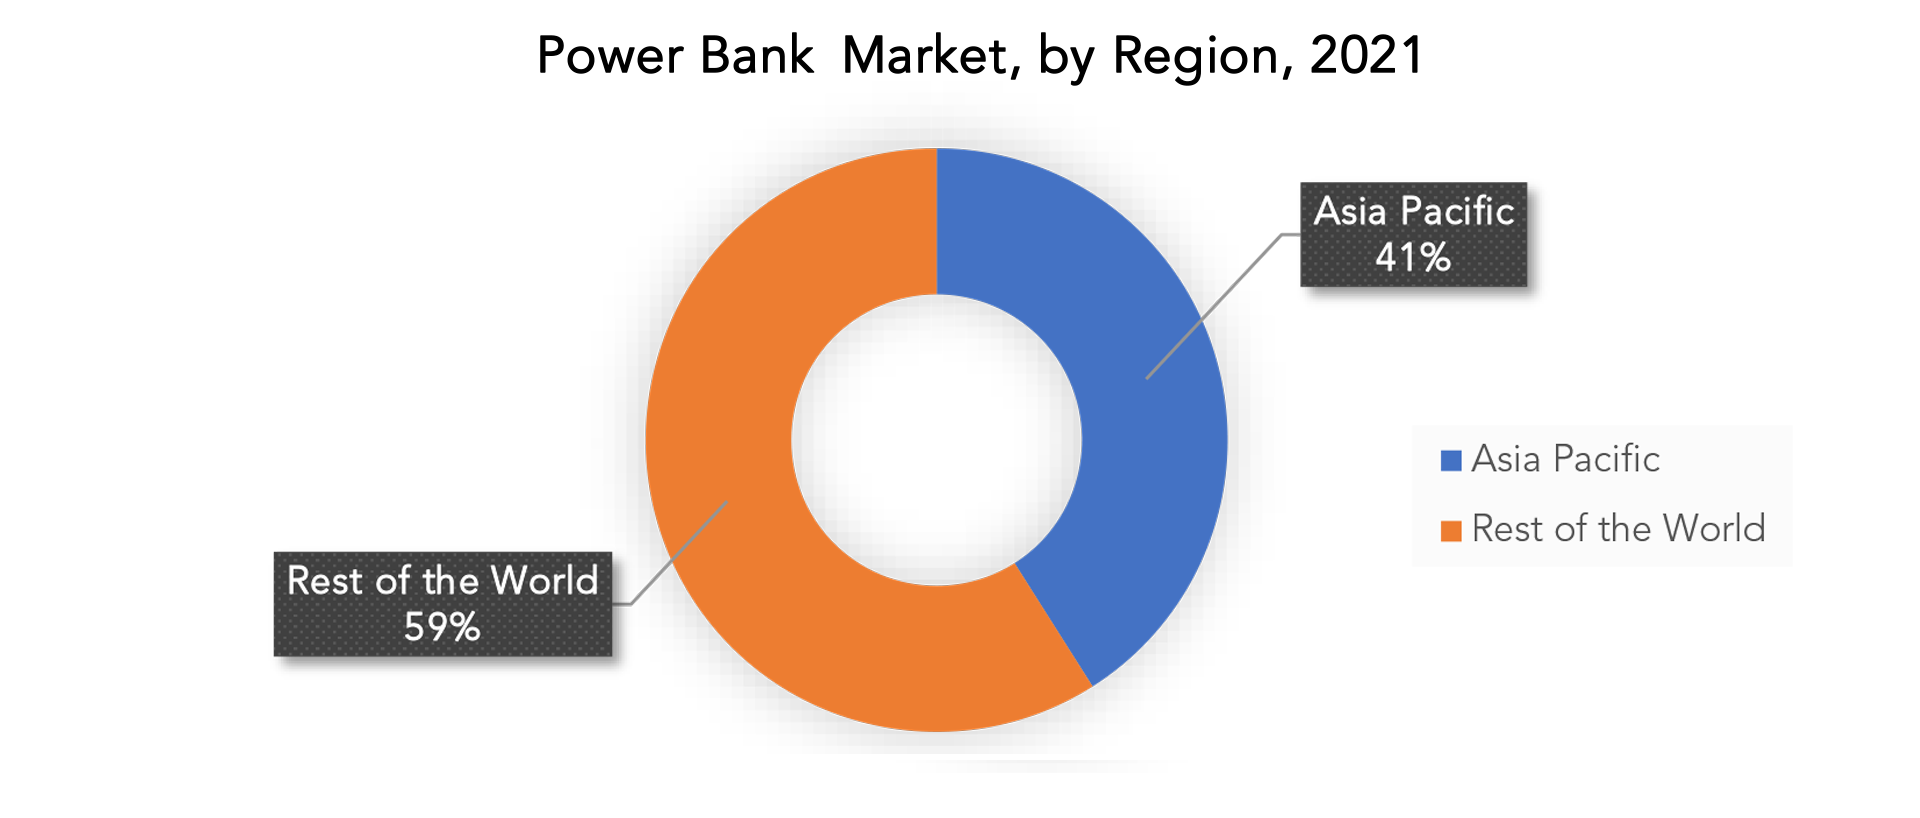
Key Market Segments: Power Bank Market
Power Bank Market By Battery Type, 2020-2029, (USD Billion) (Thousand Units)- Lithium Ion
- Lithium Polymer
- Led Lighting
- Digital Display
- 1,000–5,000 Mah
- 5,001–10,000 Mah
- 10,001–15,000 Mah
- 15,001–20,000 Mah
- Above 20,001 Mah
- Smartphone
- Tablet
- Laptop
- Portable Media Device
- Wearable Device
- Digital Camera
- North America
- Europe
- Asia Pacific
- South America
- Middle East And Africa
Exactitude Consultancy Services Key Objectives:
- Increasing sales and market share
- Developing new technology
- Improving profitability
- Entering new markets
- Enhancing brand reputation
Key Question Answered:
- What is the expected growth rate of the power bank market over the next 7 years?
- Who are the major players in the power bank market and what is their market share?
- What are the end-user industries driving demand for the market and what is their outlook?
- What are the opportunities for growth in emerging markets such as Asia-Pacific, the Middle East, and Africa?
- How is the economic environment affecting the power bank market, including factors such as interest rates, inflation, and exchange rates?
- What is the expected impact of government policies and regulations on the power bank market?
- What is the current and forecasted size and growth rate of the global power bank market?
- What are the key drivers of growth in the power bank market?
- Who are the major players in the market and what is their market share?
- What are the distribution channels and supply chain dynamics in the power bank market?
- What are the technological advancements and innovations in the power bank market and their impact on product development and growth?
- What are the regulatory considerations and their impact on the market?
- What are the challenges faced by players in the power bank market and how are they addressing these challenges?
- What are the opportunities for growth and expansion in the power bank market?
- What are the product offerings and specifications of leading players in the market?
- Introduction
- Market Definition
- Market Segmentation
- Research Timelines
- Assumptions and Limitations
- Research Methodology
- Data Mining
- Secondary Research
- Primary Research
- Subject-Matter Experts’ Advice
- Quality Checks
- Final Review
- Data Triangulation
- Bottom-Up Approach
- Top-Down Approach
- Research Flow
- Data Sources
- Data Mining
- Executive Summary
- Market Overview
- Global Power Bank Market Outlook
- Market Drivers
- Market Restraints
- Market Opportunities
- Impact of Covid-19 On the Power Bank Market
- Porter’s five forces model
- Threat from new entrants
- Threat from substitutes
- Bargaining power of suppliers
- Bargaining power of customers
- Degree of competition
- Industry value chain Analysis
- Global Power Bank Market Outlook
- Global Power Bank Market by Battery Type, 2020-2029, (USD BILLION) (THOUSAND UNITS)
- Lithium Ion
- Lithium Polymer
- Global Power Bank Market by Indicator, 2020-2029, (USD BILLION) (THOUSAND UNITS)
- LED Lighting
- Digital Display
- Global Power Bank Market by Capacity, 2020-2029, (USD BILLION) (THOUSAND UNITS)
- 1,000–5,000 MAH
- 5,001–10,000 MAH
- 10,001–15,000 MAH
- 15,001–20,000 MAH
- ABOVE 20,001 MAH
- Global Power Bank Market by Application, 2020-2029, (USD BILLION) (THOUSAND UNITS)
- Smartphone
- Tablet
- Laptop
- Portable Media Device
- Wearable Device
- Digital Camera
- Global Power Bank Market by Region, 2020-2029, (USD BILLION) (THOUSAND UNITS)
- North America
- US
- Canada
- Mexico
- South America
- Brazil
- Argentina
- Colombia
- Rest of South America
- Europe
- Germany
- UK
- France
- Italy
- Spain
- Russia
- Rest of Europe
- Asia Pacific
- India
- China
- Japan
- South Korea
- Australia
- South-East Asia
- Rest of Asia Pacific
- Middle East and Africa
- UAE
- Saudi Arabia
- South Africa
- Rest of Middle East and Africa
- North America
- Company Profiles*
(Business Overview, Company Snapshot, Products Offered, Recent Developments)
- Anker Innovations
- AUKEY
- Xiaomi
- ADATA
- RAVPower
- GRIFFIN
- Lenovo
- mophie
- AMBRANE
- NTEX
*The Company List Is Indicative
LIST OF TABLES
TABLE 1 GLOBAL POWER BANK MARKET BY BATTERY TYPE (USD BILLION) 2020-2029
TABLE 2 GLOBAL POWER BANK MARKET BY BATTERY TYPE (THOUSAND UNITS) 2020-2029
TABLE 3 GLOBAL POWER BANK MARKET BY INDICATOR (USD BILLION) 2020-2029
TABLE 4 GLOBAL POWER BANK MARKET BY INDICATOR (THOUSAND UNITS) 2020-2029
TABLE 5 GLOBAL POWER BANK MARKET BY CAPACITY (USD BILLION) 2020-2029
TABLE 6 GLOBAL POWER BANK MARKET BY CAPACITY (THOUSAND UNITS) 2020-2029
TABLE 7 GLOBAL POWER BANK MARKET BY APPLICATION (USD BILLION) 2020-2029
TABLE 8 GLOBAL POWER BANK MARKET BY APPLICATION (THOUSAND UNITS) 2020-2029
TABLE 9 GLOBAL POWER BANK MARKET BY REGION (USD BILLION) 2020-2029
TABLE 10 GLOBAL POWER BANK MARKET BY REGION (THOUSAND UNITS) 2020-2029
TABLE 11 NORTH AMERICA POWER BANK MARKET BY BATTERY TYPE (USD BILLION) 2020-2029
TABLE 12 NORTH AMERICA POWER BANK MARKET BY BATTERY TYPE (THOUSAND UNITS) 2020-2029
TABLE 13 NORTH AMERICA POWER BANK MARKET BY INDICATOR (USD BILLION) 2020-2029
TABLE 14 NORTH AMERICA POWER BANK MARKET BY INDICATOR (THOUSAND UNITS) 2020-2029
TABLE 15 NORTH AMERICA POWER BANK MARKET BY CAPACITY (USD BILLION) 2020-2029
TABLE 16 NORTH AMERICA POWER BANK MARKET BY CAPACITY (THOUSAND UNITS) 2020-2029
TABLE 17 NORTH AMERICA POWER BANK MARKET BY APPLICATION (USD BILLION) 2020-2029
TABLE 18 NORTH AMERICA POWER BANK MARKET BY APPLICATION (THOUSAND UNITS) 2020-2029
TABLE 19 NORTH AMERICA POWER BANK MARKET BY COUNTRY (USD BILLION) 2020-2029
TABLE 20 NORTH AMERICA POWER BANK MARKET BY COUNTRY (THOUSAND UNITS) 2020-2029
TABLE 21 US POWER BANK MARKET BY BATTERY TYPE (USD BILLION) 2020-2029
TABLE 22 US POWER BANK MARKET BY BATTERY TYPE (THOUSAND UNITS) 2020-2029
TABLE 23 US POWER BANK MARKET BY INDICATOR (USD BILLION) 2020-2029
TABLE 24 US POWER BANK MARKET BY INDICATOR (THOUSAND UNITS) 2020-2029
TABLE 25 US POWER BANK MARKET BY CAPACITY (USD BILLION) 2020-2029
TABLE 26 US POWER BANK MARKET BY CAPACITY (THOUSAND UNITS) 2020-2029
TABLE 27 US POWER BANK MARKET BY APPLICATION (USD BILLION) 2020-2029
TABLE 28 US POWER BANK MARKET BY APPLICATION (THOUSAND UNITS) 2020-2029
TABLE 29 CANADA POWER BANK MARKET BY BATTERY TYPE (USD BILLION) 2020-2029
TABLE 30 CANADA POWER BANK MARKET BY BATTERY TYPE (THOUSAND UNITS) 2020-2029
TABLE 31 CANADA POWER BANK MARKET BY INDICATOR (USD BILLION) 2020-2029
TABLE 32 CANADA POWER BANK MARKET BY INDICATOR (THOUSAND UNITS) 2020-2029
TABLE 33 CANADA POWER BANK MARKET BY CAPACITY (USD BILLION) 2020-2029
TABLE 34 CANADA POWER BANK MARKET BY CAPACITY (THOUSAND UNITS) 2020-2029
TABLE 35 CANADA POWER BANK MARKET BY APPLICATION (USD BILLION) 2020-2029
TABLE 36 CANADA POWER BANK MARKET BY APPLICATION (THOUSAND UNITS) 2020-2029
TABLE 37 MEXICO POWER BANK MARKET BY BATTERY TYPE (USD BILLION) 2020-2029
TABLE 38 MEXICO POWER BANK MARKET BY BATTERY TYPE (THOUSAND UNITS) 2020-2029
TABLE 39 MEXICO POWER BANK MARKET BY INDICATOR (USD BILLION) 2020-2029
TABLE 40 MEXICO POWER BANK MARKET BY INDICATOR (THOUSAND UNITS) 2020-2029
TABLE 41 MEXICO POWER BANK MARKET BY CAPACITY (USD BILLION) 2020-2029
TABLE 42 MEXICO POWER BANK MARKET BY CAPACITY (THOUSAND UNITS) 2020-2029
TABLE 43 MEXICO POWER BANK MARKET BY APPLICATION (USD BILLION) 2020-2029
TABLE 44 MEXICO POWER BANK MARKET BY APPLICATION (THOUSAND UNITS) 2020-2029
TABLE 45 SOUTH AMERICA POWER BANK MARKET BY BATTERY TYPE (USD BILLION) 2020-2029
TABLE 46 SOUTH AMERICA POWER BANK MARKET BY BATTERY TYPE (THOUSAND UNITS) 2020-2029
TABLE 47 SOUTH AMERICA POWER BANK MARKET BY INDICATOR (USD BILLION) 2020-2029
TABLE 48 SOUTH AMERICA POWER BANK MARKET BY INDICATOR (THOUSAND UNITS) 2020-2029
TABLE 49 SOUTH AMERICA POWER BANK MARKET BY CAPACITY (USD BILLION) 2020-2029
TABLE 50 SOUTH AMERICA POWER BANK MARKET BY CAPACITY (THOUSAND UNITS) 2020-2029
TABLE 51 SOUTH AMERICA POWER BANK MARKET BY APPLICATION (USD BILLION) 2020-2029
TABLE 52 SOUTH AMERICA POWER BANK MARKET BY APPLICATION (THOUSAND UNITS) 2020-2029
TABLE 53 SOUTH AMERICA POWER BANK MARKET BY COUNTRY (USD BILLION) 2020-2029
TABLE 54 SOUTH AMERICA POWER BANK MARKET BY COUNTRY (THOUSAND UNITS) 2020-2029
TABLE 55 BRAZIL POWER BANK MARKET BY BATTERY TYPE (USD BILLION) 2020-2029
TABLE 56 BRAZIL POWER BANK MARKET BY BATTERY TYPE (THOUSAND UNITS) 2020-2029
TABLE 57 BRAZIL POWER BANK MARKET BY INDICATOR (USD BILLION) 2020-2029
TABLE 58 BRAZIL POWER BANK MARKET BY INDICATOR (THOUSAND UNITS) 2020-2029
TABLE 59 BRAZIL POWER BANK MARKET BY CAPACITY (USD BILLION) 2020-2029
TABLE 60 BRAZIL POWER BANK MARKET BY CAPACITY (THOUSAND UNITS) 2020-2029
TABLE 61 BRAZIL POWER BANK MARKET BY APPLICATION (USD BILLION) 2020-2029
TABLE 62 BRAZIL POWER BANK MARKET BY APPLICATION (THOUSAND UNITS) 2020-2029
TABLE 63 ARGENTINA POWER BANK MARKET BY BATTERY TYPE (USD BILLION) 2020-2029
TABLE 64 ARGENTINA POWER BANK MARKET BY BATTERY TYPE (THOUSAND UNITS) 2020-2029
TABLE 65 ARGENTINA POWER BANK MARKET BY INDICATOR (USD BILLION) 2020-2029
TABLE 66 ARGENTINA POWER BANK MARKET BY INDICATOR (THOUSAND UNITS) 2020-2029
TABLE 67 ARGENTINA POWER BANK MARKET BY CAPACITY (USD BILLION) 2020-2029
TABLE 68 ARGENTINA POWER BANK MARKET BY CAPACITY (THOUSAND UNITS) 2020-2029
TABLE 69 ARGENTINA POWER BANK MARKET BY APPLICATION (USD BILLION) 2020-2029
TABLE 70 ARGENTINA POWER BANK MARKET BY APPLICATION (THOUSAND UNITS) 2020-2029
TABLE 71 COLOMBIA POWER BANK MARKET BY BATTERY TYPE (USD BILLION) 2020-2029
TABLE 72 COLOMBIA POWER BANK MARKET BY BATTERY TYPE (THOUSAND UNITS) 2020-2029
TABLE 73 COLOMBIA POWER BANK MARKET BY INDICATOR (USD BILLION) 2020-2029
TABLE 74 COLOMBIA POWER BANK MARKET BY INDICATOR (THOUSAND UNITS) 2020-2029
TABLE 75 COLOMBIA POWER BANK MARKET BY CAPACITY (USD BILLION) 2020-2029
TABLE 76 COLOMBIA POWER BANK MARKET BY CAPACITY (THOUSAND UNITS) 2020-2029
TABLE 77 COLOMBIA POWER BANK MARKET BY APPLICATION (USD BILLION) 2020-2029
TABLE 78 COLOMBIA POWER BANK MARKET BY APPLICATION (THOUSAND UNITS) 2020-2029
TABLE 79 REST OF SOUTH AMERICA POWER BANK MARKET BY BATTERY TYPE (USD BILLION) 2020-2029
TABLE 80 REST OF THE SOUTH AMERICA POWER BANK MARKET BY BATTERY TYPE (THOUSAND UNITS) 2020-2029
TABLE 81 REST OF SOUTH AMERICA POWER BANK MARKET BY INDICATOR (USD BILLION) 2020-2029
TABLE 82 REST OF THE SOUTH AMERICA POWER BANK MARKET BY INDICATOR (THOUSAND UNITS) 2020-2029
TABLE 83 REST OF SOUTH AMERICA POWER BANK MARKET BY CAPACITY (USD BILLION) 2020-2029
TABLE 84 REST OF THE SOUTH AMERICA POWER BANK MARKET BY CAPACITY (THOUSAND UNITS) 2020-2029
TABLE 85 REST OF SOUTH AMERICA POWER BANK MARKET BY APPLICATION (USD BILLION) 2020-2029
TABLE 86 REST OF SOUTH AMERICA POWER BANK MARKET BY APPLICATION (THOUSAND UNITS) 2020-2029
TABLE 87 ASIA-PACIFIC POWER BANK MARKET BY BATTERY TYPE (USD BILLION) 2020-2029
TABLE 88 ASIA-PACIFIC POWER BANK MARKET BY BATTERY TYPE (THOUSAND UNITS) 2020-2029
TABLE 89 ASIA-PACIFIC POWER BANK MARKET BY INDICATOR (USD BILLION) 2020-2029
TABLE 90 ASIA-PACIFIC POWER BANK MARKET BY INDICATOR (THOUSAND UNITS) 2020-2029
TABLE 91 ASIA-PACIFIC POWER BANK MARKET BY CAPACITY (USD BILLION) 2020-2029
TABLE 92 ASIA-PACIFIC POWER BANK MARKET BY CAPACITY (THOUSAND UNITS) 2020-2029
TABLE 93 ASIA-PACIFIC POWER BANK MARKET BY APPLICATION (USD BILLION) 2020-2029
TABLE 94 ASIA-PACIFIC POWER BANK MARKET BY APPLICATION (THOUSAND UNITS) 2020-2029
TABLE 95 ASIA-PACIFIC POWER BANK MARKET BY COUNTRY (USD BILLION) 2020-2029
TABLE 96 ASIA-PACIFIC POWER BANK MARKET BY COUNTRY (THOUSAND UNITS) 2020-2029
TABLE 97 INDIA POWER BANK MARKET BY BATTERY TYPE (USD BILLION) 2020-2029
TABLE 98 INDIA POWER BANK MARKET BY BATTERY TYPE (THOUSAND UNITS) 2020-2029
TABLE 99 INDIA POWER BANK MARKET BY INDICATOR (USD BILLION) 2020-2029
TABLE 100 INDIA POWER BANK MARKET BY INDICATOR (THOUSAND UNITS) 2020-2029
TABLE 101 INDIA POWER BANK MARKET BY CAPACITY (USD BILLION) 2020-2029
TABLE 102 INDIA POWER BANK MARKET BY CAPACITY (THOUSAND UNITS) 2020-2029
TABLE 103 INDIA POWER BANK MARKET BY APPLICATION (USD BILLION) 2020-2029
TABLE 104 INDIA POWER BANK MARKET BY APPLICATION (THOUSAND UNITS) 2020-2029
TABLE 105 CHINA POWER BANK MARKET BY BATTERY TYPE (USD BILLION) 2020-2029
TABLE 106 CHINA POWER BANK MARKET BY BATTERY TYPE (THOUSAND UNITS) 2020-2029
TABLE 107 CHINA POWER BANK MARKET BY INDICATOR (USD BILLION) 2020-2029
TABLE 108 CHINA POWER BANK MARKET BY INDICATOR (THOUSAND UNITS) 2020-2029
TABLE 109 CHINA POWER BANK MARKET BY CAPACITY (USD BILLION) 2020-2029
TABLE 110 CHINA POWER BANK MARKET BY CAPACITY (THOUSAND UNITS) 2020-2029
TABLE 111 CHINA POWER BANK MARKET BY APPLICATION (USD BILLION) 2020-2029
TABLE 112 CHINA POWER BANK MARKET BY APPLICATION (THOUSAND UNITS) 2020-2029
TABLE 113 JAPAN POWER BANK MARKET BY BATTERY TYPE (USD BILLION) 2020-2029
TABLE 114 JAPAN POWER BANK MARKET BY BATTERY TYPE (THOUSAND UNITS) 2020-2029
TABLE 115 JAPAN POWER BANK MARKET BY INDICATOR (USD BILLION) 2020-2029
TABLE 116 JAPAN POWER BANK MARKET BY INDICATOR (THOUSAND UNITS) 2020-2029
TABLE 117 JAPAN POWER BANK MARKET BY CAPACITY (USD BILLION) 2020-2029
TABLE 118 JAPAN POWER BANK MARKET BY CAPACITY (THOUSAND UNITS) 2020-2029
TABLE 119 JAPAN POWER BANK MARKET BY APPLICATION (USD BILLION) 2020-2029
TABLE 120 JAPAN POWER BANK MARKET BY APPLICATION (THOUSAND UNITS) 2020-2029
TABLE 121 SOUTH KOREA POWER BANK MARKET BY BATTERY TYPE (USD BILLION) 2020-2029
TABLE 122 SOUTH KOREA POWER BANK MARKET BY BATTERY TYPE (THOUSAND UNITS) 2020-2029
TABLE 123 SOUTH KOREA POWER BANK MARKET BY INDICATOR (USD BILLION) 2020-2029
TABLE 124 SOUTH KOREA POWER BANK MARKET BY INDICATOR (THOUSAND UNITS) 2020-2029
TABLE 125 SOUTH KOREA POWER BANK MARKET BY CAPACITY (USD BILLION) 2020-2029
TABLE 126 SOUTH KOREA POWER BANK MARKET BY CAPACITY (THOUSAND UNITS) 2020-2029
TABLE 127 SOUTH KOREA POWER BANK MARKET BY APPLICATION (USD BILLION) 2020-2029
TABLE 128 SOUTH KOREA POWER BANK MARKET BY APPLICATION (THOUSAND UNITS) 2020-2029
TABLE 129 AUSTRALIA POWER BANK MARKET BY BATTERY TYPE (USD BILLION) 2020-2029
TABLE 130 AUSTRALIA POWER BANK MARKET BY BATTERY TYPE (THOUSAND UNITS) 2020-2029
TABLE 131 AUSTRALIA POWER BANK MARKET BY INDICATOR (USD BILLION) 2020-2029
TABLE 132 AUSTRALIA POWER BANK MARKET BY INDICATOR (THOUSAND UNITS) 2020-2029
TABLE 133 AUSTRALIA POWER BANK MARKET BY CAPACITY (USD BILLION) 2020-2029
TABLE 134 AUSTRALIA POWER BANK MARKET BY CAPACITY (THOUSAND UNITS) 2020-2029
TABLE 135 AUSTRALIA POWER BANK MARKET BY APPLICATION (USD BILLION) 2020-2029
TABLE 136 AUSTRALIA POWER BANK MARKET BY APPLICATION (THOUSAND UNITS) 2020-2029
TABLE 137 SOUTH-EAST ASIA POWER BANK MARKET BY BATTERY TYPE (USD BILLION) 2020-2029
TABLE 138 SOUTH-EAST ASIA POWER BANK MARKET BY BATTERY TYPE (THOUSAND UNITS) 2020-2029
TABLE 139 SOUTH-EAST ASIA POWER BANK MARKET BY INDICATOR (USD BILLION) 2020-2029
TABLE 140 SOUTH-EAST ASIA POWER BANK MARKET BY INDICATOR (THOUSAND UNITS) 2020-2029
TABLE 141 SOUTH-EAST ASIA POWER BANK MARKET BY CAPACITY (USD BILLION) 2020-2029
TABLE 142 SOUTH-EAST ASIA POWER BANK MARKET BY CAPACITY (THOUSAND UNITS) 2020-2029
TABLE 143 SOUTH-EAST ASIA POWER BANK MARKET BY APPLICATION (USD BILLION) 2020-2029
TABLE 144 SOUTH-EAST ASIA POWER BANK MARKET BY APPLICATION (THOUSAND UNITS) 2020-2029
TABLE 145 REST OF ASIA PACIFIC POWER BANK MARKET BY BATTERY TYPE (USD BILLION) 2020-2029
TABLE 146 REST OF THE ASIA PACIFIC POWER BANK MARKET BY BATTERY TYPE (THOUSAND UNITS) 2020-2029
TABLE 147 REST OF ASIA PACIFIC POWER BANK MARKET BY INDICATOR (USD BILLION) 2020-2029
TABLE 148 REST OF ASIA PACIFIC POWER BANK MARKET BY INDICATOR (THOUSAND UNITS) 2020-2029
TABLE 149 REST OF ASIA PACIFIC POWER BANK MARKET BY CAPACITY (USD BILLION) 2020-2029
TABLE 150 REST OF ASIA PACIFIC POWER BANK MARKET BY CAPACITY (THOUSAND UNITS) 2020-2029
TABLE 151 REST OF ASIA PACIFIC POWER BANK MARKET BY APPLICATION (USD BILLION) 2020-2029
TABLE 152 REST OF ASIA PACIFIC POWER BANK MARKET BY APPLICATION (THOUSAND UNITS) 2020-2029
TABLE 153 EUROPE POWER BANK MARKET BY BATTERY TYPE (USD BILLION) 2020-2029
TABLE 154 EUROPE POWER BANK MARKET BY BATTERY TYPE (THOUSAND UNITS) 2020-2029
TABLE 155 EUROPE POWER BANK MARKET BY INDICATOR (USD BILLION) 2020-2029
TABLE 156 EUROPE POWER BANK MARKET BY INDICATOR (THOUSAND UNITS) 2020-2029
TABLE 157 EUROPE POWER BANK MARKET BY CAPACITY (USD BILLION) 2020-2029
TABLE 158 EUROPE POWER BANK MARKET BY CAPACITY (THOUSAND UNITS) 2020-2029
TABLE 159 EUROPE POWER BANK MARKET BY APPLICATION (USD BILLION) 2020-2029
TABLE 160 EUROPE POWER BANK MARKET BY APPLICATION (THOUSAND UNITS) 2020-2029
TABLE 161 EUROPE POWER BANK MARKET BY COUNTRY (USD BILLION) 2020-2029
TABLE 162 EUROPE POWER BANK MARKET BY COUNTRY (THOUSAND UNITS) 2020-2029
TABLE 163 GERMANY POWER BANK MARKET BY BATTERY TYPE (USD BILLION) 2020-2029
TABLE 164 GERMANY POWER BANK MARKET BY BATTERY TYPE (THOUSAND UNITS) 2020-2029
TABLE 165 GERMANY POWER BANK MARKET BY INDICATOR (USD BILLION) 2020-2029
TABLE 166 GERMANY POWER BANK MARKET BY INDICATOR (THOUSAND UNITS) 2020-2029
TABLE 167 GERMANY POWER BANK MARKET BY CAPACITY (USD BILLION) 2020-2029
TABLE 168 GERMANY POWER BANK MARKET BY CAPACITY (THOUSAND UNITS) 2020-2029
TABLE 169 GERMANY POWER BANK MARKET BY APPLICATION (USD BILLION) 2020-2029
TABLE 170 GERMANY POWER BANK MARKET BY APPLICATION (THOUSAND UNITS) 2020-2029
TABLE 171 UK POWER BANK MARKET BY BATTERY TYPE (USD BILLION) 2020-2029
TABLE 172 UK POWER BANK MARKET BY BATTERY TYPE (THOUSAND UNITS) 2020-2029
TABLE 173 UK POWER BANK MARKET BY INDICATOR (USD BILLION) 2020-2029
TABLE 174 UK POWER BANK MARKET BY INDICATOR (THOUSAND UNITS) 2020-2029
TABLE 175 UK POWER BANK MARKET BY CAPACITY (USD BILLION) 2020-2029
TABLE 176 UK POWER BANK MARKET BY CAPACITY (THOUSAND UNITS) 2020-2029
TABLE 177 UK POWER BANK MARKET BY APPLICATION (USD BILLION) 2020-2029
TABLE 178 UK POWER BANK MARKET BY APPLICATION (THOUSAND UNITS) 2020-2029
TABLE 179 FRANCE POWER BANK MARKET BY BATTERY TYPE (USD BILLION) 2020-2029
TABLE 180 FRANCE POWER BANK MARKET BY BATTERY TYPE (THOUSAND UNITS) 2020-2029
TABLE 181 FRANCE POWER BANK MARKET BY INDICATOR (USD BILLION) 2020-2029
TABLE 182 FRANCE POWER BANK MARKET BY INDICATOR (THOUSAND UNITS) 2020-2029
TABLE 183 FRANCE POWER BANK MARKET BY CAPACITY (USD BILLION) 2020-2029
TABLE 184 FRANCE POWER BANK MARKET BY CAPACITY (THOUSAND UNITS) 2020-2029
TABLE 185 FRANCE POWER BANK MARKET BY APPLICATION (USD BILLION) 2020-2029
TABLE 186 FRANCE POWER BANK MARKET BY APPLICATION (THOUSAND UNITS) 2020-2029
TABLE 187 ITALY POWER BANK MARKET BY BATTERY TYPE (USD BILLION) 2020-2029
TABLE 188 ITALY POWER BANK MARKET BY BATTERY TYPE (THOUSAND UNITS) 2020-2029
TABLE 189 ITALY POWER BANK MARKET BY INDICATOR (USD BILLION) 2020-2029
TABLE 190 ITALY POWER BANK MARKET BY INDICATOR (THOUSAND UNITS) 2020-2029
TABLE 191 ITALY POWER BANK MARKET BY CAPACITY (USD BILLION) 2020-2029
TABLE 192 ITALY POWER BANK MARKET BY CAPACITY (THOUSAND UNITS) 2020-2029
TABLE 193 ITALY POWER BANK MARKET BY APPLICATION (USD BILLION) 2020-2029
TABLE 194 ITALY POWER BANK MARKET BY APPLICATION (THOUSAND UNITS) 2020-2029
TABLE 195 SPAIN POWER BANK MARKET BY BATTERY TYPE (USD BILLION) 2020-2029
TABLE 196 SPAIN POWER BANK MARKET BY BATTERY TYPE (THOUSAND UNITS) 2020-2029
TABLE 197 SPAIN POWER BANK MARKET BY INDICATOR (USD BILLION) 2020-2029
TABLE 198 SPAIN POWER BANK MARKET BY INDICATOR (THOUSAND UNITS) 2020-2029
TABLE 199 SPAIN POWER BANK MARKET BY CAPACITY (USD BILLION) 2020-2029
TABLE 200 SPAIN POWER BANK MARKET BY CAPACITY (THOUSAND UNITS) 2020-2029
TABLE 201 SPAIN POWER BANK MARKET BY APPLICATION (USD BILLION) 2020-2029
TABLE 202 SPAIN POWER BANK MARKET BY APPLICATION (THOUSAND UNITS) 2020-2029
TABLE 203 RUSSIA POWER BANK MARKET BY BATTERY TYPE (USD BILLION) 2020-2029
TABLE 204 RUSSIA POWER BANK MARKET BY BATTERY TYPE (THOUSAND UNITS) 2020-2029
TABLE 205 RUSSIA POWER BANK MARKET BY INDICATOR (USD BILLION) 2020-2029
TABLE 206 RUSSIA POWER BANK MARKET BY INDICATOR (THOUSAND UNITS) 2020-2029
TABLE 207 RUSSIA POWER BANK MARKET BY CAPACITY (USD BILLION) 2020-2029
TABLE 208 RUSSIA POWER BANK MARKET BY CAPACITY (THOUSAND UNITS) 2020-2029
TABLE 209 RUSSIA POWER BANK MARKET BY APPLICATION (USD BILLION) 2020-2029
TABLE 210 RUSSIA POWER BANK MARKET BY APPLICATION (THOUSAND UNITS) 2020-2029
TABLE 211 REST OF EUROPE POWER BANK MARKET BY BATTERY TYPE (USD BILLION) 2020-2029
TABLE 212 REST OF EUROPE POWER BANK MARKET BY BATTERY TYPE (THOUSAND UNITS) 2020-2029
TABLE 213 REST OF EUROPE POWER BANK MARKET BY INDICATOR (USD BILLION) 2020-2029
TABLE 214 REST OF EUROPE POWER BANK MARKET BY INDICATOR (THOUSAND UNITS) 2020-2029
TABLE 215 REST OF EUROPE POWER BANK MARKET BY CAPACITY (USD BILLION) 2020-2029
TABLE 216 REST OF EUROPE POWER BANK MARKET BY CAPACITY (THOUSAND UNITS) 2020-2029
TABLE 217 REST OF EUROPE POWER BANK MARKET BY APPLICATION (USD BILLION) 2020-2029
TABLE 218 REST OF EUROPE POWER BANK MARKET BY APPLICATION (THOUSAND UNITS) 2020-2029
TABLE 219 MIDDLE EAST AND AFRICA POWER BANK MARKET BY BATTERY TYPE (USD BILLION) 2020-2029
TABLE 220 MIDDLE EAST AND AFRICA POWER BANK MARKET BY BATTERY TYPE (THOUSAND UNITS) 2020-2029
TABLE 221 MIDDLE EAST AND AFRICA POWER BANK MARKET BY INDICATOR (USD BILLION) 2020-2029
TABLE 222 MIDDLE EAST AND AFRICA POWER BANK MARKET BY INDICATOR (THOUSAND UNITS) 2020-2029
TABLE 223 MIDDLE EAST AND AFRICA POWER BANK MARKET BY CAPACITY (USD BILLION) 2020-2029
TABLE 224 MIDDLE EAST AND AFRICA POWER BANK MARKET BY CAPACITY (THOUSAND UNITS) 2020-2029
TABLE 225 MIDDLE EAST AND AFRICA POWER BANK MARKET BY APPLICATION (USD BILLION) 2020-2029
TABLE 226 MIDDLE EAST AND AFRICA POWER BANK MARKET BY APPLICATION (THOUSAND UNITS) 2020-2029
TABLE 227 MIDDLE EAST AND AFRICA POWER BANK MARKET BY COUNTRY (USD BILLION) 2020-2029
TABLE 228 MIDDLE EAST AND AFRICA POWER BANK MARKET BY COUNTRY (THOUSAND UNITS) 2020-2029
TABLE 229 UAE POWER BANK MARKET BY BATTERY TYPE (USD BILLION) 2020-2029
TABLE 230 UAE POWER BANK MARKET BY BATTERY TYPE (THOUSAND UNITS) 2020-2029
TABLE 231 UAE POWER BANK MARKET BY INDICATOR (USD BILLION) 2020-2029
TABLE 232 UAE POWER BANK MARKET BY INDICATOR (THOUSAND UNITS) 2020-2029
TABLE 233 UAE POWER BANK MARKET BY CAPACITY (USD BILLION) 2020-2029
TABLE 234 UAE POWER BANK MARKET BY CAPACITY (THOUSAND UNITS) 2020-2029
TABLE 235 UAE POWER BANK MARKET BY APPLICATION (USD BILLION) 2020-2029
TABLE 236 UAE POWER BANK MARKET BY APPLICATION (THOUSAND UNITS) 2020-2029
TABLE 237 SAUDI ARABIA POWER BANK MARKET BY BATTERY TYPE (USD BILLION) 2020-2029
TABLE 238 SAUDI ARABIA POWER BANK MARKET BY BATTERY TYPE (THOUSAND UNITS) 2020-2029
TABLE 239 SAUDI ARABIA POWER BANK MARKET BY INDICATOR (USD BILLION) 2020-2029
TABLE 240 SAUDI ARABIA POWER BANK MARKET BY INDICATOR (THOUSAND UNITS) 2020-2029
TABLE 241 SAUDI ARABIA POWER BANK MARKET BY CAPACITY (USD BILLION) 2020-2029
TABLE 242 SAUDI ARABIA POWER BANK MARKET BY CAPACITY (THOUSAND UNITS) 2020-2029
TABLE 243 SAUDI ARABIA POWER BANK MARKET BY APPLICATION (USD BILLION) 2020-2029
TABLE 244 SAUDI ARABIA POWER BANK MARKET BY APPLICATION (THOUSAND UNITS) 2020-2029
TABLE 245 SOUTH AFRICA POWER BANK MARKET BY BATTERY TYPE (USD BILLION) 2020-2029
TABLE 246 SOUTH AFRICA POWER BANK MARKET BY BATTERY TYPE (THOUSAND UNITS) 2020-2029
TABLE 247 SOUTH AFRICA POWER BANK MARKET BY INDICATOR (USD BILLION) 2020-2029
TABLE 248 SOUTH AFRICA POWER BANK MARKET BY INDICATOR (THOUSAND UNITS) 2020-2029
TABLE 249 SOUTH AFRICA POWER BANK MARKET BY CAPACITY (USD BILLION) 2020-2029
TABLE 250 SOUTH AFRICA POWER BANK MARKET BY CAPACITY (THOUSAND UNITS) 2020-2029
TABLE 251 SOUTH AFRICA POWER BANK MARKET BY APPLICATION (USD BILLION) 2020-2029
TABLE 252 SOUTH AFRICA POWER BANK MARKET BY APPLICATION (THOUSAND UNITS) 2020-2029
TABLE 253 REST OF THE MIDDLE EAST AND AFRICA POWER BANK MARKET BY BATTERY TYPE (USD BILLION) 2020-2029
TABLE 254 REST OF THE MIDDLE EAST AND AFRICA POWER BANK MARKET BY BATTERY TYPE (THOUSAND UNITS) 2020-2029
TABLE 255 REST OF THE MIDDLE EAST AND AFRICA POWER BANK MARKET BY INDICATOR (USD BILLION) 2020-2029
TABLE 256 REST OF THE MIDDLE EAST AND AFRICA POWER BANK MARKET BY INDICATOR (THOUSAND UNITS) 2020-2029
TABLE 257 REST OF THE MIDDLE EAST AND AFRICA POWER BANK MARKET BY CAPACITY (USD BILLION) 2020-2029
TABLE 258 REST OF THE MIDDLE EAST AND AFRICA POWER BANK MARKET BY CAPACITY (THOUSAND UNITS) 2020-2029
TABLE 259 REST OF THE MIDDLE EAST AND AFRICA POWER BANK MARKET BY APPLICATION (USD BILLION) 2020-2029
TABLE 260 REST OF THE MIDDLE EAST AND AFRICA POWER BANK MARKET BY APPLICATION (THOUSAND UNITS) 2020-2029
LIST OF FIGURES
FIGURE 1 MARKET DYNAMICS
FIGURE 2 MARKET SEGMENTATION
FIGURE 3 REPORT TIMELINES: YEARS CONSIDERED
FIGURE 4 DATA TRIANGULATION
FIGURE 5 BOTTOM-UP APPROACH
FIGURE 6 TOP-DOWN APPROACH
FIGURE 7 RESEARCH FLOW
FIGURE 8 GLOBAL POWER BANK MARKET BY BATTERY TYPE, USD BILLION, 2020-2029
FIGURE 9 GLOBAL POWER BANK MARKET BY INDICATOR, USD BILLION, 2020-2029
FIGURE 10 GLOBAL POWER BANK MARKET BY CAPACITY, USD BILLION, 2020-2029
FIGURE 11 GLOBAL POWER BANK MARKET BY APPLICATION, USD BILLION, 2020-2029
FIGURE 12 GLOBAL POWER BANK MARKET BY REGION, USD BILLION, 2020-2029
FIGURE 13 PORTER’S FIVE FORCES MODEL
FIGURE 14 GLOBAL POWER BANK MARKET BY BATTERY TYPE, USD BILLION, 2021
FIGURE 15 GLOBAL POWER BANK MARKET BY INDICATOR, USD BILLION, 2021
FIGURE 16 GLOBAL POWER BANK MARKET BY CAPACITY, USD BILLION, 2021
FIGURE 17 GLOBAL POWER BANK MARKET BY APPLICATION, USD BILLION, 2021
FIGURE 18 GLOBAL POWER BANK MARKET BY REGION, USD BILLION 2021
FIGURE 19 MARKET SHARE ANALYSIS
FIGURE 20 ANKER INNOVATIONS: COMPANY SNAPSHOT
FIGURE 21 AUKEY: COMPANY SNAPSHOT
FIGURE 22 XIAOMI: COMPANY SNAPSHOT
FIGURE 23 ADATA: COMPANY SNAPSHOT
FIGURE 24 RAVPOWER: COMPANY SNAPSHOT
FIGURE 25 GRIFFIN: COMPANY SNAPSHOT
FIGURE 26 LENOVO: COMPANY SNAPSHOT
FIGURE 27 MOPHIE: COMPANY SNAPSHOT
FIGURE 28 AMBRANE: COMPANY SNAPSHOT
FIGURE 29 NTEX: COMPANY SNAPSHOT
DOWNLOAD FREE SAMPLE REPORT
License Type
SPEAK WITH OUR ANALYST
Want to know more about the report or any specific requirement?
WANT TO CUSTOMIZE THE REPORT?
Our Clients Speak
We asked them to research ‘ Equipment market’ all over the world, and their whole arrangement was helpful to us. thehealthanalytics.com insightful analysis and reports contributed to our current analysis and in creating a future strategy. Besides, the te
Yosuke Mitsui
Senior Associate Construction Equipment Sales & Marketing
We asked them to research ‘Equipment market’ all over the world, and their whole arrangement was helpful to us. thehealthanalytics.com insightful analysis and reports contributed to our current analysis and in creating a future strategy. Besides, the te


