

Base Year Value ()
x.x %
x.x %
CAGR ()
x.x %
x.x %
Forecast Year Value ()
x.x %
x.x %
Historical Data Period
Largest Region
Forecast Period
유형(세척기, 건조기, 코터, 분리기, 연마기, 기타), 작물(시리얼 및 곡물, 유지종자 및 콩과식물, 과일 및 채소, 기타) 및 지역별 공정 장비 시장, 2022년부터 2029년까지의 글로벌 추세 및 예측.
Instant access to hundreds of data points and trends
- Market estimates from 2014-2029
- Competitive analysis, industry segmentation, financial benchmarks
- Incorporates SWOT, Porter's Five Forces and risk management frameworks
- PDF report or online database with Word, Excel and PowerPoint export options
- 100% money back guarantee
공정 장비 시장 개요
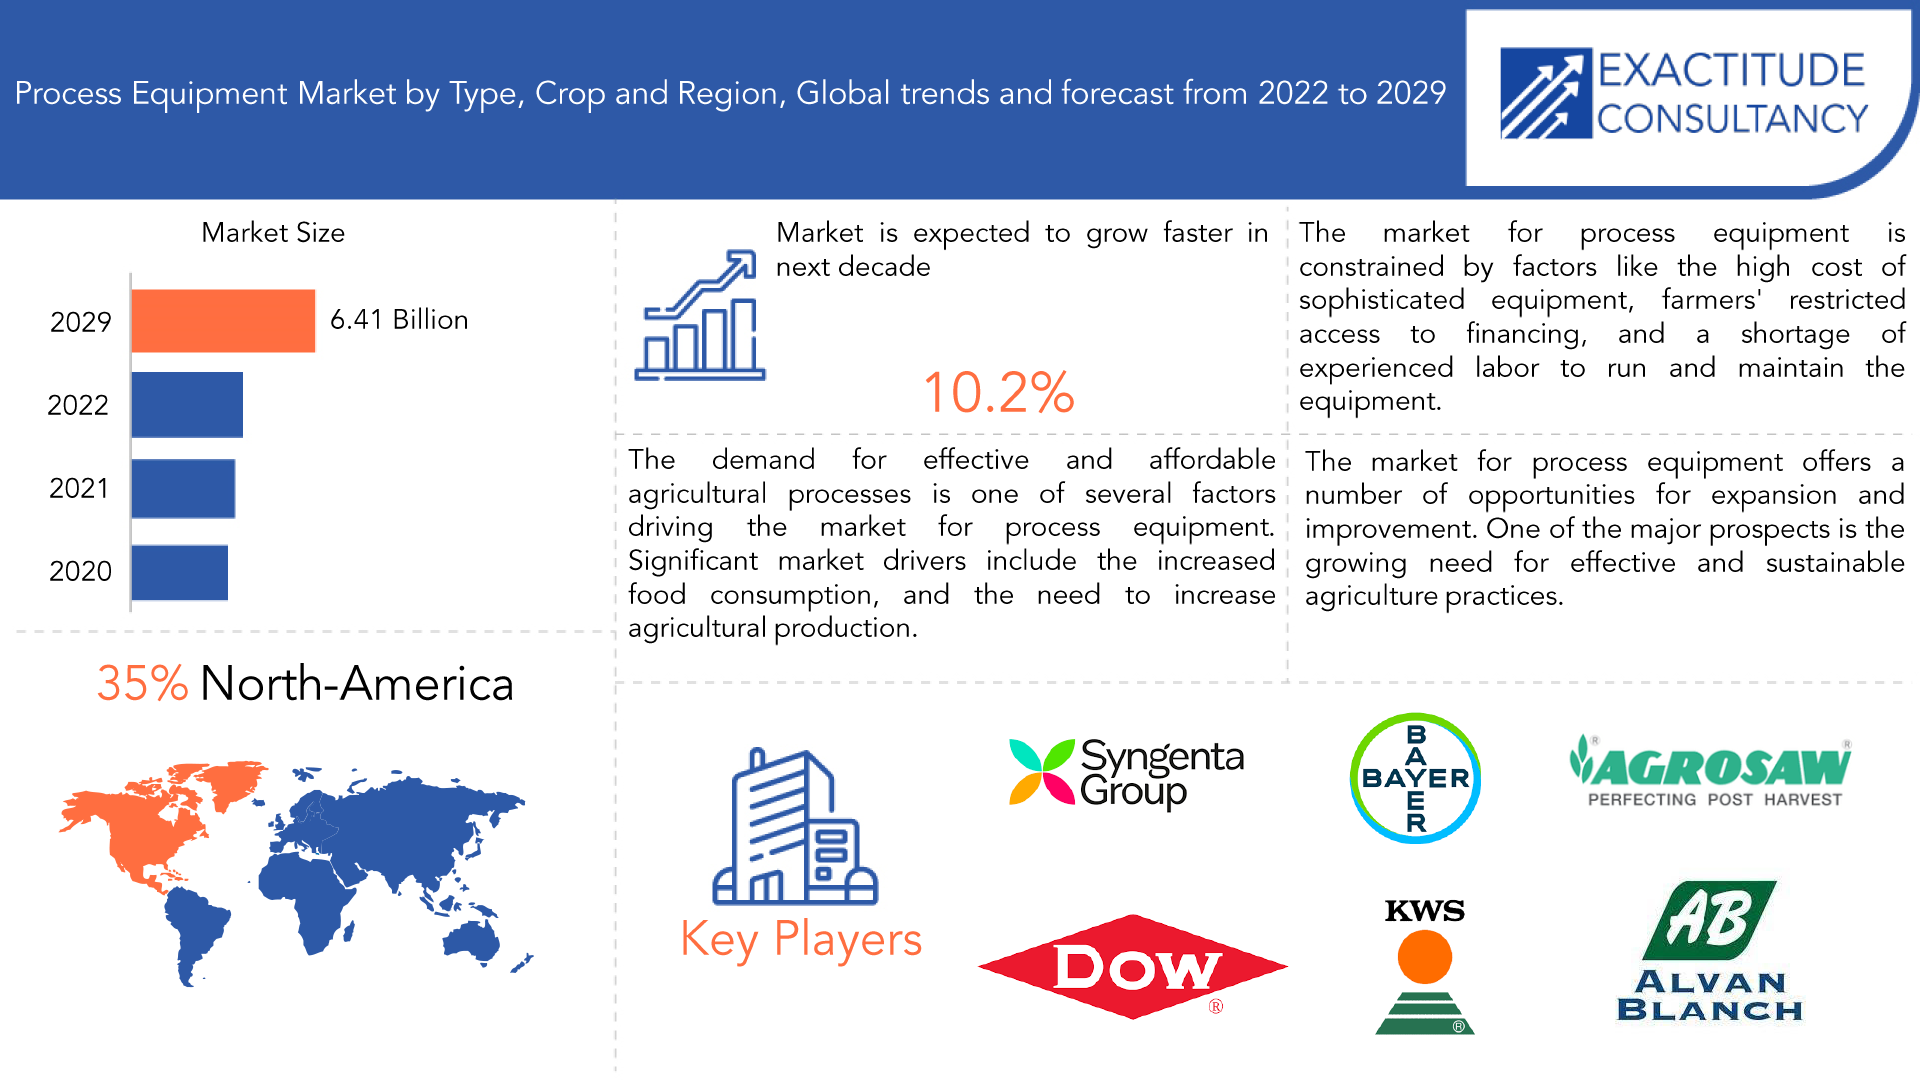
공정 장비 시장은 2022년부터 2029년까지 10.2%의 CAGR로 성장할 것으로 예상됩니다 . 2020년 26억 8 천만 달러에서 2029년까지 64억 1천만 달러 이상으로 성장할 것으로 예상됩니다 .
"공정 장비"라는 용어는 시멘트, 설탕, 제약, 섬유, 철강, 식품, 화학, 석유화학, 종이, 에너지 등의 가공 부문에서 사용되는 기계를 말합니다. 열교환 기, 저장 탱크, 밸브, 압력 방출 장치, 보일러, 파이프라인, 용광로 및 파이프는 이 장비의 몇 가지 예입니다. 이러한 기계는 각각 공정 실행에 필수적인 기능 때문에 중요합니다. 기계는 고정되어 있거나 움직일 수 있습니다. 품질과 신뢰성 향상, 공정의 에너지 효율성 증가, 배출 및 기타 환경 영향 감소, 안전 향상 및 공장 및 공정의 유연성 증가와 같은 사항을 고려하여 생산 또는 제작됩니다.
공정 장비 시장은 산업 공정에 사용되는 기계를 개발, 생산, 판매하는 경제 부문입니다. 이러한 도구, 기계 및 계측기는 화학, 제약, 식품 및 음료 , 석유 및 가스 , 수처리 산업 등에서 활용될 수 있습니다.
다양한 산업에서 자동화와 효과적인 생산 방법에 대한 필요성이 커지면서 프로세스 장비 시장이 성장하고 있습니다. 보일러, 압축기, 펌프, 밸브, 터빈을 포함한 많은 기계가 시장에 나와 있습니다.
| 기인하다 | 세부 |
| 학습 기간 | 2020-2029 |
| 기준년도 | 2021 |
| 추정 연도 | 2022 |
| 예상 연도 | 2022-2029 |
| 역사적 기간 | 2018-2020 |
| 단위 | 가치(10억 달러), 가치(천 단위) |
| 분할 | 유형별, 작물별, 지역별 |
| 유형별로 |
|
| 작물별로 |
|
| 지역별로 |
|
The demand for effective and affordable agricultural processes is one of several factors driving the market for process equipment. Significant market drivers include the expanding population, increased food consumption, and the need to increase agricultural production. The industry is further stimulated by the implementation of cutting-edge technologies like automation, smart farming, and precision agriculture, which raise productivity and lower labor costs. Government programs and subsidies to encourage modernization and the deployment of cutting-edge machinery in agriculture are another market-driving factor. The market is also fueled by the rising demand for environmentally friendly agricultural methods that call for equipment that has a minimal negative impact on the environment.
The industry is also being driven by the emergence of cutting-edge technologies like the Internet of Things (IoT), big data analytics, and artificial intelligence (AI). Real-time process monitoring and data-driven decision making are made possible by these technologies, which improves productivity and efficiency. Overall, it is anticipated that the market for process equipment will increase in the future as more and more sectors of industry embrace cutting-edge machinery and technologies to improve their processes and match the demands of contemporary production.
The market for process equipment is constrained by factors like the high cost of sophisticated equipment, farmers' restricted access to financing, and a shortage of experienced labor to run and maintain the equipment. The adoption of some equipment types may also be hampered by environmental and legal issues. It will be essential to address these constraints if the market is to expand and thrive, especially in developing nations and for small-scale producers.
The market for process equipment offers a number of opportunities for expansion and improvement. One of the major prospects is the growing need for effective and sustainable agriculture practices, which is being driven by the expanding global population and increasing food consumption. The industry is also given chances by the implementation of cutting-edge technologies like automation, smart farming, and precision agriculture. Government programs and subsidies to encourage modernization and the use of cutting-edge machinery in agriculture may also contribute to the market's expansion. Opportunities for the industry also arise from the advent of the Internet of Things (IoT), big data analytics, and artificial intelligence (AI) in agriculture. The process equipment market for agriculture is anticipated to grow and develop over the next few years as a result of all of these factors.
농업과 공급망의 일부 프로세스가 COVID-19로 인해 중단되고 있습니다. 운송 제약으로 인해 공급망이 중단되었고 여러 산업 시설이 일시적으로 문을 닫아야 했습니다. 언론에 따르면 숙박 시설, 식당, 제과점, 다방이 문을 닫으면서 우유 판매에 이미 영향을 미쳤습니다. 인도의 경제적 영향은 두 가지 이유로 상당히 더 심각할 가능성이 큽니다. 경제는 COVID-19 이전에도 이미 침체되어 실업, 저소득, 농촌 고통, 기아, 심각한 불평등과 같은 기존 문제가 악화되었습니다. 둘째, 규모가 큰 비조직 부문이 특히 취약합니다.
[캡션 id="attachment_20513" 정렬="정렬센터" 너비="1920"]
Frequently Asked Questions
• What is the total market value of Global process equipment market?
The global process equipment market size was valued at 2.68 Billion in 2020.
• Who are the key players in the process equipment market?
The process equipment market key players include Syngenta, Bayer, KWS Group, The Dow Chemical Company, Agrosaw, Alvan Blanch Development Company, GroupCimbria, Lewis M. Carter Manufacturing, Spectrum Industries, Westrup.
• Which is the largest regional market for process equipment?
North America is the largest regional market for process equipment.
• What is the growth rate of process equipment market?
The process equipment market is growing at a CAGR of 10.2% over the next 5 years.
Process Equipment Market Segment Analysis
The process equipment market is segmented based on coating type, application and region. Based on type market is segmented into cleaners, dryers, coaters, separators, polishers, others; by crop market is segmented into cereals & grains, oilseeds & pulses, fruits & vegetables and others.
Due of the numerous advantages that seed coatings provide, including high yield and protective properties, the coaters market will experience rapid expansion. Coated seeds have a thin layer of nutrients and chemicals that aid in crop growth and protect seeds from insects. Seed coating aids in shielding seeds from bacteria, fungus, and other microorganisms.
The majority of all crop kinds are of the grains and cereals variety, and this tendency is anticipated to last from 2021 through 2026. The market is benefiting from the rising consumption of grains and cereals such wheat, maize, corn, rice, and barley. The type of oilseeds and pulses will grow rapidly on the international market. The expansion of this market is being aided by the rising output of cooking oil seeds like groundnut, sunflower, and palm seeds globally. Further boosting market growths are the emerging countries' booming food industries and the expansion of the cooking oil sector.
[caption id="attachment_20524" align="aligncenter" width="1920"]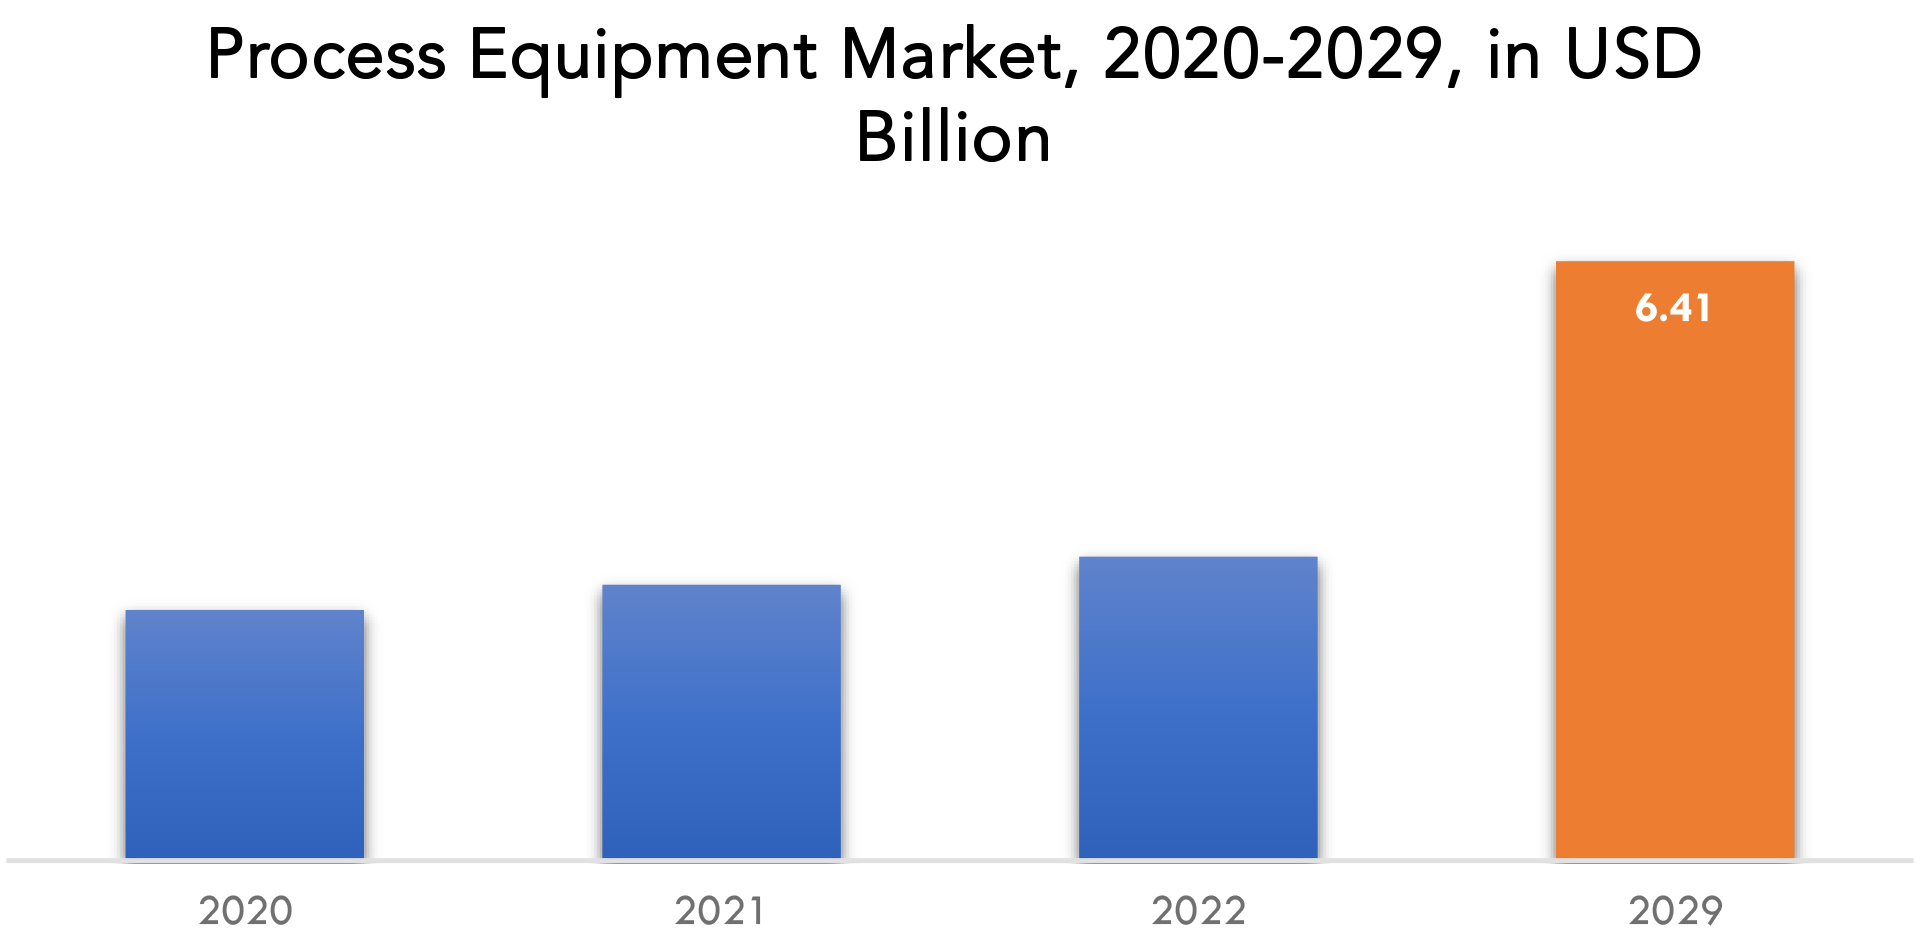
Process Equipment Market Key Players
The process equipment market key players include Syngenta, Bayer, KWS Group, The Dow Chemical Company, Agrosaw, Alvan Blanch Development Company, GroupCimbria, Lewis M. Carter Manufacturing, Spectrum Industries, Westrup, and others.- 06 March 2023: Dow announced the introduction of FINGERPRINT DFDA-7555 NT Bimodal Polyethylene Resin, an evolution of its legacy FINGERPRINT Polyethylene Resins.
- 25 January 2023: Dow and LVMH Beauty, a division of LVMH, the world leader in luxury and home to 75 iconic brands, collaborated to accelerate the use of sustainable packaging across LVMH’s perfume and cosmetic products.
Who Should Buy? Or Key stakeholders
- Agriculture Industry
- Seed Industry
- Government Organizations
- Investors
- Research and development
- Regulatory Authorities
- End-users Companies
- Others
Process Equipment Market Regional Analysis
The process equipment market by region includes North America, Asia-Pacific (APAC), Europe, South America, and Middle East & Africa (MEA).
- North America: includes the US, Canada, Mexico, Rest of North America
- Asia Pacific: includes China, Japan, South Korea, India, Australia, and Rest of APAC
- Europe: includes UK, Germany, France, Italy, Spain, and Rest of Europe
- South America: includes Brazil, Argentina, and Rest of South America
- Middle East & Africa: includes UAE, South Africa, and Rest of MEA
From 2022 to 2029, the North American region is expected to develop significantly, continuing its dominance of the global market. According to estimates, the market in the region with the quickest growth is the United States. The high usage of processed seeds, technological advancements in agriculture, and a growth in the use of genetically modified crops are the key drivers of the processing equipment market in the nation. The market for process equipment for the seed business has advanced significantly thanks to multinational corporations operating in the United States and the constantly developing technologies in the agricultural and food systems.
The Asia-Pacific area is expected to increase at a rapid pace between 2022 and 2029. According to forecasts, China will have the fastest growth in the local economy. According to estimates, China is the region's top producer and consumer of processed seeds and processing machinery. Growing agricultural exports is largely due to increased fruit and vegetable production. The demand for commercial seed and seed processing equipment is rising in China, but the market's expansion is seriously hampered by the high cost of processed seeds.
[caption id="attachment_20527" align="aligncenter" width="1920"]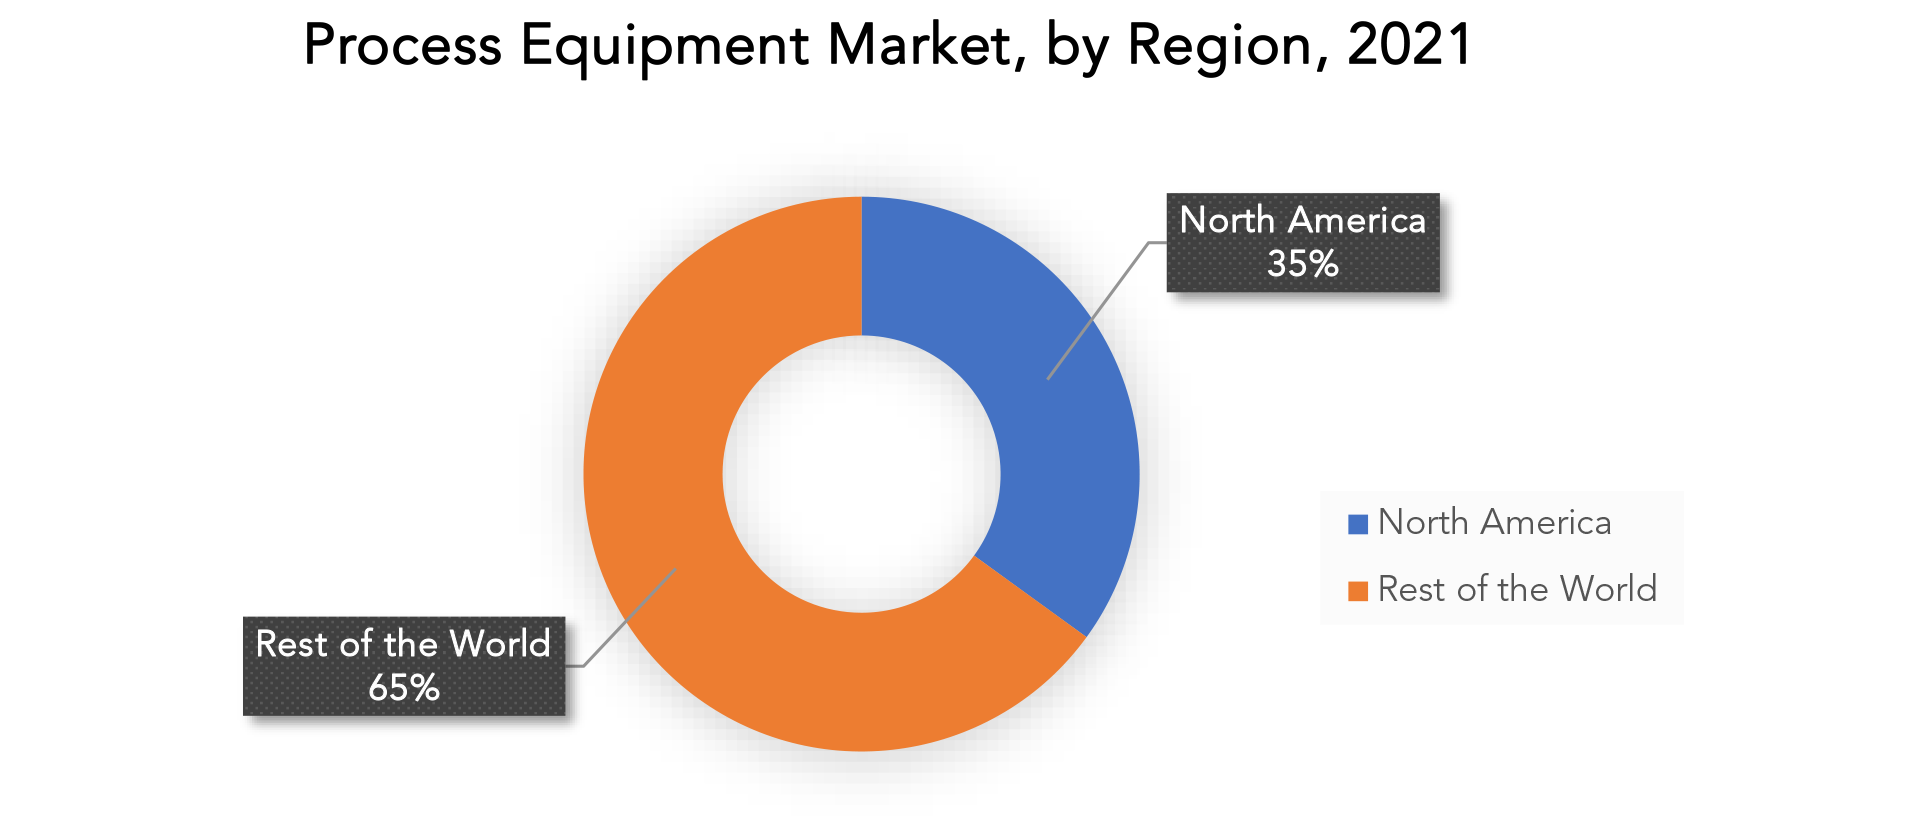
Key Market Segments: Process equipment market
Process Equipment Market By Type, 2020-2029, (USD Billion, Thousand Units)- Cleaners
- Dryers
- Coaters
- Separators
- Polishers
- Others
- Cereals And Grains
- Oilseeds And Pulses
- Fruits And Vegetables
- Others
- North America
- Asia Pacific
- Europe
- South America
- Middle East And Africa
Exactitude Consultancy Services Key Objectives
- Increasing sales and market share
- Developing new technology
- Improving profitability
- Entering new markets
- Enhancing brand reputation
Key Question Answered
- What is the expected growth rate of the process equipment market over the next 7 years?
- Who are the major players in the process equipment market and what is their market share?
- What are the end-user industries driving demand for market and what is their outlook?
- What are the opportunities for growth in emerging markets such as Asia-pacific, Middle East, and Africa?
- How is the economic environment affecting the process equipment market, including factors such as interest rates, inflation, and exchange rates?
- What is the expected impact of government policies and regulations on the process equipment market?
- What is the current and forecasted size and growth rate of the global process equipment market?
- What are the key drivers of growth in the process equipment market?
- Who are the major players in the market and what is their market share?
- What are the distribution channels and supply chain dynamics in the process equipment market?
- What are the technological advancements and innovations in the process equipment market and their impact on product development and growth?
- What are the regulatory considerations and their impact on the market?
- What are the challenges faced by players in the process equipment market and how are they addressing these challenges?
- What are the opportunities for growth and expansion in the process equipment market?
- What are the service offerings and specifications of leading players in the market?
- 소개
- 시장 정의
- 시장 세분화
- 연구 일정
- 가정 및 제한
- 연구 방법론
- 데이터 마이닝
- 2차 연구
- 1차 연구
- 주제별 전문가의 조언
- 품질 검사
- 최종 검토
- 데이터 삼각 측량
- 바텀업 방식
- 탑다운 접근 방식
- 연구 흐름
- 데이터 소스
- 데이터 마이닝
- 요약
- 시장 개요
- 글로벌 프로세스 장비 시장 전망
- 시장 동인
- 시장 제약
- 시장 기회
- COVID-19가 공정 장비 시장에 미치는 영향
- 포터의 5가지 힘 모델
- 신규 진입자의 위협
- 대체품으로부터의 위협
- 공급업체의 협상력
- 고객의 협상력
- 경쟁의 정도
- 산업 가치 사슬 분석
- 글로벌 프로세스 장비 시장 전망
- 유형별 글로벌 프로세스 장비 시장(USD 십억, 천대), 2020-2029
- 청소부
- 건조기
- 코터
- 구분 기호
- 광택제
- 기타
- 작물별 글로벌 공정 장비 시장(USD 십억, 천대), 2020-2029
- 시리얼 & 곡물
- 유지종자 및 콩류
- 과일 및 야채
- 기타
- 지역별 글로벌 프로세스 장비 시장(USD 십억, 천대), 2020-2029
- 북아메리카
- 우리를
- 캐나다
- 멕시코
- 북미의 나머지 지역
- 남아메리카
- 브라질
- 아르헨티나
- 남미의 나머지 지역
- 유럽
- 독일
- 영국
- 프랑스
- 이탈리아
- 스페인
- 유럽의 나머지 지역
- 아시아 태평양
- 인도
- 중국
- 일본
- 대한민국
- 호주
- 아시아 태평양의 나머지 지역
- 중동 및 아프리카
- 아랍에미리트
- 남아프리카 공화국
- 중동 및 아프리카의 나머지 지역
- 북아메리카
- 회사 프로필* (사업 개요, 회사 스냅샷, 제공 제품, 최근 개발)
- 신젠타
- 바이엘
- KWS그룹
- 다우 케미컬 컴퍼니
- 농기계
- 알반 블랜치 개발 회사
- 그룹심브리아
- 루이스 M. 카터 제조
- 스펙트럼 인더스트리
- WESTRUP *회사 목록은 표시용입니다.
표 목록
TABLE 1 GLOBAL PROCESS EQUIPMENT MARKET BY TYPE (USD BILLION), 2020-2029
TABLE 2 GLOBAL PROCESS EQUIPMENT MARKET BY TYPE (THOUSAND UNITS), 2020-2029
TABLE 3 GLOBAL PROCESS EQUIPMENT MARKET BY CROP (USD BILLION), 2020-2029
TABLE 4 GLOBAL PROCESS EQUIPMENT MARKET BY CROP (THOUSAND UNITS), 2020-2029
TABLE 5 GLOBAL PROCESS EQUIPMENT MARKET BY REGION (USD BILLION), 2020-2029
TABLE 6 GLOBAL PROCESS EQUIPMENT MARKET BY REGION (THOUSAND UNITS), 2020-2029
TABLE 7 NORTH AMERICA PROCESS EQUIPMENT MARKET BY TYPE (USD BILLION), 2020-2029
TABLE 8 NORTH AMERICA PROCESS EQUIPMENT MARKET BY TYPE (THOUSAND UNITS), 2020-2029
TABLE 9 NORTH AMERICA PROCESS EQUIPMENT MARKET BY CROP (USD BILLION), 2020-2029
TABLE 10 NORTH AMERICA PROCESS EQUIPMENT MARKET BY CROP (THOUSAND UNITS), 2020-2029
TABLE 11 NORTH AMERICA PROCESS EQUIPMENT MARKET BY COUNTRY (USD BILLION), 2020-2029
TABLE 12 NORTH AMERICA PROCESS EQUIPMENT MARKET BY COUNTRY (THOUSAND UNITS), 2020-2029
TABLE 13 US PROCESS EQUIPMENT MARKET BY TYPE (USD BILLION), 2020-2029
TABLE 14 US PROCESS EQUIPMENT MARKET BY TYPE (THOUSAND UNITS), 2020-2029
TABLE 15 US PROCESS EQUIPMENT MARKET BY CROP (USD BILLION), 2020-2029
TABLE 16 US PROCESS EQUIPMENT MARKET BY CROP (THOUSAND UNITS), 2020-2029
TABLE 17 CANADA PROCESS EQUIPMENT MARKET BY TYPE (BILLION), 2020-2029
TABLE 18 CANADA PROCESS EQUIPMENT MARKET BY TYPE (THOUSAND UNITS), 2020-2029
TABLE 19 CANADA PROCESS EQUIPMENT MARKET BY CROP (USD BILLION), 2020-2029
TABLE 20 CANADA PROCESS EQUIPMENT MARKET BY CROP (THOUSAND UNITS), 2020-2029
TABLE 21 MEXICO PROCESS EQUIPMENT MARKET BY TYPE (USD BILLION), 2020-2029
TABLE 22 MEXICO PROCESS EQUIPMENT MARKET BY TYPE (THOUSAND UNITS), 2020-2029
TABLE 23 MEXICO PROCESS EQUIPMENT MARKET BY CROP (USD BILLION), 2020-2029
TABLE 24 MEXICO PROCESS EQUIPMENT MARKET BY CROP (THOUSAND UNITS), 2020-2029
TABLE 25 REST OF NORTH AMERICA PROCESS EQUIPMENT MARKET BY TYPE (USD BILLION), 2020-2029
TABLE 26 REST OF NORTH AMERICA PROCESS EQUIPMENT MARKET BY TYPE (THOUSAND UNITS), 2020-2029
TABLE 27 REST OF NORTH AMERICA PROCESS EQUIPMENT MARKET BY CROP (USD BILLION), 2020-2029
TABLE 28 REST OF NORTH AMERICA PROCESS EQUIPMENT MARKET BY CROP (THOUSAND UNITS), 2020-2029
TABLE 29 SOUTH AMERICA PROCESS EQUIPMENT MARKET BY TYPE (USD BILLION), 2020-2029
TABLE 30 SOUTH AMERICA PROCESS EQUIPMENT MARKET BY TYPE (THOUSAND UNITS), 2020-2029
TABLE 31 SOUTH AMERICA PROCESS EQUIPMENT MARKET BY CROP (USD BILLION), 2020-2029
TABLE 32 SOUTH AMERICA PROCESS EQUIPMENT MARKET BY CROP (THOUSAND UNITS), 2020-2029
TABLE 33 SOUTH AMERICA PROCESS EQUIPMENT MARKET BY COUNTRY (USD BILLION), 2020-2029
TABLE 34 SOUTH AMERICA PROCESS EQUIPMENT MARKET BY COUNTRY (THOUSAND UNITS), 2020-2029
TABLE 35 BRAZIL PROCESS EQUIPMENT MARKET BY TYPE (USD BILLION), 2020-2029
TABLE 36 BRAZIL PROCESS EQUIPMENT MARKET BY TYPE (THOUSAND UNITS), 2020-2029
TABLE 37 BRAZIL PROCESS EQUIPMENT MARKET BY CROP (USD BILLION), 2020-2029
TABLE 38 BRAZIL PROCESS EQUIPMENT MARKET BY CROP (THOUSAND UNITS), 2020-2029
TABLE 39 ARGENTINA PROCESS EQUIPMENT MARKET BY TYPE (USD BILLION), 2020-2029
TABLE 40 ARGENTINA PROCESS EQUIPMENT MARKET BY TYPE (THOUSAND UNITS), 2020-2029
TABLE 41 ARGENTINA PROCESS EQUIPMENT MARKET BY CROP (USD BILLION), 2020-2029
TABLE 42 ARGENTINA PROCESS EQUIPMENT MARKET BY CROP (THOUSAND UNITS), 2020-2029
TABLE 43 COLOMBIA PROCESS EQUIPMENT MARKET BY TYPE (USD BILLION), 2020-2029
TABLE 44 COLOMBIA PROCESS EQUIPMENT MARKET BY TYPE (THOUSAND UNITS), 2020-2029
TABLE 45 COLOMBIA PROCESS EQUIPMENT MARKET BY CROP (USD BILLION), 2020-2029
TABLE 46 COLOMBIA PROCESS EQUIPMENT MARKET BY CROP (THOUSAND UNITS), 2020-2029
TABLE 47 REST OF SOUTH AMERICA PROCESS EQUIPMENT MARKET BY TYPE (USD BILLION), 2020-2029
TABLE 48 REST OF SOUTH AMERICA PROCESS EQUIPMENT MARKET BY TYPE (THOUSAND UNITS), 2020-2029
TABLE 49 REST OF SOUTH AMERICA PROCESS EQUIPMENT MARKET BY CROP (USD BILLION), 2020-2029
TABLE 50 REST OF SOUTH AMERICA PROCESS EQUIPMENT MARKET BY CROP (THOUSAND UNITS), 2020-2029
TABLE 51 ASIA -PACIFIC PROCESS EQUIPMENT MARKET BY TYPE (USD BILLION), 2020-2029
TABLE 52 ASIA -PACIFIC PROCESS EQUIPMENT MARKET BY TYPE (THOUSAND UNITS), 2020-2029
TABLE 53 ASIA -PACIFIC PROCESS EQUIPMENT MARKET BY CROP (USD BILLION), 2020-2029
TABLE 54 ASIA -PACIFIC PROCESS EQUIPMENT MARKET BY CROP (THOUSAND UNITS), 2020-2029
TABLE 55 ASIA -PACIFIC PROCESS EQUIPMENT MARKET BY COUNTRY (USD BILLION), 2020-2029
TABLE 56 ASIA -PACIFIC PROCESS EQUIPMENT MARKET BY COUNTRY (THOUSAND UNITS), 2020-2029
TABLE 57 INDIA PROCESS EQUIPMENT MARKET BY TYPE (USD BILLION), 2020-2029
TABLE 58 INDIA PROCESS EQUIPMENT MARKET BY TYPE (THOUSAND UNITS), 2020-2029
TABLE 59 INDIA PROCESS EQUIPMENT MARKET BY CROP (USD BILLION), 2020-2029
TABLE 60 INDIA PROCESS EQUIPMENT MARKET BY CROP (THOUSAND UNITS), 2020-2029
TABLE 61 CHINA PROCESS EQUIPMENT MARKET BY TYPE (USD BILLION), 2020-2029
TABLE 62 CHINA PROCESS EQUIPMENT MARKET BY TYPE (THOUSAND UNITS), 2020-2029
TABLE 63 CHINA PROCESS EQUIPMENT MARKET BY CROP (USD BILLION), 2020-2029
TABLE 64 CHINA PROCESS EQUIPMENT MARKET BY CROP (THOUSAND UNITS), 2020-2029
TABLE 65 JAPAN PROCESS EQUIPMENT MARKET BY TYPE (USD BILLION), 2020-2029
TABLE 66 JAPAN PROCESS EQUIPMENT MARKET BY TYPE (THOUSAND UNITS), 2020-2029
TABLE 67 JAPAN PROCESS EQUIPMENT MARKET BY CROP (USD BILLION), 2020-2029
TABLE 68 JAPAN PROCESS EQUIPMENT MARKET BY CROP (THOUSAND UNITS), 2020-2029
TABLE 69 SOUTH KOREA PROCESS EQUIPMENT MARKET BY TYPE (USD BILLION), 2020-2029
TABLE 70 SOUTH KOREA PROCESS EQUIPMENT MARKET BY TYPE (THOUSAND UNITS), 2020-2029
TABLE 71 SOUTH KOREA PROCESS EQUIPMENT MARKET BY CROP (USD BILLION), 2020-2029
TABLE 72 SOUTH KOREA PROCESS EQUIPMENT MARKET BY CROP (THOUSAND UNITS), 2020-2029
TABLE 73 AUSTRALIA PROCESS EQUIPMENT MARKET BY TYPE (USD BILLION), 2020-2029
TABLE 74 AUSTRALIA HYBRID APPLICATIONBY TYPES (THOUSAND UNITS), 2020-2029
TABLE 75 AUSTRALIA PROCESS EQUIPMENT MARKET BY CROP (USD BILLION), 2020-2029
TABLE 76 AUSTRALIA PROCESS EQUIPMENT MARKET BY CROP (THOUSAND UNITS), 2020-2029
TABLE 77 REST OF ASIA PACIFIC PROCESS EQUIPMENT MARKET BY TYPE (USD BILLION), 2020-2029
TABLE 78 REST OF ASIA PACIFIC HYBRID APPLICATIONBY TYPES (THOUSAND UNITS), 2020-2029
TABLE 79 REST OF ASIA PACIFIC PROCESS EQUIPMENT MARKET BY CROP (USD BILLION), 2020-2029
TABLE 80 REST OF ASIA PACIFIC PROCESS EQUIPMENT MARKET BY CROP (THOUSAND UNITS), 2020-2029
TABLE 81 EUROPE PROCESS EQUIPMENT MARKET BY TYPE (USD BILLION), 2020-2029
TABLE 82 EUROPE PROCESS EQUIPMENT MARKET BY TYPE (THOUSAND UNITS), 2020-2029
TABLE 83 EUROPE PROCESS EQUIPMENT MARKET BY CROP (USD BILLION), 2020-2029
TABLE 84 EUROPE PROCESS EQUIPMENT MARKET BY CROP (THOUSAND UNITS), 2020-2029
TABLE 85 EUROPE PROCESS EQUIPMENT MARKET BY COUNTRY (USD BILLION), 2020-2029
TABLE 86 EUROPE PROCESS EQUIPMENT MARKET BY COUNTRY (THOUSAND UNITS), 2020-2029
TABLE 87 GERMANY PROCESS EQUIPMENT MARKET BY TYPE (USD BILLION), 2020-2029
TABLE 88 GERMANY PROCESS EQUIPMENT MARKET BY TYPE (THOUSAND UNITS), 2020-2029
TABLE 89 GERMANY PROCESS EQUIPMENT MARKET BY CROP (USD BILLION), 2020-2029
TABLE 90 GERMANY PROCESS EQUIPMENT MARKET BY CROP (THOUSAND UNITS), 2020-2029
TABLE 91 UK PROCESS EQUIPMENT MARKET BY TYPE (USD BILLION), 2020-2029
TABLE 92 UK PROCESS EQUIPMENT MARKET BY TYPE (THOUSAND UNITS), 2020-2029
TABLE 93 UK PROCESS EQUIPMENT MARKET BY CROP (USD BILLION), 2020-2029
TABLE 94 UK PROCESS EQUIPMENT MARKET BY CROP (THOUSAND UNITS), 2020-2029
TABLE 95 FRANCE PROCESS EQUIPMENT MARKET BY TYPE (USD BILLION), 2020-2029
TABLE 96 FRANCE PROCESS EQUIPMENT MARKET BY TYPE (THOUSAND UNITS), 2020-2029
TABLE 97 FRANCE PROCESS EQUIPMENT MARKET BY CROP (USD BILLION), 2020-2029
TABLE 98 FRANCE PROCESS EQUIPMENT MARKET BY CROP (THOUSAND UNITS), 2020-2029
TABLE 99 ITALY PROCESS EQUIPMENT MARKET BY TYPE (USD BILLION), 2020-2029
TABLE 100 ITALY PROCESS EQUIPMENT MARKET BY TYPE (THOUSAND UNITS), 2020-2029
TABLE 101 ITALY PROCESS EQUIPMENT MARKET BY CROP (USD BILLION), 2020-2029
TABLE 102 ITALY PROCESS EQUIPMENT MARKET BY CROP (THOUSAND UNITS), 2020-2029
TABLE 103 SPAIN PROCESS EQUIPMENT MARKET BY TYPE (USD BILLION), 2020-2029
TABLE 104 SPAIN PROCESS EQUIPMENT MARKET BY TYPE (THOUSAND UNITS), 2020-2029
TABLE 105 SPAIN PROCESS EQUIPMENT MARKET BY CROP (USD BILLION), 2020-2029
TABLE 106 SPAIN PROCESS EQUIPMENT MARKET BY CROP (THOUSAND UNITS), 2020-2029
TABLE 107 RUSSIA PROCESS EQUIPMENT MARKET BY TYPE (USD BILLION), 2020-2029
TABLE 108 RUSSIA PROCESS EQUIPMENT MARKET BY TYPE (THOUSAND UNITS), 2020-2029
TABLE 109 RUSSIA PROCESS EQUIPMENT MARKET BY CROP (USD BILLION), 2020-2029
TABLE 110 RUSSIA PROCESS EQUIPMENT MARKET BY CROP (THOUSAND UNITS), 2020-2029
TABLE 111 REST OF EUROPE PROCESS EQUIPMENT MARKET BY TYPE (USD BILLION), 2020-2029
TABLE 112 REST OF EUROPE PROCESS EQUIPMENT MARKET BY TYPE (THOUSAND UNITS), 2020-2029
TABLE 113 REST OF EUROPE PROCESS EQUIPMENT MARKET BY CROP (USD BILLION), 2020-2029
TABLE 114 REST OF EUROPE PROCESS EQUIPMENT MARKET BY CROP (THOUSAND UNITS), 2020-2029
TABLE 115 MIDDLE EAST AND AFRICA PROCESS EQUIPMENT MARKET BY TYPE (USD BILLION), 2020-2029
TABLE 116 MIDDLE EAST AND AFRICA PROCESS EQUIPMENT MARKET BY TYPE (THOUSAND UNITS), 2020-2029
TABLE 117 MIDDLE EAST AND AFRICA PROCESS EQUIPMENT MARKET BY CROP (USD BILLION), 2020-2029
TABLE 118 MIDDLE EAST AND AFRICA PROCESS EQUIPMENT MARKET BY CROP (THOUSAND UNITS), 2020-2029
TABLE 119 MIDDLE EAST ABD AFRICA PROCESS EQUIPMENT MARKET BY COUNTRY (USD BILLION), 2020-2029
TABLE 120 MIDDLE EAST ABD AFRICA PROCESS EQUIPMENT MARKET BY COUNTRY (THOUSAND UNITS), 2020-2029
TABLE 121 UAE PROCESS EQUIPMENT MARKET BY TYPE (USD BILLION), 2020-2029
TABLE 122 UAE PROCESS EQUIPMENT MARKET BY TYPE (THOUSAND UNITS), 2020-2029
TABLE 123 UAE PROCESS EQUIPMENT MARKET BY CROP (USD BILLION), 2020-2029
TABLE 124 UAE PROCESS EQUIPMENT MARKET BY CROP (THOUSAND UNITS), 2020-2029
TABLE 125 SAUDI ARABIA PROCESS EQUIPMENT MARKET BY TYPE (USD BILLION), 2020-2029
TABLE 126 SAUDI ARABIA PROCESS EQUIPMENT MARKET BY TYPE (THOUSAND UNITS), 2020-2029
TABLE 127 SAUDI ARABIA PROCESS EQUIPMENT MARKET BY CROP (USD BILLION), 2020-2029
TABLE 128 SAUDI ARABIA PROCESS EQUIPMENT MARKET BY CROP (THOUSAND UNITS), 2020-2029
TABLE 129 SOUTH AFRICA PROCESS EQUIPMENT MARKET BY TYPE (USD BILLION), 2020-2029
TABLE 130 SOUTH AFRICA PROCESS EQUIPMENT MARKET BY TYPE (THOUSAND UNITS), 2020-2029
TABLE 131 SOUTH AFRICA PROCESS EQUIPMENT MARKET BY CROP (USD BILLION), 2020-2029
TABLE 132 SOUTH AFRICA PROCESS EQUIPMENT MARKET BY CROP (THOUSAND UNITS), 2020-2029
TABLE 133 REST OF MIDDLE EAST AND AFRICA PROCESS EQUIPMENT MARKET BY TYPE (USD BILLION), 2020-2029
TABLE 134 REST OF MIDDLE EAST AND AFRICA PROCESS EQUIPMENT MARKET BY TYPE (THOUSAND UNITS), 2020-2029
TABLE 135 REST OF MIDDLE EAST AND AFRICA PROCESS EQUIPMENT MARKET BY CROP (USD BILLION), 2020-2029
TABLE 136 REST OF MIDDLE EAST AND AFRICA PROCESS EQUIPMENT MARKET BY CROP (THOUSAND UNITS), 2020-2029
LIST OF FIGURES
FIGURE 1 MARKET DYNAMICS
FIGURE 2 MARKET SEGMENTATION
FIGURE 3 REPORT TIMELINES: YEARS CONSIDERED
FIGURE 4 DATA TRIANGULATION
FIGURE 5 BOTTOM-UP APPROACH
FIGURE 6 TOP-DOWN APPROACH
FIGURE 7 RESEARCH FLOW
FIGURE 8 GLOBAL PROCESS EQUIPMENT MARKET BY TYPE, USD BILLION, 2020-2029
FIGURE 9 GLOBAL PROCESS EQUIPMENT MARKET BY CROP, USD BILLION, 2020-2029
FIGURE 10 GLOBAL PROCESS EQUIPMENT MARKET BY REGION, USD BILLION, 2020-2029
FIGURE 11 PORTER’S FIVE FORCES MODEL
FIGURE 12 GLOBAL PROCESS EQUIPMENT MARKET BY TYPE, USD BILLION, 2021
FIGURE 13 GLOBAL PROCESS EQUIPMENT MARKET BY CROP, USD BILLION, 2021
FIGURE 14 GLOBAL PROCESS EQUIPMENT MARKET BY REGION, USD BILLION, 2021
FIGURE 15 MARKET SHARE ANALYSIS
FIGURE 16 SYNGENTA: COMPANY SNAPSHOT
FIGURE 17 BAYER: COMPANY SNAPSHOT
FIGURE 18 KWS GROUP: COMPANY SNAPSHOT
FIGURE 19 THE DOW CHEMICAL COMPANY: COMPANY SNAPSHOT
FIGURE 20 AGROSAW: COMPANY SNAPSHOT
FIGURE 21 ALVAN BLANCH DEVELOPMENT COMPANY: COMPANY SNAPSHOT
FIGURE 22 GROUPCIMBRIA: COMPANY SNAPSHOT
FIGURE 23 LEWIS M. CARTER MANUFACTURING: COMPANY SNAPSHOT
FIGURE 24 SPECTRUM INDUSTRIES: COMPANY SNAPSHOT
FIGURE 25 WESTRUP: COMPANY SNAPSHOT
DOWNLOAD FREE SAMPLE REPORT
License Type
SPEAK WITH OUR ANALYST
Want to know more about the report or any specific requirement?
WANT TO CUSTOMIZE THE REPORT?
Our Clients Speak
We asked them to research ‘ Equipment market’ all over the world, and their whole arrangement was helpful to us. thehealthanalytics.com insightful analysis and reports contributed to our current analysis and in creating a future strategy. Besides, the te
Yosuke Mitsui
Senior Associate Construction Equipment Sales & Marketing
We asked them to research ‘Equipment market’ all over the world, and their whole arrangement was helpful to us. thehealthanalytics.com insightful analysis and reports contributed to our current analysis and in creating a future strategy. Besides, the te


