

Base Year Value ()
x.x %
x.x %
CAGR ()
x.x %
x.x %
Forecast Year Value ()
x.x %
x.x %
Historical Data Period
Largest Region
Forecast Period
작물 유형(시리얼 및 곡물, 유지종자 및 콩류, 과일 및 채소), 제형 유형(수성 현탁액, 액체, 현탁액 농축액, 가용성(액체) 농축액), 응용 분야(비농업, 농업, 제약, 유지종자 및 콩류) 및 지역별(북미, 유럽, 아시아 태평양, 남미, 중동 및 아프리카) 글루포시네이트 시장 2022년부터 2029년까지의 글로벌 트렌드 및 예측
Instant access to hundreds of data points and trends
- Market estimates from 2014-2029
- Competitive analysis, industry segmentation, financial benchmarks
- Incorporates SWOT, Porter's Five Forces and risk management frameworks
- PDF report or online database with Word, Excel and PowerPoint export options
- 100% money back guarantee
글루포시네이트 시장 개요:
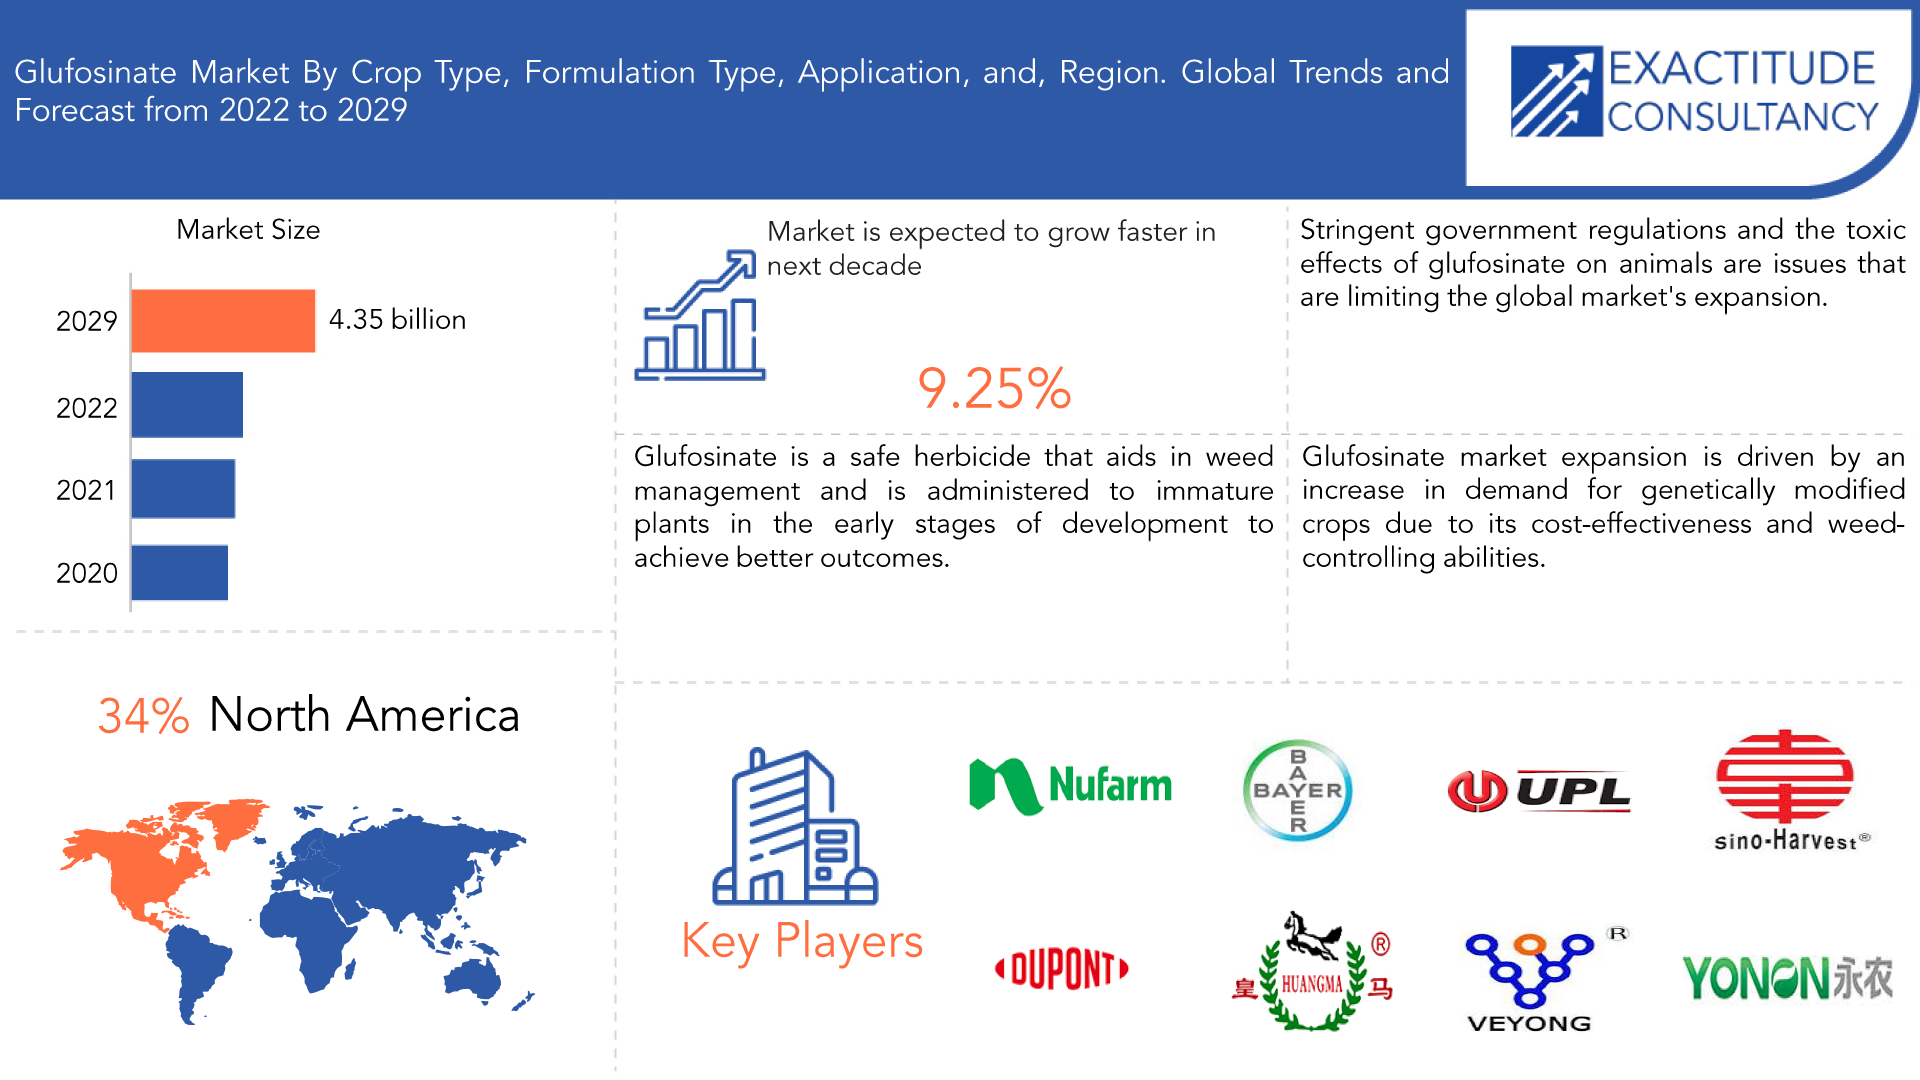
글로벌 글루포시네이트 시장 규모는 2022년에 23억 4천만 달러에 달했으며, 2029년까지 43억 5천만 달러에 도달할 것으로 예상되어 2022년부터 2029년까지 연평균 성장률 9.25%를 기록할 것으로 예상됩니다.
자연적으로 발생하는 광범위 제초제인 글루포시네이트 (암모늄염이라고도 함)는 다양한 유형의 토양 박테리아인 스트렙토마이세스를 활용하여 만들어졌습니다. 다양한 작물에 대한 독창적이고 실용적이며 효율적인 잡초 관리 방법으로 사용됩니다. 최대 효율을 위해 개발 초기 단계에 있는 어린 식물에 살포합니다. 연구자들은 현재 수확량을 크게 늘리고 중요한 농업 적 이점을 제공하는 새로운 글루포시네이트 내성 작물을 만드는 데 집중하고 있습니다. 글루포시네이트는 잡초 관리에 도움이 되는 안전한 제초제이며 더 나은 결과를 얻기 위해 개발 초기 단계에 있는 미성숙 식물에 투여됩니다. 또한 글루포시네이트의 시장 성장 곡선은 원예에 대한 과도한 수요에 의해 계속 형성될 것입니다. 매우 효과적인 제초제인 글루포시네이트는 전 세계 100개 이상의 작물을 질병과 다양한 잡초로 처리하는 데 사용됩니다. 농부들은 글루포시네이트 제초제에 의존하는데, 이 제초제는 처리된 식물 부분에만 영향을 미쳐 더 큰 보호 효과를 제공하기 때문입니다.
| 기인하다 | 세부 |
| 학습 기간 | 2022-2029 |
| 기준년도 | 2021 |
| 추정 연도 | 2022 |
| 예상 연도 | 2022-2029 |
| 역사적 기간 | 2018-2020 |
| 단위 | 가치(10억 달러), 양(천 리터) |
| 분할 | 작물 유형, 제형 유형, 적용 분야 및 지역별. |
| 작물 유형별 |
|
| 제형 유형별 |
|
| BY 응용 프로그램 |
|
| 지역별로 |
|
글로벌 글루포시네이트 시장 확장은 비용 효율성과 잡초 방제 능력으로 인해 유전자 변형 작물에 대한 수요 증가에 의해 주도됩니다. 배부르게 하는 제초제의 역할은 글로벌 시장 확장을 촉진합니다. 엄격한 정부 규제와 동물에 대한 글루포시네이트의 독성 효과는 글로벌 시장 확장을 제한하는 문제입니다. 글루포시네이트 제초제 내성 유전자 조작 작물에 대한 수용 및 승인 추세 와 함께 상당한 시장 확장.
[캡션 id="attachment_21049" 정렬="정렬없음" 너비="1920"]
Frequently Asked Questions
What is the worth of the global glufosinate market?
The global Glufosinate market was valued at 2.34 billion in 2022 and is projected to reach 4.35 billion by 2029, growing at a CAGR of 9.25% from 2022 to 2029
Which market segments are covered in the report on the glufosinate market?
Based on source, type, application, and region the glufosinate market reports divisions are broken down.
What is the CAGR of the glufosinate market?
The global glufosinate market registered a CAGR of 9.25% from 2022 to 2029. The industry segment was the highest revenue contributor to the market.
Which are the top companies to hold the market share in the glufosinate market?
Key players profiled in the report include Nufarm Ltd, Jiangsu Huangma Agrochemicals Co, Ltd., Jiangsu Sevencontinent Green Chemical Co., Ltd., Hebei Veyong Bio-Chemical Co., Ltd., Zhejiang Yongnong Chem. Ind. Co. Ltd., Bayer AG, Limin Chemical Co., Ltd, UPL Limited, Lier Chemical Co., Ltd., SinoHarvest Corporation, DuPont de Nemours and others
Which is the largest regional market for glufosinate market?
The market was dominated by the North American area, which held the biggest proportion.
Glufosinate Market Segment Analysis:
Based on crop type, formulation type, application, and region, the global market for glufosinate is divided into these categories.
On the basis of crop types, the glufosinate market is subdivided into Cereals & Grains, Oilseeds & Pulses, Fruits & Vegetables. The main crop types for which glufosinate herbicides are used globally are cereals and grains and oilseeds & pulses. China, India, and South Korea are the three largest contributors to the Asia-Pacific region's worldwide glufosinate market. Any grass that has been grown specifically for its grain, which consists of an endosperm, a germ, and a bran and is botanically known as a caryopsis, is considered a cereal.
Cereal grain crops are staple crops because they are grown in bigger quantities than any other form of crop and because they produce more food energy than any other type of crop. Oil content in pulse is typically lower, even though oilseeds typically contain between 18% and 50% oil, with sunflower seeds having the highest oil content. Unsaturated fatty acids (linoleic, oleic) make up these oils. Additionally, oats, maize, and seeds that contain oil are good providers of essential fatty acids. A diet high in fruits and vegetables can lower blood pressure, lessen the risk of heart disease and stroke, prevent some types of cancer, cut the risk of eye and digestive issues, and improve blood sugar levels, which can help control appetite.
On the basis of formulation type the glufosinate market is further divided into Aqueous Suspension, Liquid, Suspension Concentrate, Soluble (Liquid) Concentrate. The market for liquid glufosinate is anticipated to grow significantly through 2029 as a result of the rising need for low-temperature stability across a range of industrial and non-industrial verticals. Since it is simple to use and has little direct impact on animals, liquid glufosinate is being used more frequently in agricultural regions to manage weeds. The market will expand due to the rising use of agrochemicals and the increased demand for product safety.
A mixture of crystalline cellulose, at least one component chosen from the group consisting of cellulose ether, polyvinyl alcohol, and copolymers of polyvinyl alcohol and polyvinyl pyrrolidone, at least one component chosen from the group consisting of polyvinyl pyrrolidone, vegetable mucilage, and derived protein, and a pharmaceutically active ingredient that is insoluble or sparingly soluble in water. Also, when compared to other formulation types like emulsifiable concentrate (EC) and wettable powder, SCs have gained appeal because to advantages including lack of dust, convenience of use, and effectiveness. (WP).
The active ingredient must continue to be insoluble at all temperatures in order to create a stable SC. concentrated soluble a liquid, homogeneous formulation that, after being diluted with water, is to be used as a real solution of the active ingredient. So, distributing oil a substance that, when applied to water, forms a surface layer. Application based glufosinate further divided into Non-Agricultural, Agricultural, Pharmaceutical, Oilseeds & Pulses. When glufosinate is applied to plants, the tissues experience decreased glutamine and increased ammonia levels, which inhibit photosynthesis and cause plant death.
Peas, lentils, and beans are examples of pulses. As an illustration, a pea pod is a legume, while the pea within is a pulse. In agriculture, the entire legume plant is frequently employed. The increased output of agricultural crops such as maize, soybean, beans, canola, sugar beets, sugar cane and sweet potatoes that are genetically modified to tolerate glufosinate is predicted to enhance demand for glufosinate over the next years.
[caption id="attachment_21050" align="aligncenter" width="1920"]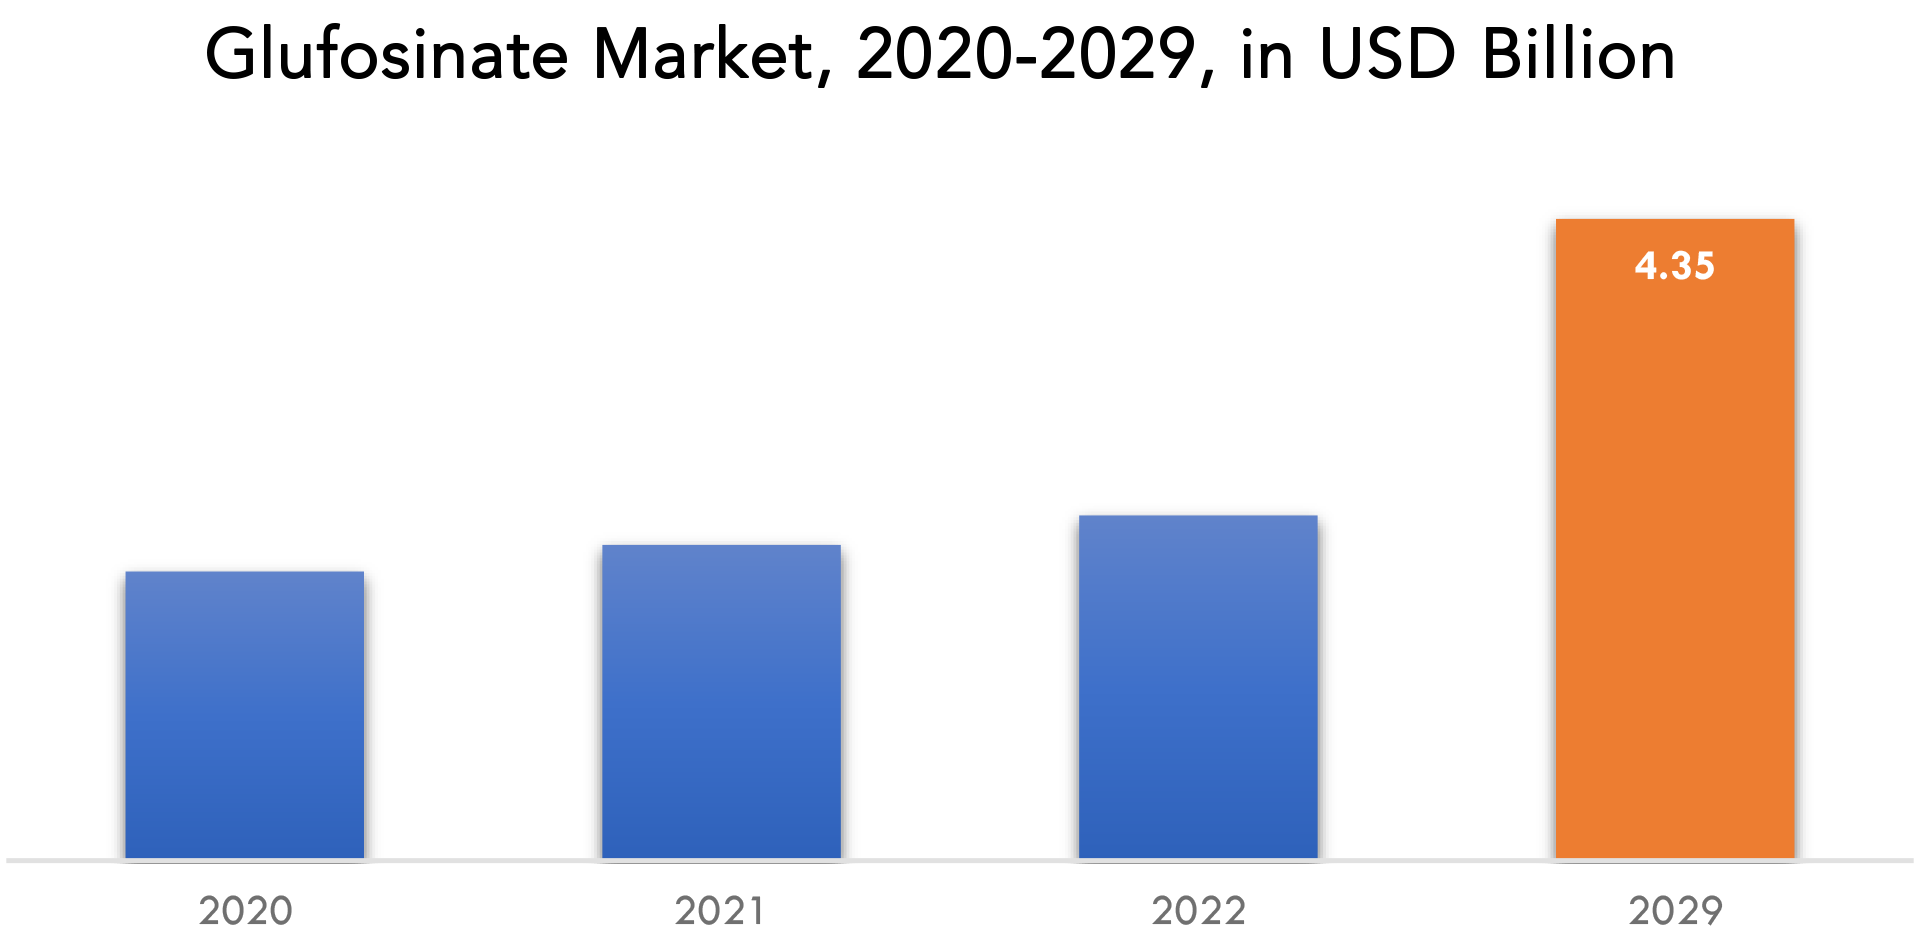
Glufosinate Market Key Players:
The major players operating in the global Glufosinate industry include the major market players include Nufarm Ltd, Jiangsu Huangma Agrochemicals Co, Ltd., Jiangsu Sevencontinent Green Chemical Co., Ltd., Hebei Veyong Bio-Chemical Co., Ltd., Zhejiang Yongnong Chem. Ind. Co. Ltd., Bayer AG, Limin Chemical Co., Ltd, UPL Limited, Lier Chemical Co., Ltd., SinoHarvest Corporation, DuPont de Nemours and others
Industry News:14 March 2023: Bayer collaborated with Microsoft to unveil new cloud-based enterprise solutions, advancing innovation and transparency in the agri-food industry.
13 February 2023: Bayer completed the acquisition of Blackford Analysis Ltd company.
Who Should Buy? Or Key stakeholders
- Manufacturing
- End-Use Industries
- BFSI
- Agricultural
- Manufacturing & Construction
- Regulatory Authorities
- Research Organizations
- Healthcare
- Pharmaceutical
Glufosinate Market Regional Analysis:
Geographically, the Glufosinate market is segmented into North America, South America, Europe, APAC, and MEA.
- North America: includes the US, Canada, Mexico
- Europe: includes the UK, Germany, France, Italy, Spain, Russia, and the Rest of Europe
- Asia Pacific: includes China, Japan, South Korea, India, Australia, ASEAN, and the Rest of APAC
- South America: includes Brazil, Argentina, and the Rest of South America
- Middle East & Africa: includes Turkey, UAE, Saudi Arabia, South Africa, and the Rest of MEA
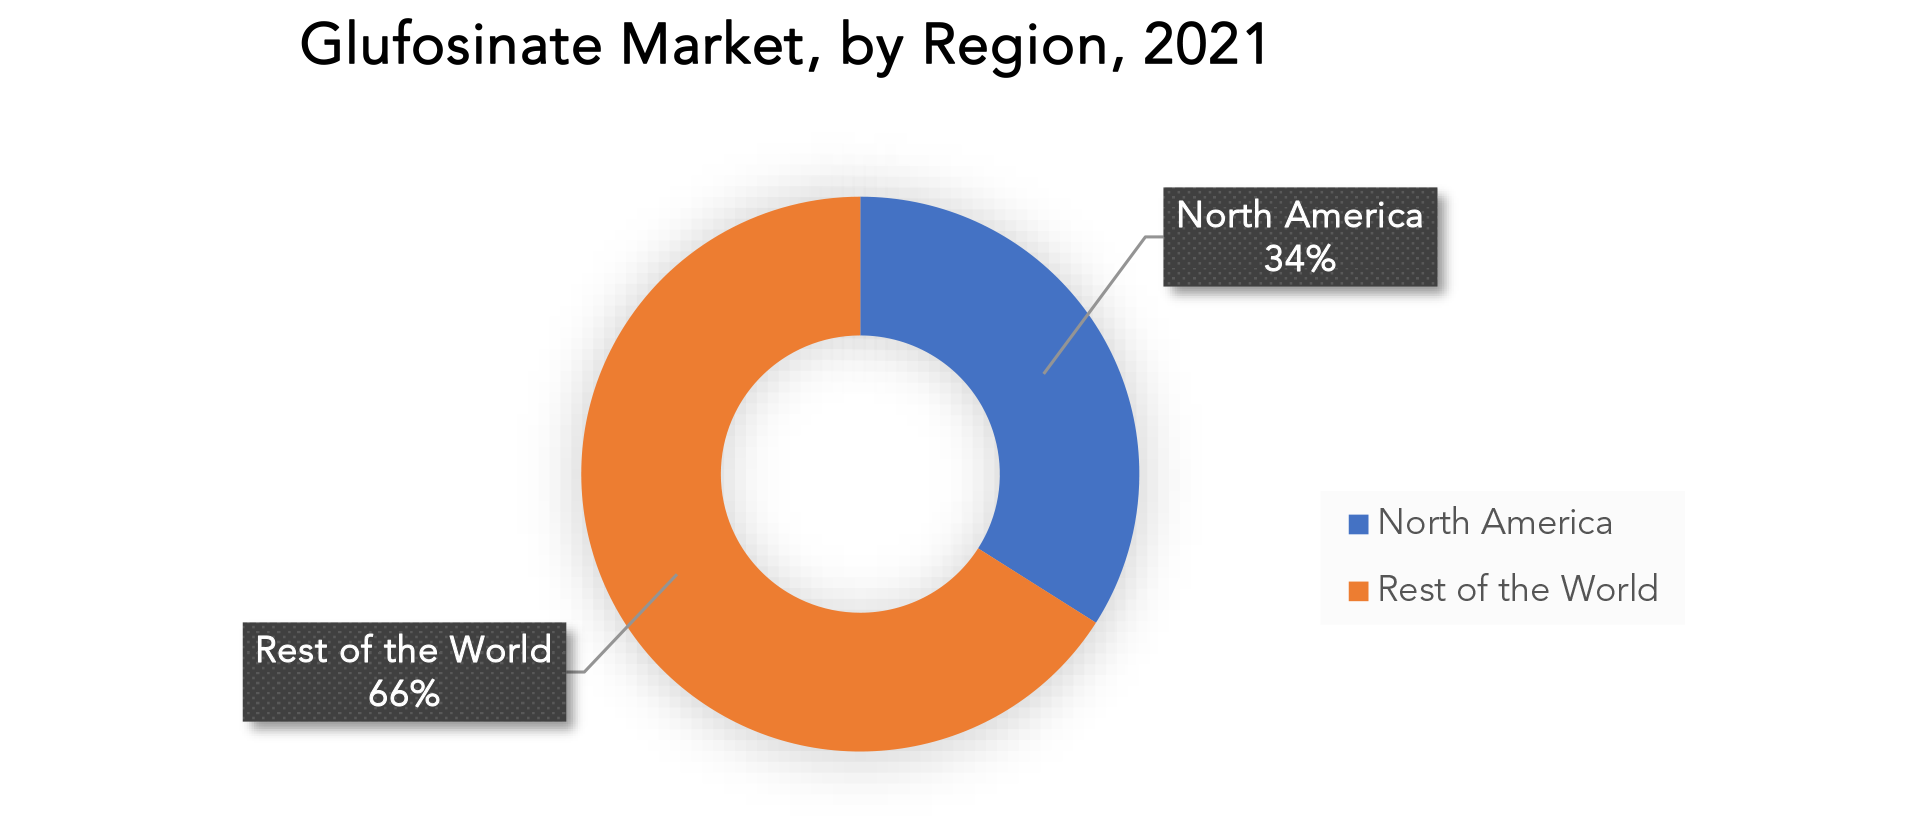
North America glufosinate market will gain notable proceeds due to the improving popularity of bio-based agro solutions and the higher yield of glufosinate-tolerant crops. The number of research projects and programmes in the area has increased as a result of this. Additionally, the presence of diverse production facilities and industry players in the area is another important feature that will promote the industry's expansion. The market for glufosinate is expanding as a result of factors such rising area planted in glufosinate-tolerant crops and glyphosate herbicide product resistance in North American nations.
Key Market Segments: Glufosinate Market
Glufosinate Market By Crop Type, 2020-2029, (USD Billion) (Thousand Liters)
- Cereals & Grains
- Oilseeds & Pulses
- Fruits & Vegetables
- Aqueous Suspension
- Liquid
- Suspension Concentrate
- Soluble (Liquid) Concentrate
- Non-Agricultural
- Agricultural
- Pharmaceutical
- Oilseeds & Pulses
- North America
- Europe
- Asia Pacific
- South America
- Middle East And Africa
Exactitude Consultancy Services Key Objectives:
- Increasing sales and market share
- Developing new technology
- Improving profitability
- Entering new markets
- Enhancing brand reputation
Key Question Answered:
- What is the expected growth rate of the glufosinate market over the next 7 years?
- Who are the major players in the glufosinate market and what is their market share?
- What are the end-user industries driving demand for the market and what is their outlook?
- What are the opportunities for growth in emerging markets such as Asia-Pacific, the Middle East, and Africa?
- How is the economic environment affecting the glufosinate market, including factors such as interest rates, inflation, and exchange rates?
- What is the expected impact of government policies and regulations on the glufosinate market?
- What is the current and forecasted size and growth rate of the global glufosinate market?
- What are the key drivers of growth in the glufosinate market?
- Who are the major players in the market and what is their market share?
- What are the distribution channels and supply chain dynamics in the glufosinate market?
- What are the technological advancements and innovations in the glufosinate market and their impact on product development and growth?
- What are the regulatory considerations and their impact on the market?
- What are the challenges faced by players in the glufosinate market and how are they addressing these challenges?
- What are the opportunities for growth and expansion in the glufosinate market?
- What are the product offerings and specifications of leading players in the market?
- 소개
- 시장 정의
- 시장 세분화
- 연구 일정
- 가정 및 제한
- 연구 방법론
- 데이터 마이닝
- 2차 연구
- 1차 연구
- 주제별 전문가의 조언
- 품질 검사
- 최종 검토
- 데이터 삼각 측량
- 바텀업 방식
- 탑다운 접근 방식
- 연구 흐름
- 데이터 소스
- 데이터 마이닝
- 요약
- 시장 개요
- 글로벌 글루포시네이트 시장 전망
- 시장 동인
- 시장 제약
- 시장 기회
- 글루포시네이트 시장에 대한 COVID-19의 영향
- 포터의 5가지 힘 모델
- 신규 진입자의 위협
- 대체품으로부터의 위협
- 공급업체의 협상력
- 고객의 협상력
- 경쟁의 정도
- 산업 가치 사슬 분석
- 글로벌 글루포시네이트 시장 전망
- 작물 유형별 글로벌 글루포시네이트 시장, 2020-2029, (10억 달러) (천 리터)
- 시리얼 & 곡물
- 유지종자 및 콩류
- 과일 및 야채
- 제형 유형별 글로벌 글루포시네이트 시장, 2020-2029, (10억 달러) (천 리터)
- 수성 현탁액
- 액체
- 서스펜션 농축액
- 가용성(액체) 농축물
- 응용 분야별 글로벌 글루포시네이트 시장, 2020-2029, (10억 달러) (천 리터)
- 비농업
- 농업
- 제약
- 유지종자 및 콩류
- 지역별 글로벌 글루포시네이트 시장, 2020-2029, (USD 십억) (천 리터)
- 북아메리카
- 우리를
- 캐나다
- 멕시코
- 남아메리카
- 브라질
- 아르헨티나
- 콜롬비아
- 남미의 나머지 지역
- 유럽
- 독일
- 영국
- 프랑스
- 이탈리아
- 스페인
- 러시아 제국
- 유럽의 나머지 지역
- 아시아 태평양
- 인도
- 중국
- 일본
- 대한민국
- 호주
- 동남아시아
- 아시아 태평양의 나머지 지역
- 중동 및 아프리카
- 아랍에미리트
- 사우디 아라비아
- 남아프리카 공화국
- 중동 및 아프리카의 나머지 지역
- 북아메리카
- 회사 프로필* (사업 개요, 회사 스냅샷, 제공 제품, 최근 개발)
- 주식회사 누팜
- 장쑤 황마 농화학 유한회사
- 장쑤 7대륙 녹색 화학 유한회사
- 허베이 베이옹 생물 화학 유한회사
- ZHEJIANG YONGNONG CHEM. IND. 주식회사
- 바이엘 AG
- 리민화학(주)
- 유플 리미티드
- 리얼 케미컬 주식회사
- 시노하베스트 주식회사
- DUPONT DE NEMOURS *회사 목록은 표시용입니다.
표 목록
TABLE 1 GLOBAL GLUFOSINATE MARKET BY CROP TYPE (USD BILLION) 2020-2029
TABLE 2 GLOBAL GLUFOSINATE MARKET BY CROP TYPE (THOUSAND LITERS) 2020-2029
TABLE 3 GLOBAL GLUFOSINATE MARKET BY FORMULATION TYPE (USD BILLION) 2020-2029
TABLE 4 GLOBAL GLUFOSINATE MARKET BY FORMULATION TYPE (THOUSAND LITERS) 2020-2029
TABLE 5 GLOBAL GLUFOSINATE MARKET BY APPLICATION (USD BILLION) 2020-2029
TABLE 6 GLOBAL GLUFOSINATE MARKET BY APPLICATION (THOUSAND LITERS) 2020-2029
TABLE 7 GLOBAL GLUFOSINATE MARKET BY REGION (USD BILLION) 2020-2029
TABLE 8 GLOBAL GLUFOSINATE MARKET BY REGION (THOUSAND LITERS) 2020-2029
TABLE 9 NORTH AMERICA GLUFOSINATE MARKET BY CROP TYPE (USD BILLION) 2020-2029
TABLE 10 NORTH AMERICA GLUFOSINATE MARKET BY CROP TYPE (THOUSAND LITERS) 2020-2029
TABLE 11 NORTH AMERICA GLUFOSINATE MARKET BY FORMULATION TYPE (USD BILLION) 2020-2029
TABLE 12 NORTH AMERICA GLUFOSINATE MARKET BY FORMULATION TYPE (THOUSAND LITERS) 2020-2029
TABLE 13 NORTH AMERICA GLUFOSINATE MARKET BY APPLICATION (USD BILLION) 2020-2029
TABLE 14 NORTH AMERICA GLUFOSINATE MARKET BY APPLICATION (THOUSAND LITERS) 2020-2029
TABLE 15 NORTH AMERICA GLUFOSINATE MARKET BY COUNTRY (USD BILLION) 2020-2029
TABLE 16 NORTH AMERICA GLUFOSINATE MARKET BY COUNTRY (THOUSAND LITERS) 2020-2029
TABLE 17 US GLUFOSINATE MARKET BY CROP TYPE (USD BILLION) 2020-2029
TABLE 18 US GLUFOSINATE MARKET BY CROP TYPE (THOUSAND LITERS) 2020-2029
TABLE 19 US GLUFOSINATE MARKET BY FORMULATION TYPE (USD BILLION) 2020-2029
TABLE 20 US GLUFOSINATE MARKET BY FORMULATION TYPE (THOUSAND LITERS) 2020-2029
TABLE 21 US GLUFOSINATE MARKET BY APPLICATION (USD BILLION) 2020-2029
TABLE 22 US GLUFOSINATE MARKET BY APPLICATION (THOUSAND LITERS) 2020-2029
TABLE 23 CANADA GLUFOSINATE MARKET BY CROP TYPE (USD BILLION) 2020-2029
TABLE 24 CANADA GLUFOSINATE MARKET BY CROP TYPE (THOUSAND LITERS) 2020-2029
TABLE 25 CANADA GLUFOSINATE MARKET BY FORMULATION TYPE (USD BILLION) 2020-2029
TABLE 26 CANADA GLUFOSINATE MARKET BY FORMULATION TYPE (THOUSAND LITERS) 2020-2029
TABLE 27 CANADA GLUFOSINATE MARKET BY APPLICATION (USD BILLION) 2020-2029
TABLE 28 CANADA GLUFOSINATE MARKET BY APPLICATION (THOUSAND LITERS) 2020-2029
TABLE 29 MEXICO GLUFOSINATE MARKET BY CROP TYPE (USD BILLION) 2020-2029
TABLE 30 MEXICO GLUFOSINATE MARKET BY CROP TYPE (THOUSAND LITERS) 2020-2029
TABLE 31 MEXICO GLUFOSINATE MARKET BY FORMULATION TYPE (USD BILLION) 2020-2029
TABLE 32 MEXICO GLUFOSINATE MARKET BY FORMULATION TYPE (THOUSAND LITERS) 2020-2029
TABLE 33 MEXICO GLUFOSINATE MARKET BY APPLICATION (USD BILLION) 2020-2029
TABLE 34 MEXICO GLUFOSINATE MARKET BY APPLICATION (THOUSAND LITERS) 2020-2029
TABLE 35 SOUTH AMERICA GLUFOSINATE MARKET BY CROP TYPE (USD BILLION) 2020-2029
TABLE 36 SOUTH AMERICA GLUFOSINATE MARKET BY CROP TYPE (THOUSAND LITERS) 2020-2029
TABLE 37 SOUTH AMERICA GLUFOSINATE MARKET BY FORMULATION TYPE (USD BILLION) 2020-2029
TABLE 38 SOUTH AMERICA GLUFOSINATE MARKET BY FORMULATION TYPE (THOUSAND LITERS) 2020-2029
TABLE 39 SOUTH AMERICA GLUFOSINATE MARKET BY APPLICATION (USD BILLION) 2020-2029
TABLE 40 SOUTH AMERICA GLUFOSINATE MARKET BY APPLICATION (THOUSAND LITERS) 2020-2029
TABLE 41 SOUTH AMERICA GLUFOSINATE MARKET BY COUNTRY (USD BILLION) 2020-2029
TABLE 42 SOUTH AMERICA GLUFOSINATE MARKET BY COUNTRY (THOUSAND LITERS) 2020-2029
TABLE 43 BRAZIL GLUFOSINATE MARKET BY CROP TYPE (USD BILLION) 2020-2029
TABLE 44 BRAZIL GLUFOSINATE MARKET BY CROP TYPE (THOUSAND LITERS) 2020-2029
TABLE 45 BRAZIL GLUFOSINATE MARKET BY FORMULATION TYPE (USD BILLION) 2020-2029
TABLE 46 BRAZIL GLUFOSINATE MARKET BY FORMULATION TYPE (THOUSAND LITERS) 2020-2029
TABLE 47 BRAZIL GLUFOSINATE MARKET BY APPLICATION (USD BILLION) 2020-2029
TABLE 48 BRAZIL GLUFOSINATE MARKET BY APPLICATION (THOUSAND LITERS) 2020-2029
TABLE 49 ARGENTINA GLUFOSINATE MARKET BY CROP TYPE (USD BILLION) 2020-2029
TABLE 50 ARGENTINA GLUFOSINATE MARKET BY CROP TYPE (THOUSAND LITERS) 2020-2029
TABLE 51 ARGENTINA GLUFOSINATE MARKET BY FORMULATION TYPE (USD BILLION) 2020-2029
TABLE 52 ARGENTINA GLUFOSINATE MARKET BY FORMULATION TYPE (THOUSAND LITERS) 2020-2029
TABLE 53 ARGENTINA GLUFOSINATE MARKET BY APPLICATION (USD BILLION) 2020-2029
TABLE 54 ARGENTINA GLUFOSINATE MARKET BY APPLICATION (THOUSAND LITERS) 2020-2029
TABLE 55 COLOMBIA GLUFOSINATE MARKET BY CROP TYPE (USD BILLION) 2020-2029
TABLE 56 COLOMBIA GLUFOSINATE MARKET BY CROP TYPE (THOUSAND LITERS) 2020-2029
TABLE 57 COLOMBIA GLUFOSINATE MARKET BY FORMULATION TYPE (USD BILLION) 2020-2029
TABLE 58 COLOMBIA GLUFOSINATE MARKET BY FORMULATION TYPE (THOUSAND LITERS) 2020-2029
TABLE 59 COLOMBIA GLUFOSINATE MARKET BY APPLICATION (USD BILLION) 2020-2029
TABLE 60 COLOMBIA GLUFOSINATE MARKET BY APPLICATION (THOUSAND LITERS) 2020-2029
TABLE 61 REST OF SOUTH AMERICA GLUFOSINATE MARKET BY CROP TYPE (USD BILLION) 2020-2029
TABLE 62 REST OF SOUTH AMERICA GLUFOSINATE MARKET BY CROP TYPE (THOUSAND LITERS) 2020-2029
TABLE 63 REST OF SOUTH AMERICA GLUFOSINATE MARKET BY FORMULATION TYPE (USD BILLION) 2020-2029
TABLE 64 REST OF SOUTH AMERICA GLUFOSINATE MARKET BY FORMULATION TYPE (THOUSAND LITERS) 2020-2029
TABLE 65 REST OF SOUTH AMERICA GLUFOSINATE MARKET BY APPLICATION (USD BILLION) 2020-2029
TABLE 66 REST OF SOUTH AMERICA GLUFOSINATE MARKET BY APPLICATION (THOUSAND LITERS) 2020-2029
TABLE 67 ASIA-PACIFIC GLUFOSINATE MARKET BY CROP TYPE (USD BILLION) 2020-2029
TABLE 68 ASIA-PACIFIC GLUFOSINATE MARKET BY CROP TYPE (THOUSAND LITERS) 2020-2029
TABLE 69 ASIA-PACIFIC GLUFOSINATE MARKET BY FORMULATION TYPE (USD BILLION) 2020-2029
TABLE 70 ASIA-PACIFIC GLUFOSINATE MARKET BY FORMULATION TYPE (THOUSAND LITERS) 2020-2029
TABLE 71 ASIA-PACIFIC GLUFOSINATE MARKET BY APPLICATION (USD BILLION) 2020-2029
TABLE 72 ASIA-PACIFIC GLUFOSINATE MARKET BY APPLICATION (THOUSAND LITERS) 2020-2029
TABLE 73 ASIA-PACIFIC GLUFOSINATE MARKET BY COUNTRY (USD BILLION) 2020-2029
TABLE 74 ASIA-PACIFIC GLUFOSINATE MARKET BY COUNTRY (THOUSAND LITERS) 2020-2029
TABLE 75 INDIA GLUFOSINATE MARKET BY CROP TYPE (USD BILLION) 2020-2029
TABLE 76 INDIA GLUFOSINATE MARKET BY CROP TYPE (THOUSAND LITERS) 2020-2029
TABLE 77 INDIA GLUFOSINATE MARKET BY FORMULATION TYPE (USD BILLION) 2020-2029
TABLE 78 INDIA GLUFOSINATE MARKET BY FORMULATION TYPE (THOUSAND LITERS) 2020-2029
TABLE 79 INDIA GLUFOSINATE MARKET BY APPLICATION (USD BILLION) 2020-2029
TABLE 80 INDIA GLUFOSINATE MARKET BY APPLICATION (THOUSAND LITERS) 2020-2029
TABLE 81 CHINA GLUFOSINATE MARKET BY CROP TYPE (USD BILLION) 2020-2029
TABLE 82 CHINA GLUFOSINATE MARKET BY CROP TYPE (THOUSAND LITERS) 2020-2029
TABLE 83 CHINA GLUFOSINATE MARKET BY FORMULATION TYPE (USD BILLION) 2020-2029
TABLE 84 CHINA GLUFOSINATE MARKET BY FORMULATION TYPE (THOUSAND LITERS) 2020-2029
TABLE 85 CHINA GLUFOSINATE MARKET BY APPLICATION (USD BILLION) 2020-2029
TABLE 86 CHINA GLUFOSINATE MARKET BY APPLICATION (THOUSAND LITERS) 2020-2029
TABLE 87 JAPAN GLUFOSINATE MARKET BY CROP TYPE (USD BILLION) 2020-2029
TABLE 88 JAPAN GLUFOSINATE MARKET BY CROP TYPE (THOUSAND LITERS) 2020-2029
TABLE 89 JAPAN GLUFOSINATE MARKET BY FORMULATION TYPE (USD BILLION) 2020-2029
TABLE 90 JAPAN GLUFOSINATE MARKET BY FORMULATION TYPE (THOUSAND LITERS) 2020-2029
TABLE 91 JAPAN GLUFOSINATE MARKET BY APPLICATION (USD BILLION) 2020-2029
TABLE 92 JAPAN GLUFOSINATE MARKET BY APPLICATION (THOUSAND LITERS) 2020-2029
TABLE 93 SOUTH KOREA GLUFOSINATE MARKET BY CROP TYPE (USD BILLION) 2020-2029
TABLE 94 SOUTH KOREA GLUFOSINATE MARKET BY CROP TYPE (THOUSAND LITERS) 2020-2029
TABLE 95 SOUTH KOREA GLUFOSINATE MARKET BY FORMULATION TYPE (USD BILLION) 2020-2029
TABLE 96 SOUTH KOREA GLUFOSINATE MARKET BY FORMULATION TYPE (THOUSAND LITERS) 2020-2029
TABLE 97 SOUTH KOREA GLUFOSINATE MARKET BY APPLICATION (USD BILLION) 2020-2029
TABLE 98 SOUTH KOREA GLUFOSINATE MARKET BY APPLICATION (THOUSAND LITERS) 2020-2029
TABLE 99 AUSTRALIA GLUFOSINATE MARKET BY CROP TYPE (USD BILLION) 2020-2029
TABLE 100 AUSTRALIA GLUFOSINATE MARKET BY CROP TYPE (THOUSAND LITERS) 2020-2029
TABLE 101 AUSTRALIA GLUFOSINATE MARKET BY FORMULATION TYPE (USD BILLION) 2020-2029
TABLE 102 AUSTRALIA GLUFOSINATE MARKET BY FORMULATION TYPE (THOUSAND LITERS) 2020-2029
TABLE 103 AUSTRALIA GLUFOSINATE MARKET BY APPLICATION (USD BILLION) 2020-2029
TABLE 104 AUSTRALIA GLUFOSINATE MARKET BY APPLICATION (THOUSAND LITERS) 2020-2029
TABLE 105 SOUTH-EAST ASIA GLUFOSINATE MARKET BY CROP TYPE (USD BILLION) 2020-2029
TABLE 106 SOUTH-EAST ASIA GLUFOSINATE MARKET BY CROP TYPE (THOUSAND LITERS) 2020-2029
TABLE 107 SOUTH-EAST ASIA GLUFOSINATE MARKET BY FORMULATION TYPE (USD BILLION) 2020-2029
TABLE 108 SOUTH-EAST ASIA GLUFOSINATE MARKET BY FORMULATION TYPE (THOUSAND LITERS) 2020-2029
TABLE 109 SOUTH-EAST ASIA GLUFOSINATE MARKET BY APPLICATION (USD BILLION) 2020-2029
TABLE 110 SOUTH-EAST ASIA GLUFOSINATE MARKET BY APPLICATION (THOUSAND LITERS) 2020-2029
TABLE 111 REST OF ASIA PACIFIC GLUFOSINATE MARKET BY CROP TYPE (USD BILLION) 2020-2029
TABLE 112 REST OF ASIA PACIFIC GLUFOSINATE MARKET BY CROP TYPE (THOUSAND LITERS) 2020-2029
TABLE 113 REST OF ASIA PACIFIC GLUFOSINATE MARKET BY FORMULATION TYPE (USD BILLION) 2020-2029
TABLE 114 REST OF ASIA PACIFIC GLUFOSINATE MARKET BY FORMULATION TYPE (THOUSAND LITERS) 2020-2029
TABLE 115 REST OF ASIA PACIFIC GLUFOSINATE MARKET BY APPLICATION (USD BILLION) 2020-2029
TABLE 116 REST OF ASIA PACIFIC GLUFOSINATE MARKET BY APPLICATION (THOUSAND LITERS) 2020-2029
TABLE 117 EUROPE GLUFOSINATE MARKET BY CROP TYPE (USD BILLION) 2020-2029
TABLE 118 EUROPE GLUFOSINATE MARKET BY CROP TYPE (THOUSAND LITERS) 2020-2029
TABLE 119 EUROPE GLUFOSINATE MARKET BY FORMULATION TYPE (USD BILLION) 2020-2029
TABLE 120 EUROPE GLUFOSINATE MARKET BY FORMULATION TYPE (THOUSAND LITERS) 2020-2029
TABLE 121 EUROPE GLUFOSINATE MARKET BY APPLICATION (USD BILLION) 2020-2029
TABLE 122 EUROPE GLUFOSINATE MARKET BY APPLICATION (THOUSAND LITERS) 2020-2029
TABLE 123 EUROPE GLUFOSINATE MARKET BY COUNTRY (USD BILLION) 2020-2029
TABLE 124 EUROPE GLUFOSINATE MARKET BY COUNTRY (THOUSAND LITERS) 2020-2029
TABLE 125 GERMANY GLUFOSINATE MARKET BY CROP TYPE (USD BILLION) 2020-2029
TABLE 126 GERMANY GLUFOSINATE MARKET BY CROP TYPE (THOUSAND LITERS) 2020-2029
TABLE 127 GERMANY GLUFOSINATE MARKET BY FORMULATION TYPE (USD BILLION) 2020-2029
TABLE 128 GERMANY GLUFOSINATE MARKET BY FORMULATION TYPE (THOUSAND LITERS) 2020-2029
TABLE 129 GERMANY GLUFOSINATE MARKET BY APPLICATION (USD BILLION) 2020-2029
TABLE 130 GERMANY GLUFOSINATE MARKET BY APPLICATION (THOUSAND LITERS) 2020-2029
TABLE 131 UK GLUFOSINATE MARKET BY CROP TYPE (USD BILLION) 2020-2029
TABLE 132 UK GLUFOSINATE MARKET BY CROP TYPE (THOUSAND LITERS) 2020-2029
TABLE 133 UK GLUFOSINATE MARKET BY FORMULATION TYPE (USD BILLION) 2020-2029
TABLE 134 UK GLUFOSINATE MARKET BY FORMULATION TYPE (THOUSAND LITERS) 2020-2029
TABLE 135 UK GLUFOSINATE MARKET BY APPLICATION (USD BILLION) 2020-2029
TABLE 136 UK GLUFOSINATE MARKET BY APPLICATION (THOUSAND LITERS) 2020-2029
TABLE 137 FRANCE GLUFOSINATE MARKET BY CROP TYPE (USD BILLION) 2020-2029
TABLE 138 FRANCE GLUFOSINATE MARKET BY CROP TYPE (THOUSAND LITERS) 2020-2029
TABLE 139 FRANCE GLUFOSINATE MARKET BY FORMULATION TYPE (USD BILLION) 2020-2029
TABLE 140 FRANCE GLUFOSINATE MARKET BY FORMULATION TYPE (THOUSAND LITERS) 2020-2029
TABLE 141 FRANCE GLUFOSINATE MARKET BY APPLICATION (USD BILLION) 2020-2029
TABLE 142 FRANCE GLUFOSINATE MARKET BY APPLICATION (THOUSAND LITERS) 2020-2029
TABLE 143 ITALY GLUFOSINATE MARKET BY CROP TYPE (USD BILLION) 2020-2029
TABLE 144 ITALY GLUFOSINATE MARKET BY CROP TYPE (THOUSAND LITERS) 2020-2029
TABLE 145 ITALY GLUFOSINATE MARKET BY FORMULATION TYPE (USD BILLION) 2020-2029
TABLE 146 ITALY GLUFOSINATE MARKET BY FORMULATION TYPE (THOUSAND LITERS) 2020-2029
TABLE 147 ITALY GLUFOSINATE MARKET BY APPLICATION (USD BILLION) 2020-2029
TABLE 148 ITALY GLUFOSINATE MARKET BY APPLICATION (THOUSAND LITERS) 2020-2029
TABLE 149 SPAIN GLUFOSINATE MARKET BY CROP TYPE (USD BILLION) 2020-2029
TABLE 150 SPAIN GLUFOSINATE MARKET BY CROP TYPE (THOUSAND LITERS) 2020-2029
TABLE 151 SPAIN GLUFOSINATE MARKET BY FORMULATION TYPE (USD BILLION) 2020-2029
TABLE 152 SPAIN GLUFOSINATE MARKET BY FORMULATION TYPE (THOUSAND LITERS) 2020-2029
TABLE 153 SPAIN GLUFOSINATE MARKET BY APPLICATION (USD BILLION) 2020-2029
TABLE 154 SPAIN GLUFOSINATE MARKET BY APPLICATION (THOUSAND LITERS) 2020-2029
TABLE 155 RUSSIA GLUFOSINATE MARKET BY CROP TYPE (USD BILLION) 2020-2029
TABLE 156 RUSSIA GLUFOSINATE MARKET BY CROP TYPE (THOUSAND LITERS) 2020-2029
TABLE 157 RUSSIA GLUFOSINATE MARKET BY FORMULATION TYPE (USD BILLION) 2020-2029
TABLE 158 RUSSIA GLUFOSINATE MARKET BY FORMULATION TYPE (THOUSAND LITERS) 2020-2029
TABLE 159 RUSSIA GLUFOSINATE MARKET BY APPLICATION (USD BILLION) 2020-2029
TABLE 160 RUSSIA GLUFOSINATE MARKET BY APPLICATION (THOUSAND LITERS) 2020-2029
TABLE 161 REST OF EUROPE GLUFOSINATE MARKET BY CROP TYPE (USD BILLION) 2020-2029
TABLE 162 REST OF EUROPE GLUFOSINATE MARKET BY CROP TYPE (THOUSAND LITERS) 2020-2029
TABLE 163 REST OF EUROPE GLUFOSINATE MARKET BY FORMULATION TYPE (USD BILLION) 2020-2029
TABLE 164 REST OF EUROPE GLUFOSINATE MARKET BY FORMULATION TYPE (THOUSAND LITERS) 2020-2029
TABLE 165 REST OF EUROPE GLUFOSINATE MARKET BY APPLICATION (USD BILLION) 2020-2029
TABLE 166 REST OF EUROPE GLUFOSINATE MARKET BY APPLICATION (THOUSAND LITERS) 2020-2029
TABLE 167 MIDDLE EAST AND AFRICA GLUFOSINATE MARKET BY CROP TYPE (USD BILLION) 2020-2029
TABLE 168 MIDDLE EAST AND AFRICA GLUFOSINATE MARKET BY CROP TYPE (THOUSAND LITERS) 2020-2029
TABLE 169 MIDDLE EAST AND AFRICA GLUFOSINATE MARKET BY FORMULATION TYPE (USD BILLION) 2020-2029
TABLE 170 MIDDLE EAST AND AFRICA GLUFOSINATE MARKET BY FORMULATION TYPE (THOUSAND LITERS) 2020-2029
TABLE 171 MIDDLE EAST AND AFRICA GLUFOSINATE MARKET BY APPLICATION (USD BILLION) 2020-2029
TABLE 172 MIDDLE EAST AND AFRICA GLUFOSINATE MARKET BY APPLICATION (THOUSAND LITERS) 2020-2029
TABLE 173 MIDDLE EAST AND AFRICA GLUFOSINATE MARKET BY COUNTRY (USD BILLION) 2020-2029
TABLE 174 MIDDLE EAST AND AFRICA GLUFOSINATE MARKET BY COUNTRY (THOUSAND LITERS) 2020-2029
TABLE 175 UAE GLUFOSINATE MARKET BY CROP TYPE (USD BILLION) 2020-2029
TABLE 176 UAE GLUFOSINATE MARKET BY CROP TYPE (THOUSAND LITERS) 2020-2029
TABLE 177 UAE GLUFOSINATE MARKET BY FORMULATION TYPE (USD BILLION) 2020-2029
TABLE 178 UAE GLUFOSINATE MARKET BY FORMULATION TYPE (THOUSAND LITERS) 2020-2029
TABLE 179 UAE GLUFOSINATE MARKET BY APPLICATION (USD BILLION) 2020-2029
TABLE 180 UAE GLUFOSINATE MARKET BY APPLICATION (THOUSAND LITERS) 2020-2029
TABLE 181 SAUDI ARABIA GLUFOSINATE MARKET BY CROP TYPE (USD BILLION) 2020-2029
TABLE 182 SAUDI ARABIA GLUFOSINATE MARKET BY CROP TYPE (THOUSAND LITERS) 2020-2029
TABLE 183 SAUDI ARABIA GLUFOSINATE MARKET BY FORMULATION TYPE (USD BILLION) 2020-2029
TABLE 184 SAUDI ARABIA GLUFOSINATE MARKET BY FORMULATION TYPE (THOUSAND LITERS) 2020-2029
TABLE 185 SAUDI ARABIA GLUFOSINATE MARKET BY APPLICATION (USD BILLION) 2020-2029
TABLE 186 SAUDI ARABIA GLUFOSINATE MARKET BY APPLICATION (THOUSAND LITERS) 2020-2029
TABLE 187 SOUTH AFRICA GLUFOSINATE MARKET BY CROP TYPE (USD BILLION) 2020-2029
TABLE 188 SOUTH AFRICA GLUFOSINATE MARKET BY CROP TYPE (THOUSAND LITERS) 2020-2029
TABLE 189 SOUTH AFRICA GLUFOSINATE MARKET BY FORMULATION TYPE (USD BILLION) 2020-2029
TABLE 190 SOUTH AFRICA GLUFOSINATE MARKET BY FORMULATION TYPE (THOUSAND LITERS) 2020-2029
TABLE 191 SOUTH AFRICA GLUFOSINATE MARKET BY APPLICATION (USD BILLION) 2020-2029
TABLE 192 SOUTH AFRICA GLUFOSINATE MARKET BY APPLICATION (THOUSAND LITERS) 2020-2029
TABLE 193 REST OF MIDDLE EAST AND AFRICA GLUFOSINATE MARKET BY CROP TYPE (USD BILLION) 2020-2029
TABLE 194 REST OF MIDDLE EAST AND AFRICA GLUFOSINATE MARKET BY CROP TYPE (THOUSAND LITERS) 2020-2029
TABLE 195 REST OF MIDDLE EAST AND AFRICA GLUFOSINATE MARKET BY FORMULATION TYPE (USD BILLION) 2020-2029
TABLE 196 REST OF MIDDLE EAST AND AFRICA GLUFOSINATE MARKET BY FORMULATION TYPE (THOUSAND LITERS) 2020-2029
TABLE 197 REST OF MIDDLE EAST AND AFRICA GLUFOSINATE MARKET BY APPLICATION (USD BILLION) 2020-2029
TABLE 198 REST OF MIDDLE EAST AND AFRICA GLUFOSINATE MARKET BY APPLICATION (THOUSAND LITERS) 2020-2029
LIST OF FIGURES
FIGURE 1 MARKET DYNAMICS
FIGURE 2 MARKET SEGMENTATION
FIGURE 3 REPORT TIMELINES: YEARS CONSIDERED
FIGURE 4 DATA TRIANGULATION
FIGURE 5 BOTTOM-UP APPROACH
FIGURE 6 TOP-DOWN APPROACH
FIGURE 7 RESEARCH FLOW
FIGURE 8 GLOBAL GLUFOSINATE MARKET BY CROP TYPE, USD BILLION, 2020-2029
FIGURE 9 GLOBAL GLUFOSINATE MARKET BY FORMULATION TYPE, USD BILLION, 2020-2029
FIGURE 10 GLOBAL GLUFOSINATE MARKET BY APPLICATION, USD BILLION, 2020-2029
FIGURE 11 GLOBAL GLUFOSINATE MARKET BY REGION, USD BILLION, 2020-2029
FIGURE 12 PORTER’S FIVE FORCES MODEL
FIGURE 13 GLOBAL GLUFOSINATE MARKET BY CROP TYPE, USD BILLION, 2021
FIGURE 14 GLOBAL GLUFOSINATE MARKET BY FORMULATION TYPE, USD BILLION, 2021
FIGURE 15 GLOBAL GLUFOSINATE MARKET BY APPLICATION, USD BILLION, 2021
FIGURE 16 GLOBAL GLUFOSINATE MARKET BY REGION, USD BILLION 2021
FIGURE 17 MARKET SHARE ANALYSIS
FIGURE 18 NUFARM LTD: COMPANY SNAPSHOT
FIGURE 19 JIANGSU HUANGMA AGROCHEMICALS CO, LTD.: COMPANY SNAPSHOT
FIGURE 20 JIANGSU SEVENCONTINENT GREEN CHEMICAL CO., LTD.: COMPANY SNAPSHOT
FIGURE 21 HEBEI VEYONG BIO-CHEMICAL CO., LTD.: COMPANY SNAPSHOT
FIGURE 22 ZHEJIANG YONGNONG CHEM. IND. CO. LTD.: COMPANY SNAPSHOT
FIGURE 23 BAYER AG: COMPANY SNAPSHOT
FIGURE 24 LIMIN CHEMICAL CO., LTD: COMPANY SNAPSHOT
FIGURE 25 UPL LIMITED: COMPANY SNAPSHOT
FIGURE 26 LIER CHEMICAL CO., LTD.: COMPANY SNAPSHOT
FIGURE 27 SINOHARVEST CORPORATION: COMPANY SNAPSHOT
FIGURE 28 DUPONT DE NEMOURS: COMPANY SNAPSHOT
DOWNLOAD FREE SAMPLE REPORT
License Type
SPEAK WITH OUR ANALYST
Want to know more about the report or any specific requirement?
WANT TO CUSTOMIZE THE REPORT?
Our Clients Speak
We asked them to research ‘ Equipment market’ all over the world, and their whole arrangement was helpful to us. thehealthanalytics.com insightful analysis and reports contributed to our current analysis and in creating a future strategy. Besides, the te
Yosuke Mitsui
Senior Associate Construction Equipment Sales & Marketing
We asked them to research ‘Equipment market’ all over the world, and their whole arrangement was helpful to us. thehealthanalytics.com insightful analysis and reports contributed to our current analysis and in creating a future strategy. Besides, the te


