

Base Year Value ()
x.x %
x.x %
CAGR ()
x.x %
x.x %
Forecast Year Value ()
x.x %
x.x %
Historical Data Period
Largest Region
Forecast Period
제공(하드웨어, 소프트웨어, 서비스)별 무선 디스플레이 시장 최종 사용(주거용, 상업용) 기술(Airplay, Miracast, Google Cast, 기타) 지역별 글로벌 추세 및 2022년부터 2029년까지의 예측
Instant access to hundreds of data points and trends
- Market estimates from 2014-2029
- Competitive analysis, industry segmentation, financial benchmarks
- Incorporates SWOT, Porter's Five Forces and risk management frameworks
- PDF report or online database with Word, Excel and PowerPoint export options
- 100% money back guarantee
무선 디스플레이 시장 개요
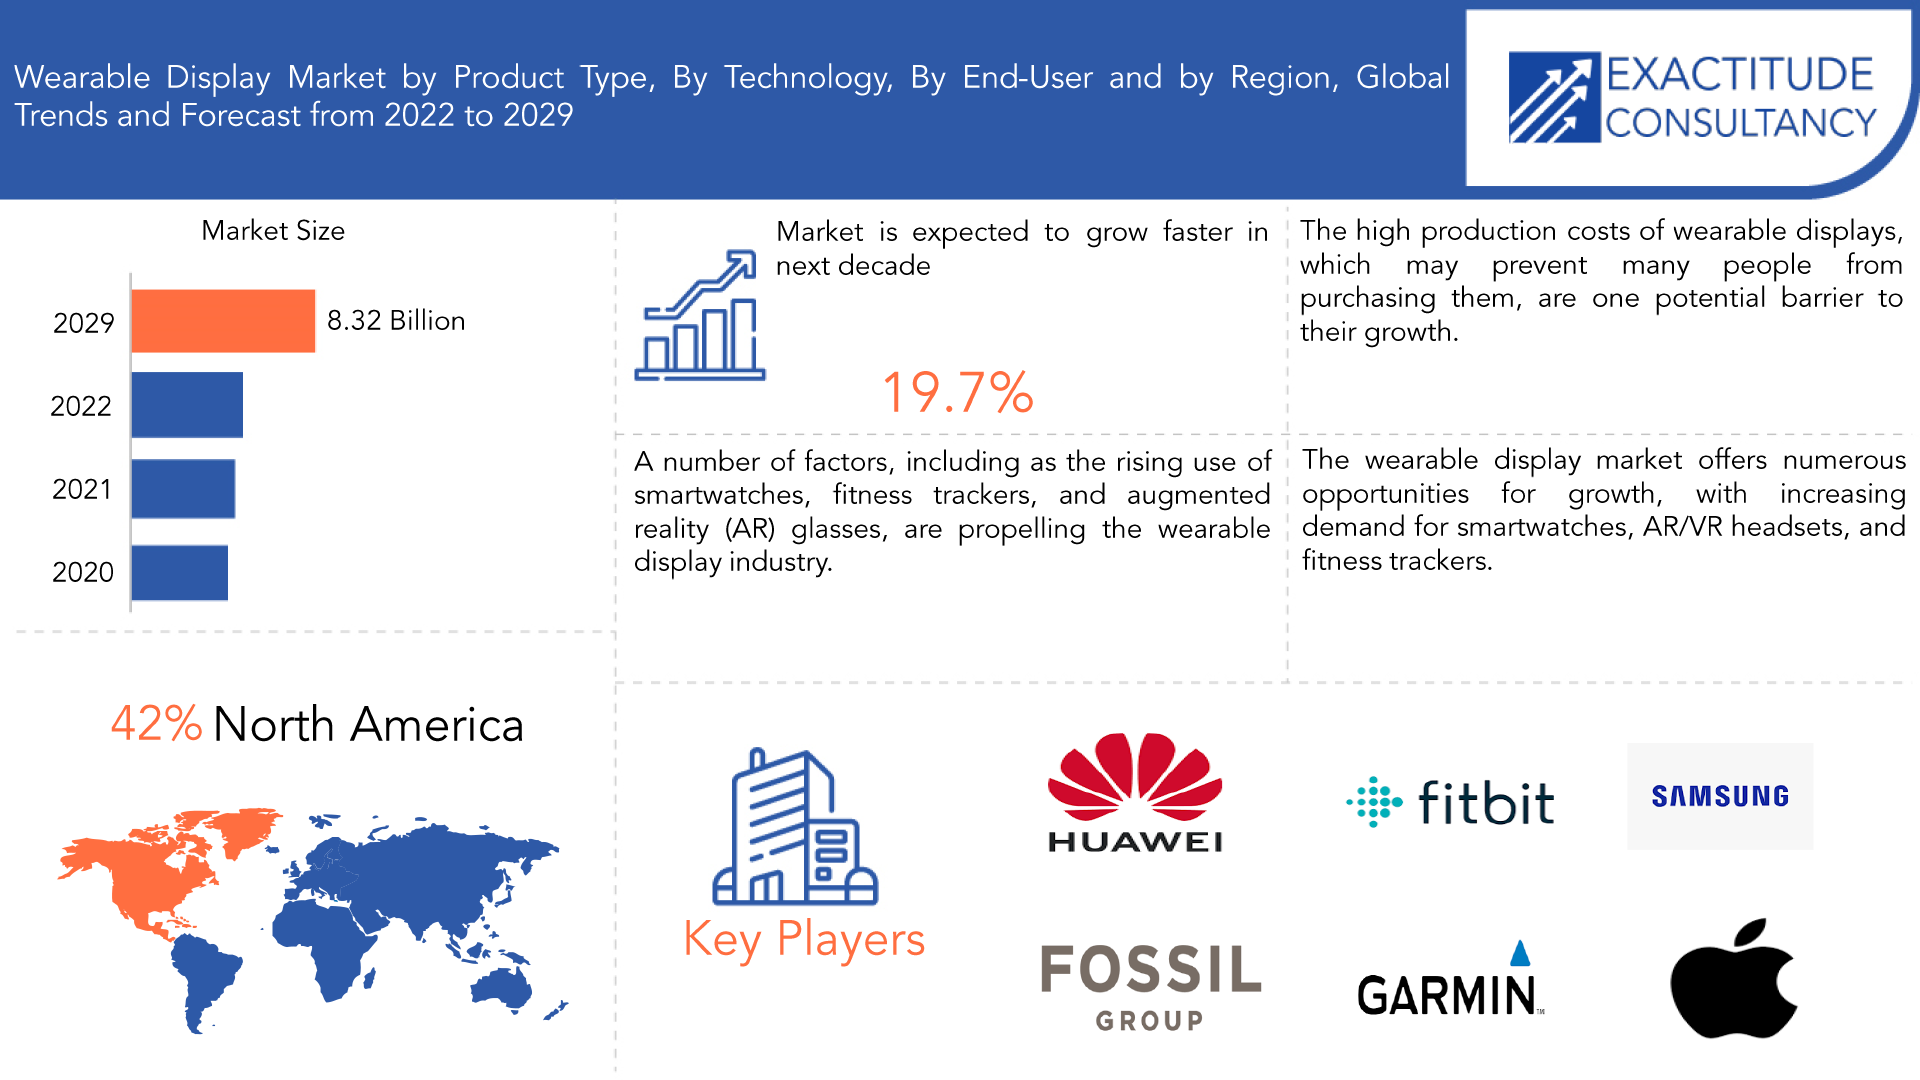
글로벌 무선 디스플레이 시장 규모는 2020년에 38억 3천만 달러로 평가되었으며, 2029년까지 100억 4천만 달러에 도달할 것으로 예상되며, 2022년에서 2029년까지 연평균 성장률은 11.3%입니다.
무선 디스플레이 기술은 무선 설정에서 스마트 기기와 비즈니스 사용자에게 무선 디스플레이 기능을 제공하는 무선 디스플레이 공유 기술입니다. 스마트 기기용 무선 디스플레이 어댑터로 알려진 칩에는 무선 디스플레이 기술이 내장되어 있습니다. 이 디스플레이 어댑터 사용자는 화면을 미러링하여 노트북이나 휴대전화 화면에 있는 모든 것을 볼 수 있습니다. 태블릿과 스마트폰용 화면은 무선 디스플레이 기술을 사용합니다. 최대 1080p 해상도를 처리할 수 있는 사용자의 텔레비전에서는 무선으로 표시되었습니다.
무선 디스플레이 표준은 사용자의 스마트폰이나 휴대용 태블릿 기기의 Wi-Fi 네트워킹 기술을 코드 없이 거실의 TV에 무선으로 표시할 수 있도록 합니다. 사용자는 무선 디스플레이 기술을 사용하여 스마트폰 기기에서 무선으로 인터넷을 탐색하거나 서핑하고, HD 영화를 보고, 슬라이드쇼를 TV에서 볼 수 있습니다. 이렇게 하면 유선 통신이 필요하지 않습니다. 유선 HDMI 또는 오디오 비디오 케이블 통신을 사용함으로써 사용자는 TV에 표시하기 위해 전선이 필요했습니다.
| 기인하다 | 세부 |
| 학습 기간 | 2020-2029 |
| 기준년도 | 2021 |
| 추정 연도 | 2022 |
| 예상 연도 | 2022-2029 |
| 역사적 기간 | 2018-2020 |
| 단위 | 가치(10억 달러) |
| 분할 | 제공별, 최종 용도별, 기술별, 지역별. |
| 제공함으로써 |
|
| 최종 사용에 따라 |
|
| 기술로 |
|
| 지역별로 |
|
자료를 공유하거나 표시할 때 무선 디스플레이 시스템은 코드의 필요성을 없애 사용자에게 더 많은 자유와 편의성을 제공합니다. 원격 및 하이브리드 작업의 확대 추세, 교육 및 비즈니스 부문에서 디지털 협업 도구에 대한 필요성, 스마트 홈 및 스마트 가젯에 대한 수요 증가가 시장의 주요 원동력입니다. 5G 기술의 구현, 신선하고 최첨단 무선 디스플레이 기술의 창출, 여러 산업에서 무선 디스플레이 솔루션에 대한 수요 증가로 인해 향후 몇 년 동안 시장이 확대될 것으로 예상됩니다. 그러나 시장은 호환성 문제, 지연 문제, 보안 문제 및 제한된 범위를 포함한 어려움에 직면합니다.
태블릿, 스마트폰, 노트북, 스마트 TV를 포함한 다양한 애플리케이션에서 기술 개발과 수용 증가가 시장 수익 성장을 촉진할 것으로 예상됩니다. 무선 디스플레이 시장은 소비자 애플리케이션을 위한 OTT(Over-The-Top) 기반 콘텐츠의 가용성 증가에 의해 주도되고 있습니다. 간편한 설정과 회의실 설정에 소요되는 시간 단축을 통해 달성할 수 있는 비용 절감은 무선 디스플레이의 기업 애플리케이션 시장을 촉진하는 또 다른 중요한 요소입니다.
전 세계 무선 디스플레이 시장의 확장은 저렴한 대체품의 가용성과 높은 생산 비용으로 인해 상당히 제한을 받고 있습니다. 글로벌 무선 디스플레이 시장의 성장을 방해하는 주요 이유 중 하나는 USB 및 HDMI와 같은 유선 연결 기술의 낮은 비용입니다. 제조 비용 상승과 기술 프로토콜 호환성 부족은 예상 기간 동안 시장 확장을 제한할 것으로 예상되는 다른 요인입니다.
여러 정부가 신흥국에서 디지털 멀티미디어 기기의 도입을 촉진하기 위한 계획을 수립하고 조치를 취하고 있습니다. 향후 몇 년 동안 은행, 소매, 정부 및 DOOH 부문의 기업이 디지털 사이니지를 더 자주 사용할 것으로 예상됩니다.
무선 디스플레이 산업은 제한된 범위, 지연 문제, 보안 문제, 장치 호환성 문제와 같은 여러 가지 어려움에 직면해 있습니다. 다양한 장치에서 사용하는 서로 다른 무선 프로토콜은 호환성 문제, 통신 문제, 추가 장비 또는 어댑터 필요성을 일으킬 수 있습니다. 사용자 경험은 지연 문제로 인해 영향을 받을 수 있으며, 이는 자료 스트리밍을 지연시킬 수 있습니다. 무선으로 전송되는 민감한 데이터는 가로채고 해킹할 수 있기 때문에 보안 문제를 일으킵니다. 무선 디스플레이 솔루션 공급업체는 이러한 어려움을 해결하기 위해 원활한 연결, 최소 지연, 강력한 보안, 장거리를 갖춘 최첨단 기술을 계속 개발해야 합니다.
[캡션 id="attachment_22419" 정렬="정렬센터" 너비="1920"]
Frequently Asked Questions
What is the worth of wireless display market?
The wireless display market is expected to reach USD 5.28 billion by the end of 2023.
What are the upcoming trends of wireless display market globally?
The adoption of 5G technology is the ongoing trend observed.
What is the CAGR of wireless display market?
The global wireless display market size was valued at USD 3.83 billion in 2020, and projected to reach USD 10.04 billion by 2029, with a CAGR of 11.3% from 2022 to 2029.
Which are the top companies to hold the market share in wireless display market?
The global market is fragmented in nature with the presence of various key players such Sony Corporation, LG Electronics, Samsung Electronics Co., Ltd., NVIDIA Corporation, Rockchip Electronics Co., Ltd., Marvell Technology Inc., Panasonic Holding Corporation, Squirrels LLC, Microsoft Corporation, Netgear Inc., Cavium Inc., Belkin International Inc.
Which is the largest regional market for wireless display market?
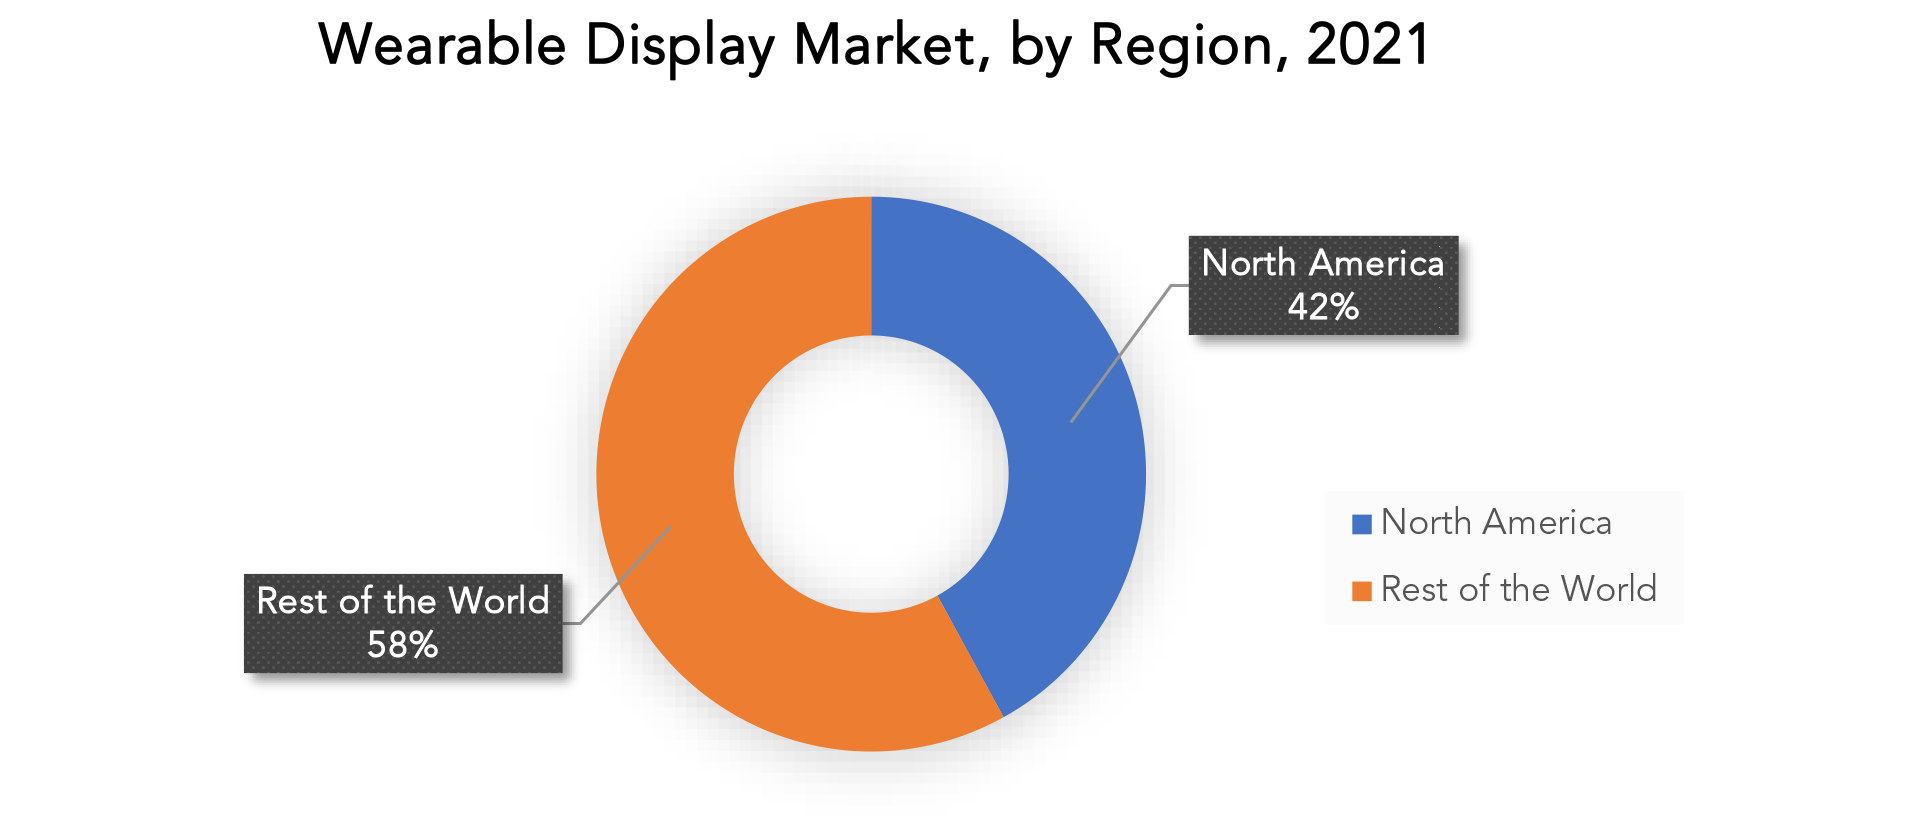
The North America dominated the global industry in 2021 and accounted for the maximum share of more than 40% of the overall revenue.
Wireless Display Market Segment Analysis
The market has been divided into hardware and software and services as a result of offerings. Companies are concentrating on improving display device features since hardware is the main element of a wireless display setup. Over 57.0% of the market's entire revenue in 2021 came from the hardware sector. The affordability of a variety of devices, including adapters, dongles, and other streaming devices, has helped the market expand.
The worldwide wireless display market is divided into residential and commercial segments based on the kind of application. Due to rising demand for wireless displays for broadcasting and advertising in industries including the public sector, healthcare, and educational institutions, the commercial segment had the greatest revenue share in 2021. Businesses looking to boost consumer interaction have found wireless digital signage to be more successful.
Over the projected period, the Google Cast sector is anticipated to have the greatest CAGR, at around 12.0%. Customers choose inexpensive, readily accessible gadgets since they may be used for a variety of purposes, including gaming, business, and personal. Better interoperability between low-cost consumer electronics and different resolution systems, such as low, HD, and Ultra-HD systems, is made possible by Google Cast. In the upcoming years, these advantages should help the industry flourish.
[caption id="attachment_22427" align="aligncenter" width="1920"]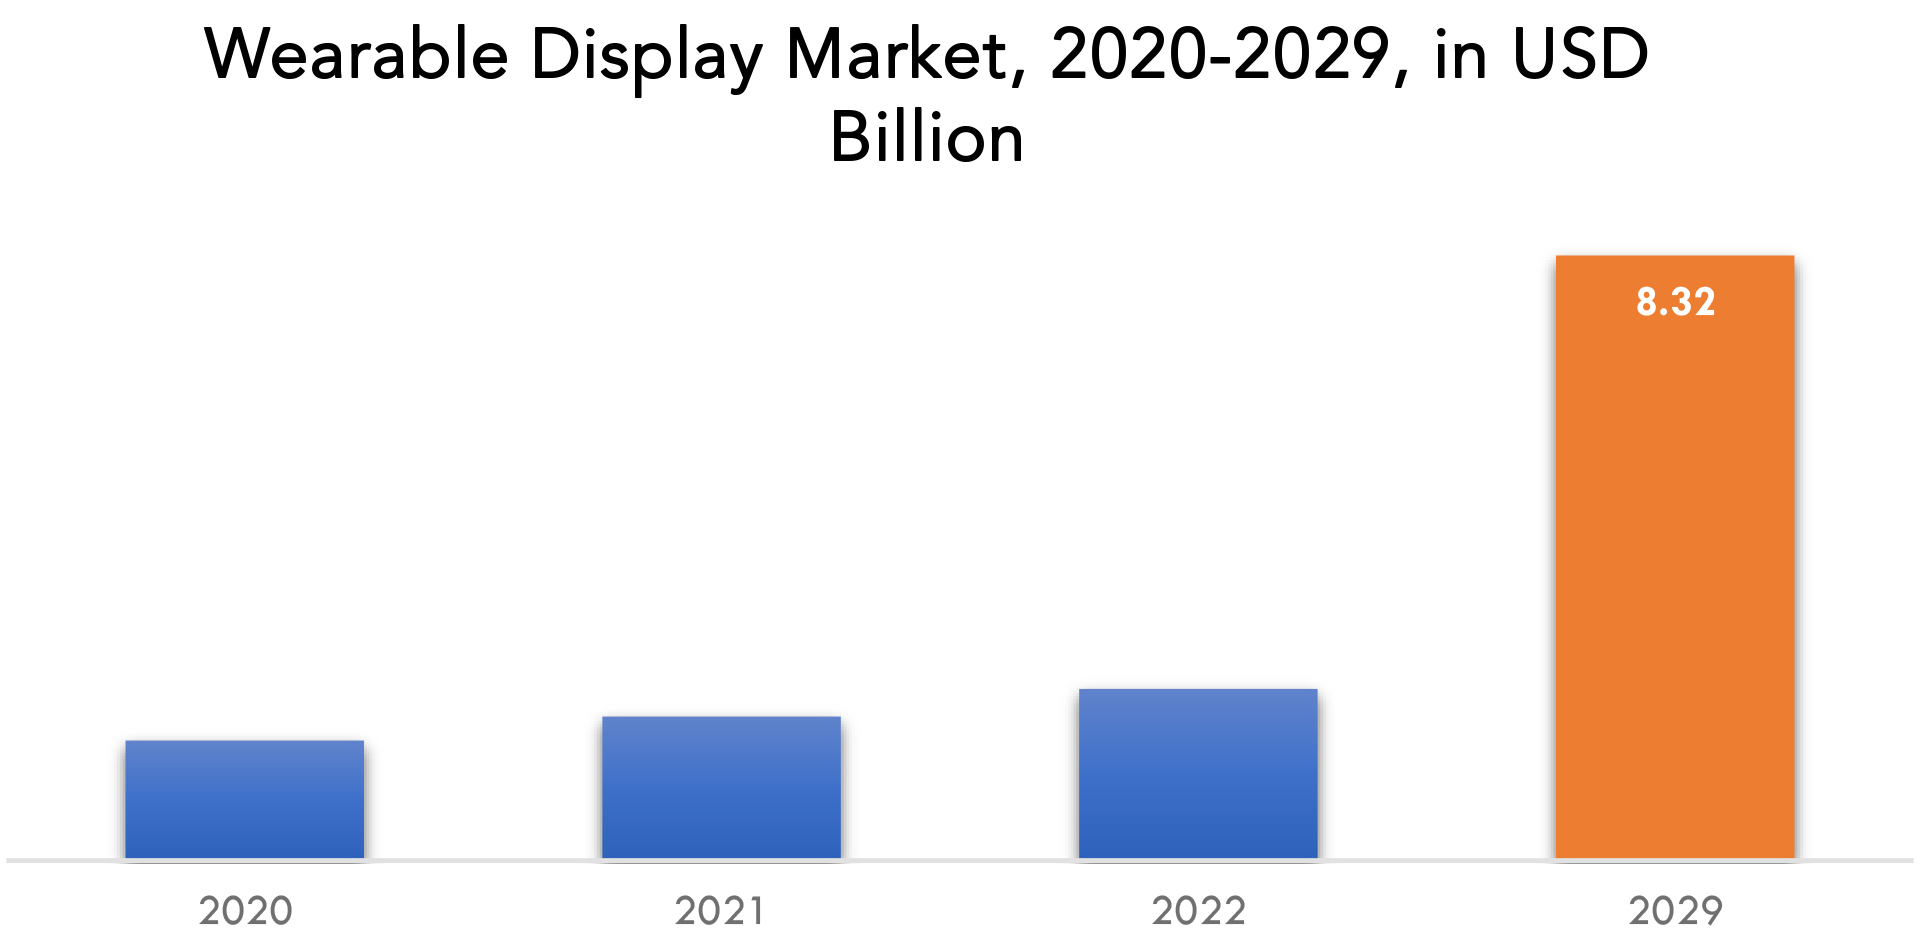
Wireless Display Market Players
The global market is fragmented in nature with the presence of various key players such as Sony Corporation, LG Electronics, Samsung Electronics Co., Ltd., NVIDIA Corporation, Rockchip Electronics Co., Ltd., Marvell Technology Inc., Panasonic Holding Corporation, Squirrels LLC, Microsoft Corporation, Netgear Inc., Cavium Inc., Belkin International Inc. along with medium and small-scale regional players operating in different parts of the world. Major companies in the market compete in terms of application development capability, product launches, and development of new technologies for product formulation. Industrial Development: April 18, 2023 - The inauguration of Dubai's newest ultra-luxury experience resort, Atlantis the Royal, was scheduled for 2023. By offering guests experiences that are unparalleled and enhanced by cutting-edge display technology from Samsung Electronics, Atlantis the Royal upped the bar for all other resorts. January 4, 2023 - The world's first consumer TV using Zero Connect1 technology, a wireless system capable of real-time video and audio transmission at up to 4K 120Hz, was unveiled by LG Electronics as a 97-inch LG SIGNATURE OLED M (model M3).Who Should Buy? Or Key stakeholders
- Retailers
- E-commerce platforms
- Wireless display product developers
- Original device manufacturers (ODM)
- End-users
- Research institutes
- Government bodies
- Market researchers
- Enterprise data center professionals
Wireless Display Market Regional Analysis
Geographically, the wireless display market is segmented into North America, South America, Europe, APAC and MEA.- North America: includes the US, Canada, Mexico
- Europe: includes UK, Germany, France, Italy, Spain, Russia, and Rest of Europe
- Asia Pacific: includes China, Japan, South Korea, India, Australia, ASEAN and Rest of APAC
- South America: includes Brazil, Argentina and Rest of South America
- Middle East & Africa: includes Turkey, UAE, Saudi Arabia, South Africa, and Rest of MEA
Key Market Segments: Wireless Display Market
Wireless Display Market by Offering, 2020-2029, (USD Billion)- Hardware
- Software
- Services
- Residential
- Commercial
- Airplay
- Miracast
- Google Cast
- Others
- North America
- Europe
- Asia Pacific
- South America
- Middle East and Africa
Exactitude Consultancy Services Key Objectives:
- Increasing sales and market share
- Developing new technology
- Improving profitability
- Entering new markets
- Enhancing brand reputation
Key Question Answered
- What is the expected growth rate of the wireless display market over the next 7 years?
- Who are the major players in the wireless display market and what is their market share?
- What are the end-user industries driving demand for market and what is their outlook?
- What are the opportunities for growth in emerging markets such as Asia-Pacific, Middle East, and Africa?
- How is the economic environment affecting the wireless display market, including factors such as interest rates, inflation, and exchange rates?
- What is the expected impact of government policies and regulations on wireless display market?
- What is the current and forecasted size and growth rate of the global wireless display market?
- What are the key drivers of growth in the wireless display market?
- Who are the major players in the market and what is their market share?
- What are the distribution channels and supply chain dynamics in the wireless display market?
- What are the technological advancements and innovations in the wireless display market and their impact on product development and growth?
- What are the regulatory considerations and their impact on the market?
- What are the challenges faced by players in the wireless display market and how are they addressing these challenges?
- What are the opportunities for growth and expansion in the wireless display market?
- What are the service offerings and specifications of leading players in the market?
- 소개
- 시장 정의
- 시장 세분화
- 연구 일정
- 가정 및 제한
- 연구 방법론
- 데이터 마이닝
- 2차 연구
- 1차 연구
- 주제별 전문가의 조언
- 품질 검사
- 최종 검토
- 데이터 삼각 측량
- 바텀업 방식
- 탑다운 접근 방식
- 연구 흐름
- 데이터 소스
- 데이터 마이닝
- 요약
- 시장 개요
- 무선 디스플레이 시장 전망
- 시장 동인
- 시장 제약
- 시장 기회
- COVID-19가 무선 디스플레이 시장 에 미치는 영향
- 포터의 5가지 힘 모델
- 신규 진입자의 위협
- 대체품으로부터의 위협
- 공급업체의 협상력
- 고객의 협상력
- 경쟁의 정도
- 산업 가치 사슬 분석
- 무선 디스플레이 시장 전망
- 제공별 글로벌 무선 디스플레이 시장, 2020-2029, (USD 십억)
- 하드웨어
- 소프트웨어
- 서비스
- 최종 사용 기준 글로벌 무선 디스플레이 시장, 2020-2029, (USD 십억)
- 주거용
- COMMERCIAL
- GLOBAL WIRELESS DISPLAY MARKET BY TECHNOLOGY, 2020-2029, (USD BILLION)
- AIRPLAY
- MIRACAST
- GOOGLE CAST
- OTHERS
- GLOBAL WIRELESS DISPLAY MARKET BY REGION, 2020-2029, (USD BILLION)
- NORTH AMERICA
- US
- CANADA
- MEXICO
- SOUTH AMERICA
- BRAZIL
- ARGENTINA
- COLOMBIA
- REST OF SOUTH AMERICA
- EUROPE
- GERMANY
- UK
- FRANCE
- ITALY
- SPAIN
- RUSSIA
- REST OF EUROPE
- ASIA PACIFIC
- INDIA
- CHINA
- JAPAN
- SOUTH KOREA
- AUSTRALIA
- SOUTH-EAST ASIA
- REST OF ASIA PACIFIC
- MIDDLE EAST AND AFRICA
- UAE
- SAUDI ARABIA
- SOUTH AFRICA
- REST OF MIDDLE EAST AND AFRICA
- NORTH AMERICA
- COMPANY PROFILES*
(BUSINESS OVERVIEW, COMPANY SNAPSHOT, PRODUCTS OFFERED, RECENT DEVELOPMENTS)
9.1 SONY CORPORATION
9.2 LG ELECTRONICS
9.3 SAMSUNG ELECTRONICS CO., LTD.
9.4 NVIDIA CORPORATION
9.5 ROCKCHIP ELECTRONICS CO., LTD.
9.6 MARVELL TECHNOLOGY, INC.
9.7 PANASONIC HOLDING CORPORATION
9.8 SQUIRRELS LLC
9.9 MICROSOFT CORPORATION
9.10 NETGEAR INC.
9.11 CAVIUM INC.
9.12 BELKIN INTERNATIONAL INC. *THE COMPANY LIST IS INDICATIVE
LIST OF TABLES
TABLE 1 GLOBAL WIRELESS DISPLAY MARKET BY OFFERING (USD BILLION) 2020-2029
TABLE 2 GLOBAL WIRELESS DISPLAY MARKET BY END USE (USD BILLION) 2020-2029
TABLE 3 GLOBAL WIRELESS DISPLAY MARKET BY TECHNOLOGY (USD BILLION) 2020-2029
TABLE 4 GLOBAL WIRELESS DISPLAY MARKET BY REGIONS (USD BILLION) 2020-2029
TABLE 5 NORTH AMERICA WIRELESS DISPLAY MARKET BY OFFERING (USD BILLION) 2020-2029
TABLE 6 NORTH AMERICA WIRELESS DISPLAY MARKET BY END USE (USD BILLION) 2020-2029
TABLE 7 NORTH AMERICA WIRELESS DISPLAY MARKET BY TECHNOLOGY (USD BILLION) 2020-2029
TABLE 8 NORTH AMERICA WIRELESS DISPLAY MARKET BY COUNTRY (USD BILLION) 2020-2029
TABLE 9 US WIRELESS DISPLAY MARKET BY OFFERING (USD BILLION) 2020-2029
TABLE 10 US WIRELESS DISPLAY MARKET BY END USE (USD BILLION) 2020-2029
TABLE 11 US WIRELESS DISPLAY MARKET BY TECHNOLOGY (USD BILLION) 2020-2029
TABLE 12 US WIRELESS DISPLAY MARKET BY REGIONS (USD BILLION) 2020-2029
TABLE 13 CANADA WIRELESS DISPLAY MARKET BY OFFERING (USD BILLION) 2020-2029
TABLE 14 CANADA WIRELESS DISPLAY MARKET BY END USE (USD BILLION) 2020-2029
TABLE 15 CANADA WIRELESS DISPLAY MARKET BY TECHNOLOGY (USD BILLION) 2020-2029
TABLE 16 CANADA WIRELESS DISPLAY MARKET BY REGIONS (USD BILLION) 2020-2029
TABLE 17 MEXICO WIRELESS DISPLAY MARKET BY OFFERING (USD BILLION) 2020-2029
TABLE 18 MEXICO WIRELESS DISPLAY MARKET BY END USE (USD BILLION) 2020-2029
TABLE 19 MEXICO WIRELESS DISPLAY MARKET BY TECHNOLOGY (USD BILLION) 2020-2029
TABLE 20 MEXICO WIRELESS DISPLAY MARKET BY REGIONS (USD BILLION) 2020-2029
TABLE 21 SOUTH AMERICA WIRELESS DISPLAY MARKET BY OFFERING (USD BILLION) 2020-2029
TABLE 22 SOUTH AMERICA WIRELESS DISPLAY MARKET BY END USE (USD BILLION) 2020-2029
TABLE 23 SOUTH AMERICA WIRELESS DISPLAY MARKET BY TECHNOLOGY (USD BILLION) 2020-2029
TABLE 24 SOUTH AMERICA WIRELESS DISPLAY MARKET BY COUNTRY (USD BILLION) 2020-2029
TABLE 25 BRAZIL WIRELESS DISPLAY MARKET BY OFFERING (USD BILLION) 2020-2029
TABLE 26 BRAZIL WIRELESS DISPLAY MARKET BY END USE (USD BILLION) 2020-2029
TABLE 27 BRAZIL WIRELESS DISPLAY MARKET BY TECHNOLOGY (USD BILLION) 2020-2029
TABLE 28 BRAZIL WIRELESS DISPLAY MARKET BY REGIONS (USD BILLION) 2020-2029
TABLE 29 ARGENTINA WIRELESS DISPLAY MARKET BY OFFERING (USD BILLION) 2020-2029
TABLE 30 ARGENTINA WIRELESS DISPLAY MARKET BY END USE (USD BILLION) 2020-2029
TABLE 31 ARGENTINA WIRELESS DISPLAY MARKET BY TECHNOLOGY (USD BILLION) 2020-2029
TABLE 32 ARGENTINA WIRELESS DISPLAY MARKET BY REGIONS (USD BILLION) 2020-2029
TABLE 33 COLOMBIA WIRELESS DISPLAY MARKET BY OFFERING (USD BILLION) 2020-2029
TABLE 34 COLOMBIA WIRELESS DISPLAY MARKET BY END USE (USD BILLION) 2020-2029
TABLE 35 COLOMBIA WIRELESS DISPLAY MARKET BY TECHNOLOGY (USD BILLION) 2020-2029
TABLE 36 COLOMBIA WIRELESS DISPLAY MARKET BY REGIONS (USD BILLION) 2020-2029
TABLE 37 REST OF SOUTH AMERICA WIRELESS DISPLAY MARKET BY OFFERING (USD BILLION) 2020-2029
TABLE 38 REST OF SOUTH AMERICA WIRELESS DISPLAY MARKET BY END USE (USD BILLION) 2020-2029
TABLE 39 REST OF SOUTH AMERICA WIRELESS DISPLAY MARKET BY TECHNOLOGY (USD BILLION) 2020-2029
TABLE 40 REST OF SOUTH AMERICA WIRELESS DISPLAY MARKET BY REGIONS (USD BILLION) 2020-2029
TABLE 41 ASIA-PACIFIC WIRELESS DISPLAY MARKET BY OFFERING (USD BILLION) 2020-2029
TABLE 42 ASIA-PACIFIC WIRELESS DISPLAY MARKET BY END USE (USD BILLION) 2020-2029
TABLE 43 ASIA-PACIFIC WIRELESS DISPLAY MARKET BY TECHNOLOGY (USD BILLION) 2020-2029
TABLE 44 ASIA-PACIFIC WIRELESS DISPLAY MARKET BY COUNTRY (USD BILLION) 2020-2029
TABLE 45 INDIA WIRELESS DISPLAY MARKET BY OFFERING (USD BILLION) 2020-2029
TABLE 46 INDIA WIRELESS DISPLAY MARKET BY END USE (USD BILLION) 2020-2029
TABLE 47 INDIA WIRELESS DISPLAY MARKET BY TECHNOLOGY (USD BILLION) 2020-2029
TABLE 48 INDIA WIRELESS DISPLAY MARKET BY REGIONS (USD BILLION) 2020-2029
TABLE 49 CHINA WIRELESS DISPLAY MARKET BY OFFERING (USD BILLION) 2020-2029
TABLE 50 CHINA WIRELESS DISPLAY MARKET BY END USE (USD BILLION) 2020-2029
TABLE 51 CHINA WIRELESS DISPLAY MARKET BY TECHNOLOGY (USD BILLION) 2020-2029
TABLE 52 CHINA WIRELESS DISPLAY MARKET BY REGIONS (USD BILLION) 2020-2029
TABLE 53 JAPAN WIRELESS DISPLAY MARKET BY OFFERING (USD BILLION) 2020-2029
TABLE 54 JAPAN WIRELESS DISPLAY MARKET BY END USE (USD BILLION) 2020-2029
TABLE 55 JAPAN WIRELESS DISPLAY MARKET BY TECHNOLOGY (USD BILLION) 2020-2029
TABLE 56 JAPAN WIRELESS DISPLAY MARKET BY REGIONS (USD BILLION) 2020-2029
TABLE 57 SOUTH KOREA WIRELESS DISPLAY MARKET BY OFFERING (USD BILLION) 2020-2029
TABLE 58 SOUTH KOREA WIRELESS DISPLAY MARKET BY END USE (USD BILLION) 2020-2029
TABLE 59 SOUTH KOREA WIRELESS DISPLAY MARKET BY TECHNOLOGY (USD BILLION) 2020-2029
TABLE 60 SOUTH KOREA WIRELESS DISPLAY MARKET BY REGIONS (USD BILLION) 2020-2029
TABLE 61 AUSTRALIA WIRELESS DISPLAY MARKET BY OFFERING (USD BILLION) 2020-2029
TABLE 62 AUSTRALIA WIRELESS DISPLAY MARKET BY END USE (USD BILLION) 2020-2029
TABLE 63 AUSTRALIA WIRELESS DISPLAY MARKET BY TECHNOLOGY (USD BILLION) 2020-2029
TABLE 64 AUSTRALIA WIRELESS DISPLAY MARKET BY REGIONS (USD BILLION) 2020-2029
TABLE 65 SOUTH-EAST ASIA WIRELESS DISPLAY MARKET BY OFFERING (USD BILLION) 2020-2029
TABLE 66 SOUTH-EAST ASIA WIRELESS DISPLAY MARKET BY END USE (USD BILLION) 2020-2029
TABLE 67 SOUTH-EAST ASIA WIRELESS DISPLAY MARKET BY TECHNOLOGY (USD BILLION) 2020-2029
TABLE 68 SOUTH-EAST ASIA WIRELESS DISPLAY MARKET BY REGIONS (USD BILLION) 2020-2029
TABLE 69 REST OF ASIA PACIFIC WIRELESS DISPLAY MARKET BY OFFERING (USD BILLION) 2020-2029
TABLE 70 REST OF ASIA PACIFIC WIRELESS DISPLAY MARKET BY END USE (USD BILLION) 2020-2029
TABLE 71 REST OF ASIA PACIFIC WIRELESS DISPLAY MARKET BY TECHNOLOGY (USD BILLION) 2020-2029
TABLE 72 REST OF ASIA PACIFIC WIRELESS DISPLAY MARKET BY REGIONS (USD BILLION) 2020-2029
TABLE 73 EUROPE WIRELESS DISPLAY MARKET BY OFFERING (USD BILLION) 2020-2029
TABLE 74 EUROPE WIRELESS DISPLAY MARKET BY END USE (USD BILLION) 2020-2029
TABLE 75 EUROPE WIRELESS DISPLAY MARKET BY TECHNOLOGY (USD BILLION) 2020-2029
TABLE 76 EUROPE WIRELESS DISPLAY MARKET BY COUNTRY (USD BILLION) 2020-2029
TABLE 77 GERMANY WIRELESS DISPLAY MARKET BY OFFERING (USD BILLION) 2020-2029
TABLE 78 GERMANY WIRELESS DISPLAY MARKET BY END USE (USD BILLION) 2020-2029
TABLE 79 GERMANY WIRELESS DISPLAY MARKET BY TECHNOLOGY (USD BILLION) 2020-2029
TABLE 80 GERMANY WIRELESS DISPLAY MARKET BY REGIONS (USD BILLION) 2020-2029
TABLE 81 UK WIRELESS DISPLAY MARKET BY OFFERING (USD BILLION) 2020-2029
TABLE 82 UK WIRELESS DISPLAY MARKET BY END USE (USD BILLION) 2020-2029
TABLE 83 UK WIRELESS DISPLAY MARKET BY TECHNOLOGY (USD BILLION) 2020-2029
TABLE 84 UK WIRELESS DISPLAY MARKET BY REGIONS (USD BILLION) 2020-2029
TABLE 85 FRANCE WIRELESS DISPLAY MARKET BY OFFERING (USD BILLION) 2020-2029
TABLE 86 FRANCE WIRELESS DISPLAY MARKET BY END USE (USD BILLION) 2020-2029
TABLE 87 FRANCE WIRELESS DISPLAY MARKET BY TECHNOLOGY (USD BILLION) 2020-2029
TABLE 88 FRANCE WIRELESS DISPLAY MARKET BY REGIONS (USD BILLION) 2020-2029
TABLE 89 ITALY WIRELESS DISPLAY MARKET BY OFFERING (USD BILLION) 2020-2029
TABLE 90 ITALY WIRELESS DISPLAY MARKET BY END USE (USD BILLION) 2020-2029
TABLE 91 ITALY WIRELESS DISPLAY MARKET BY TECHNOLOGY (USD BILLION) 2020-2029
TABLE 92 ITALY WIRELESS DISPLAY MARKET BY REGIONS (USD BILLION) 2020-2029
TABLE 93 SPAIN WIRELESS DISPLAY MARKET BY OFFERING (USD BILLION) 2020-2029
TABLE 94 SPAIN WIRELESS DISPLAY MARKET BY END USE (USD BILLION) 2020-2029
TABLE 95 SPAIN WIRELESS DISPLAY MARKET BY TECHNOLOGY (USD BILLION) 2020-2029
TABLE 96 SPAIN WIRELESS DISPLAY MARKET BY REGIONS (USD BILLION) 2020-2029
TABLE 97 RUSSIA WIRELESS DISPLAY MARKET BY OFFERING (USD BILLION) 2020-2029
TABLE 98 RUSSIA WIRELESS DISPLAY MARKET BY END USE (USD BILLION) 2020-2029
TABLE 99 RUSSIA WIRELESS DISPLAY MARKET BY TECHNOLOGY (USD BILLION) 2020-2029
TABLE 100 RUSSIA WIRELESS DISPLAY MARKET BY REGIONS (USD BILLION) 2020-2029
TABLE 101 REST OF EUROPE WIRELESS DISPLAY MARKET BY OFFERING (USD BILLION) 2020-2029
TABLE 102 REST OF EUROPE WIRELESS DISPLAY MARKET BY END USE (USD BILLION) 2020-2029
TABLE 103 REST OF EUROPE WIRELESS DISPLAY MARKET BY TECHNOLOGY (USD BILLION) 2020-2029
TABLE 104 REST OF EUROPE WIRELESS DISPLAY MARKET BY REGIONS (USD BILLION) 2020-2029
TABLE 105 MIDDLE EAST AND AFRICA WIRELESS DISPLAY MARKET BY OFFERING (USD BILLION) 2020-2029
TABLE 106 MIDDLE EAST AND AFRICA WIRELESS DISPLAY MARKET BY END USE (USD BILLION) 2020-2029
TABLE 107 MIDDLE EAST AND AFRICA WIRELESS DISPLAY MARKET BY TECHNOLOGY (USD BILLION) 2020-2029
TABLE 108 MIDDLE EAST AND AFRICA WIRELESS DISPLAY MARKET BY COUNTRY (USD BILLION) 2020-2029
TABLE 109 UAE WIRELESS DISPLAY MARKET BY OFFERING (USD BILLION) 2020-2029
TABLE 110 UAE WIRELESS DISPLAY MARKET BY END USE (USD BILLION) 2020-2029
TABLE 111 UAE WIRELESS DISPLAY MARKET BY TECHNOLOGY (USD BILLION) 2020-2029
TABLE 112 UAE WIRELESS DISPLAY MARKET BY REGIONS (USD BILLION) 2020-2029
TABLE 113 SAUDI ARABIA WIRELESS DISPLAY MARKET BY OFFERING (USD BILLION) 2020-2029
TABLE 114 SAUDI ARABIA WIRELESS DISPLAY MARKET BY END USE (USD BILLION) 2020-2029
TABLE 115 SAUDI ARABIA WIRELESS DISPLAY MARKET BY TECHNOLOGY (USD BILLION) 2020-2029
TABLE 116 SAUDI ARABIA WIRELESS DISPLAY MARKET BY REGIONS (USD BILLION) 2020-2029
TABLE 117 SOUTH AFRICA WIRELESS DISPLAY MARKET BY OFFERING (USD BILLION) 2020-2029
TABLE 118 SOUTH AFRICA WIRELESS DISPLAY MARKET BY END USE (USD BILLION) 2020-2029
TABLE 119 SOUTH AFRICA WIRELESS DISPLAY MARKET BY TECHNOLOGY (USD BILLION) 2020-2029
TABLE 120 SOUTH AFRICA WIRELESS DISPLAY MARKET BY REGIONS (USD BILLION) 2020-2029
TABLE 121 REST OF MIDDLE EAST AND AFRICA WIRELESS DISPLAY MARKET BY OFFERING (USD BILLION) 2020-2029
TABLE 122 REST OF MIDDLE EAST AND AFRICA WIRELESS DISPLAY MARKET BY END USE (USD BILLION) 2020-2029
TABLE 123 REST OF MIDDLE EAST AND AFRICA WIRELESS DISPLAY MARKET BY TECHNOLOGY (USD BILLION) 2020-2029
TABLE 124 REST OF MIDDLE EAST AND AFRICA WIRELESS DISPLAY MARKET BY REGIONS (USD BILLION) 2020-2029
LIST OF FIGURES
FIGURE 1 MARKET DYNAMICS
FIGURE 2 MARKET SEGMENTATION
FIGURE 3 REPORT TIMELINES: YEARS CONSIDERED
FIGURE 4 DATA TRIANGULATION
FIGURE 5 BOTTOM-UP APPROACH
FIGURE 6 TOP-DOWN APPROACH
FIGURE 7 RESEARCH FLOW
FIGURE 8 GLOBAL WIRELESS DISPLAY MARKET BY OFFERING (USD BILLION) 2020-2029
FIGURE 9 GLOBAL WIRELESS DISPLAY MARKET BY END USE (USD BILLION) 2020-2029
FIGURE 10 GLOBAL WIRELESS DISPLAY MARKET BY TECHNOLOGY (USD BILLION) 2020-2029
FIGURE 12 GLOBAL WIRELESS DISPLAY MARKET BY REGION (USD BILLION) 2020-2029
FIGURE 13 PORTER’S FIVE FORCES MODEL
FIGURE 14 GLOBAL WIRELESS DISPLAY MARKET BY OFFERING (USD BILLION) 2021
FIGURE 15 GLOBAL WIRELESS DISPLAY MARKET BY END USE (USD BILLION) 2021
FIGURE 16 GLOBAL WIRELESS DISPLAY MARKET BY TECHNOLOGY (USD BILLION) 2021
FIGURE 18 GLOBAL WIRELESS DISPLAY MARKET BY REGION (USD BILLION) 2021
FIGURE 19 NORTH AMERICA WIRELESS DISPLAY MARKET SNAPSHOT
FIGURE 20 EUROPE WIRELESS DISPLAY MARKET SNAPSHOT
FIGURE 21 SOUTH AMERICA WIRELESS DISPLAY MARKET SNAPSHOT
FIGURE 22 ASIA PACIFIC WIRELESS DISPLAY MARKET SNAPSHOT
FIGURE 23 MIDDLE EAST ASIA AND AFRICA WIRELESS DISPLAY MARKET SNAPSHOT
FIGURE 24 MARKET SHARE ANALYSIS
FIGURE 25 SONY CORPORATION: COMPANY SNAPSHOT
FIGURE 26 LG ELECTRONICS: COMPANY SNAPSHOT
FIGURE 27 SAMSUNG ELECTRONICS CO., LTD.: COMPANY SNAPSHOT
FIGURE 28 NVIDIA CORPORATION: COMPANY SNAPSHOT
FIGURE 29 ROCKCHIP ELECTRONICS CO., LTD.: COMPANY SNAPSHOT
FIGURE 30 MARVELL TECHNOLOGY, INC.: COMPANY SNAPSHOT
FIGURE 31 PANASONIC HOLDING CORPORATION: COMPANY SNAPSHOT
FIGURE 32 SQUIRRELS LLC: COMPANY SNAPSHOT
FIGURE 33 MICROSOFT CORPORATION: COMPANY SNAPSHOT
FIGURE 34 NETGEAR INC.: COMPANY SNAPSHOT
FIGURE 35 CAVIUM INC.: COMPANY SNAPSHOT
FIGURE 36 BELKIN INTERNATIONAL INC.: COMPANY SNAPSHOT
DOWNLOAD FREE SAMPLE REPORT
License Type
SPEAK WITH OUR ANALYST
Want to know more about the report or any specific requirement?
WANT TO CUSTOMIZE THE REPORT?
Our Clients Speak
We asked them to research ‘ Equipment market’ all over the world, and their whole arrangement was helpful to us. thehealthanalytics.com insightful analysis and reports contributed to our current analysis and in creating a future strategy. Besides, the te
Yosuke Mitsui
Senior Associate Construction Equipment Sales & Marketing
We asked them to research ‘Equipment market’ all over the world, and their whole arrangement was helpful to us. thehealthanalytics.com insightful analysis and reports contributed to our current analysis and in creating a future strategy. Besides, the te


