

Base Year Value ()
x.x %
x.x %
CAGR ()
x.x %
x.x %
Forecast Year Value ()
x.x %
x.x %
Historical Data Period
Largest Region
Forecast Period
기술별(수요 대응, 분산 발전, 혼합 자산), 최종 사용자별(주거, 상업, 산업) 및 지역별 가상 발전소 시장, 2022년부터 2029년까지의 글로벌 추세 및 예측
Instant access to hundreds of data points and trends
- Market estimates from 2014-2029
- Competitive analysis, industry segmentation, financial benchmarks
- Incorporates SWOT, Porter's Five Forces and risk management frameworks
- PDF report or online database with Word, Excel and PowerPoint export options
- 100% money back guarantee
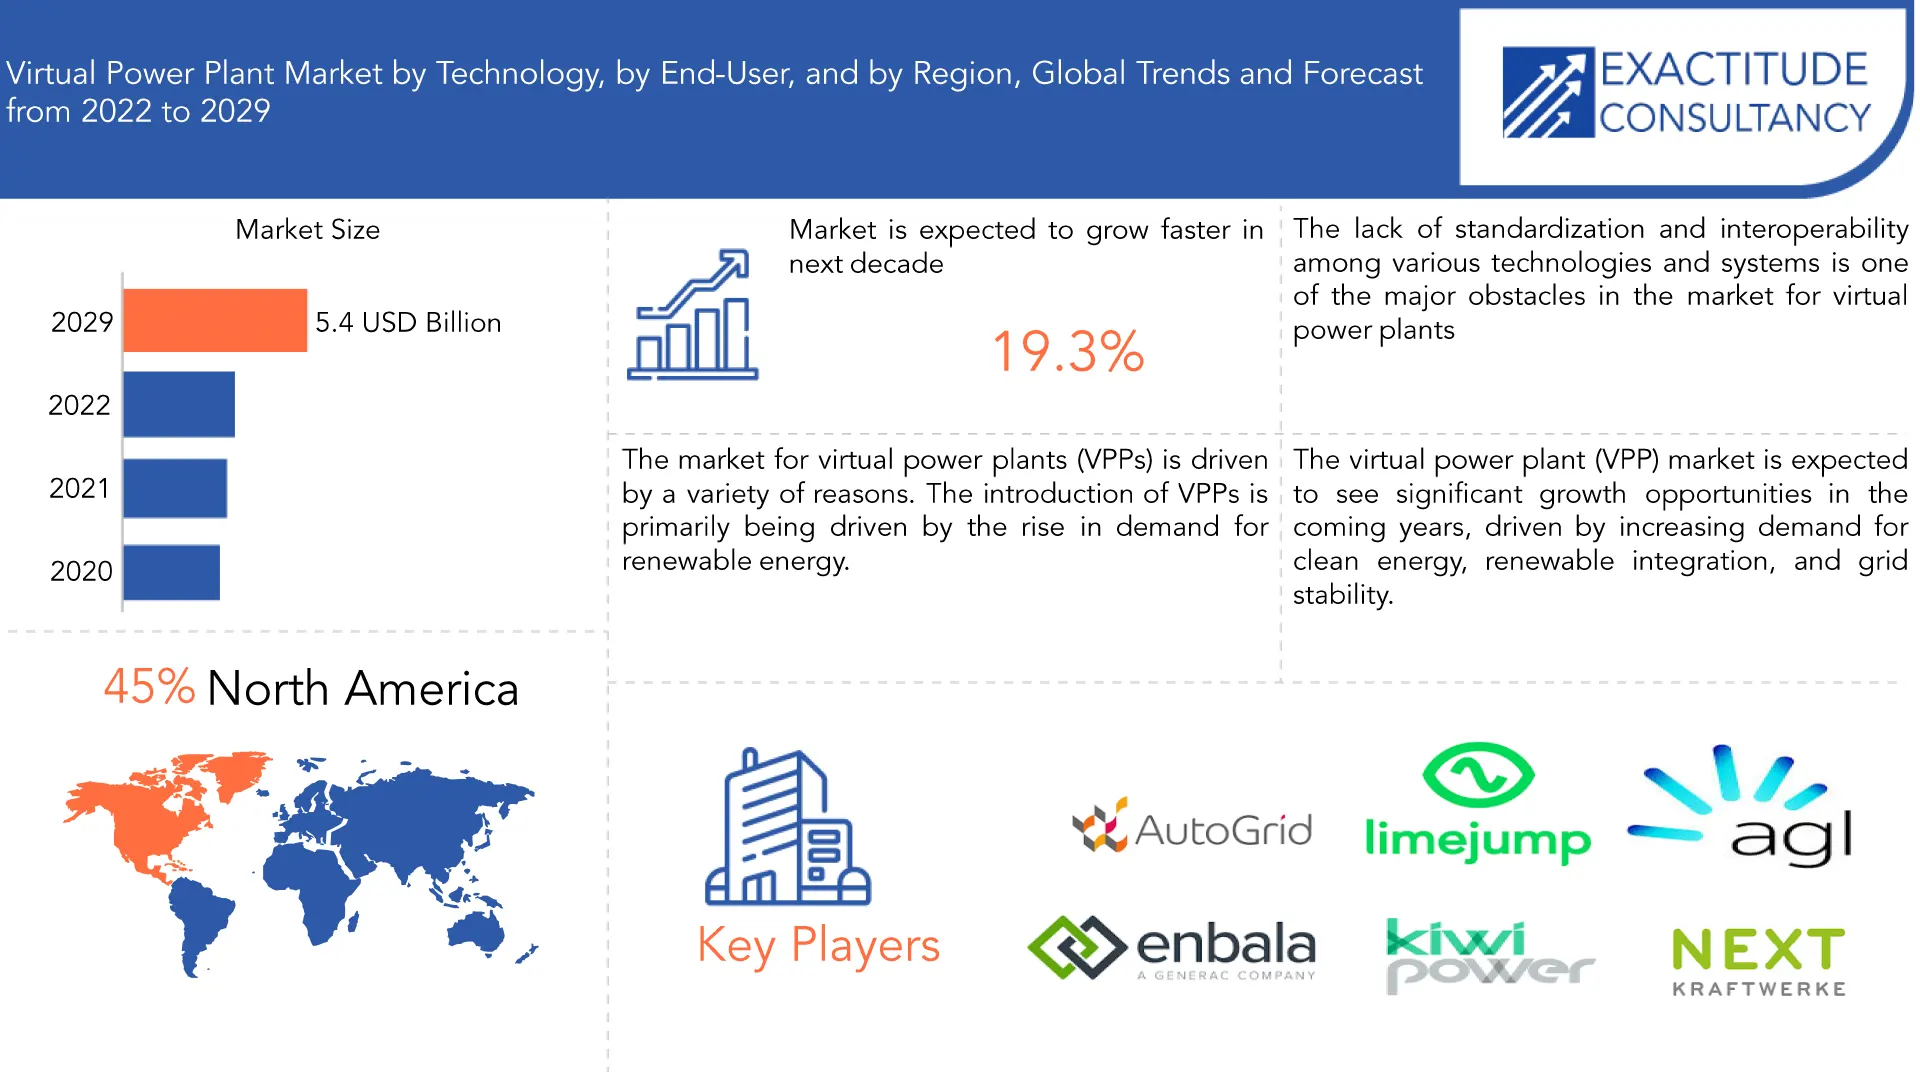
가상 발전소 시장 개요
가상 발전소 시장은 2022년부터 2029년까지 19.3% CAGR로 성장할 것으로 예상됩니다. 2020년 54억 달러에서 2029년까지 11억 달러를 넘어설 것으로 예상됩니다.
중앙 제어 시스템에 연결되어 제어되는 에너지 저장 시스템, 태양광 패널 또는 풍력 터빈 네트워크를 가상 발전소(VPP)라고 합니다. 이러한 분산된 장치에서 생산된 에너지는 VPP에서 수집한 후 이를 다시 그리드 또는 사용자에게 판매할 수 있습니다. 재생 에너지원의 사용을 극대화하고, 기존 중앙 발전소의 필요성을 줄이며, 주파수 조절 및 전압 지원과 같은 그리드 서비스를 제공함으로써 VPP는 전력 시스템의 효율성을 높이는 것을 목표로 합니다.
VPP는 다양한 방식으로 전력망을 개선할 수 있습니다. VPP는 대체 전력원으로 작용하여 그리드의 재생 에너지 통합, 탄소 배출 감소 및 에너지 보안 개선에 기여할 수 있습니다. 보다 적응 가능하고 효과적인 전력 시스템을 제공함으로써 그리드 인프라 에 대한 비용이 많이 드는 수정의 필요성을 낮추는 데 도움이 될 수도 있습니다 . VPP가 전 세계적으로 인기를 얻으면서 점점 더 많은 유틸리티와 에너지 회사가 VPP 프로젝트에 투자하고 있습니다.
| 기인하다 | 세부 |
| 학습 기간 | 2020-2029 |
| 기준년도 | 2021 |
| 추정 연도 | 2022 |
| 예상 연도 | 2022-2029 |
| 역사적 기간 | 2018-2020 |
| 단위 | 가치(10억 달러), (KWh). |
| 분할 | 기술별, 최종 사용자별, 지역별 |
| 기술로 |
|
| 최종 사용자별 |
|
| 지역별로 |
|
가상 발전소(VPP) 시장은 다양한 이유로 인해 주도되고 있습니다. VPP의 도입은 주로 재생 에너지 수요 증가에 의해 주도되고 있습니다. VPP는 점점 더 많은 재생 에너지원이 그리드에 통합됨에 따라 재생 에너지원의 산발적 특성을 규제하고 균형을 맞추는 데 중요한 도구가 되고 있습니다. 풍력 및 태양광과 같은 재생 에너지원은 VPP 덕분에 단일 엔터티로 결합 및 관리될 수 있으며, 이는 신뢰성과 예측 가능성을 높입니다.
전기 자동차, 에너지 저장 장치, 옥상 태양광 패널 과 같은 DER의 활용은 VPP 시장에서 증가하고 있습니다. 이러한 기술은 점점 더 많은 사람과 기업이 채택함에 따라 에너지 믹스의 중요한 구성 요소가 되고 있습니다. 이러한 DER은 VPP의 도움으로 실시간으로 모니터링하고 최적화할 수 있으며, 이를 통해 그리드에 통합하는 데 도움이 될 수 있습니다. 수요 대응 프로그래머와 에너지 시장에 참여함으로써 수요가 많은 기간 동안 그리드의 부하를 줄이고 DER 소유자에게 새로운 수익원을 열어줄 수 있습니다.
가상 발전소(VPP) 시장은 청정 에너지, 재생 에너지 통합, 그리드 안정성에 대한 수요 증가로 인해 향후 몇 년 동안 상당한 성장 기회가 있을 것으로 예상됩니다. VPP는 태양광, 풍력, 저장과 같은 분산 에너지 자원을 통합 네트워크로 통합하여 소비자와 유틸리티 모두에게 유연성과 비용 절감을 제공합니다. 또한 기술 및 규제 프레임워크의 발전으로 전 세계적으로 VPP 시장이 더욱 성장할 것으로 예상됩니다.
다양한 기술과 시스템 간의 표준화 및 상호 운용성의 부족은 가상 발전소 시장에서 주요 장애물 중 하나입니다. 결과적으로 여러 장치가 서로 원활하게 연결되는 데 어려움이 있습니다. 시장 개발은 가상 발전소를 규제하는 명확한 지침 및 규칙의 부족과 같은 규제상의 어려움과 불확실성으로 인해 방해받을 수도 있습니다.
COVID-19 팬데믹이 가상 발전소(VPP) 시장에 미치는 영향은 상충되었습니다. 한편으로는 경기 침체로 인해 에너지 수요가 감소하고 가격이 떨어져 VPP 운영자가 수익을 창출하기가 더 어려워졌습니다. 반대로 팬데믹은 그리드 회복력과 안정성의 가치에 주목하게 되었고, 이는 재생 에너지원을 통합하고 시스템을 균형 잡는 방법으로 VPP에 대한 관심을 높였습니다. 전반적으로 세계 경제가 팬데믹에서 회복됨에 따라 VPP 시장이 확대되고 회복될 것으로 예상됩니다.
[캡션 id="attachment_24155" 정렬="정렬센터" 너비="1920"]
 y
yFrequently Asked Questions
What is the worth of virtual power plant market?
The virtual power plant market is expected to grow at 19.3% CAGR from 2022 to 2029. It is expected to reach above USD 1.1 billion by 2029 from USD 5.4 billion in 2020.
What is the size of the North America virtual power plant industry?
North America held more than 45% of the virtual power plant market revenue share in 2021 and will witness expansion in the forecast period.
What are some of the market's driving forces?
The market for virtual power plants (VPPs) is driven by a variety of reasons. The introduction of VPPs is primarily being driven by the rise in demand for renewable energy. VPPs are turning becoming a crucial instrument for regulating and balancing the sporadic nature of renewable energy sources as more and more of them are integrated into the grid. Renewable energy sources like wind and solar may be combined and managed as a single entity thanks to VPPs, which increases their dependability and predictability.
Which are the top companies to hold the market share in virtual power plant market?
The Virtual Power Plant market key players Next Kraftwreke, Enbala, EnerNOC, Autogrid, Limejump, Sunverge, Kiwi Power, Greensmith Energy, AGL Energy, ABB, Siemens, Tesla, General Electric.
What is the leading technology of virtual power plant market?
Based on technology, the virtual power plant market can be segmented by technology into demand response, distributed generation, and mixed asset VPPs. Demand response VPPs use load curtailment to manage energy demand, while distributed generation VPPs integrate renewable energy sources. Mixed asset VPPs combine both approaches to optimize energy supply and demand.
Which is the largest regional market for virtual power plant market?
The market for virtual power plant in North America is sizable and expanding holds 45% of total market size. The growing need for clean and sustainable energy is likely to drive significant growth in the virtual power plant (VPP) industry in North America over the next several years. Multiple distributed energy resources (DERs) are combined by VPPs into a single, remotely controllable, energy management-optimized system. Government incentives, rising investments in renewable energy sources, and the demand for reliable and stable grids are some of the drivers that are driving the industry. ABB Ltd., General Electric Company, Schneider Electric, and Siemens AG are significant market participants.
Virtual Power Plant Market Segment Analysis
The virtual power plant market is segmented based on technology, end-user and region.
Based on technology, the virtual power plant market can be segmented by technology into demand response, distributed generation, and mixed asset VPPs. Demand response VPPs use load curtailment to manage energy demand, while distributed generation VPPs integrate renewable energy sources. Mixed asset VPPs combine both approaches to optimize energy supply and demand.
By the end-user, the virtual power plant market can be segmented by end user into residential, commercial, and industrial sectors. The residential sector is expected to have the highest growth due to increasing demand for energy management solutions and government initiatives to promote distributed energy resources.
[caption id="attachment_24156" align="aligncenter" width="1920"]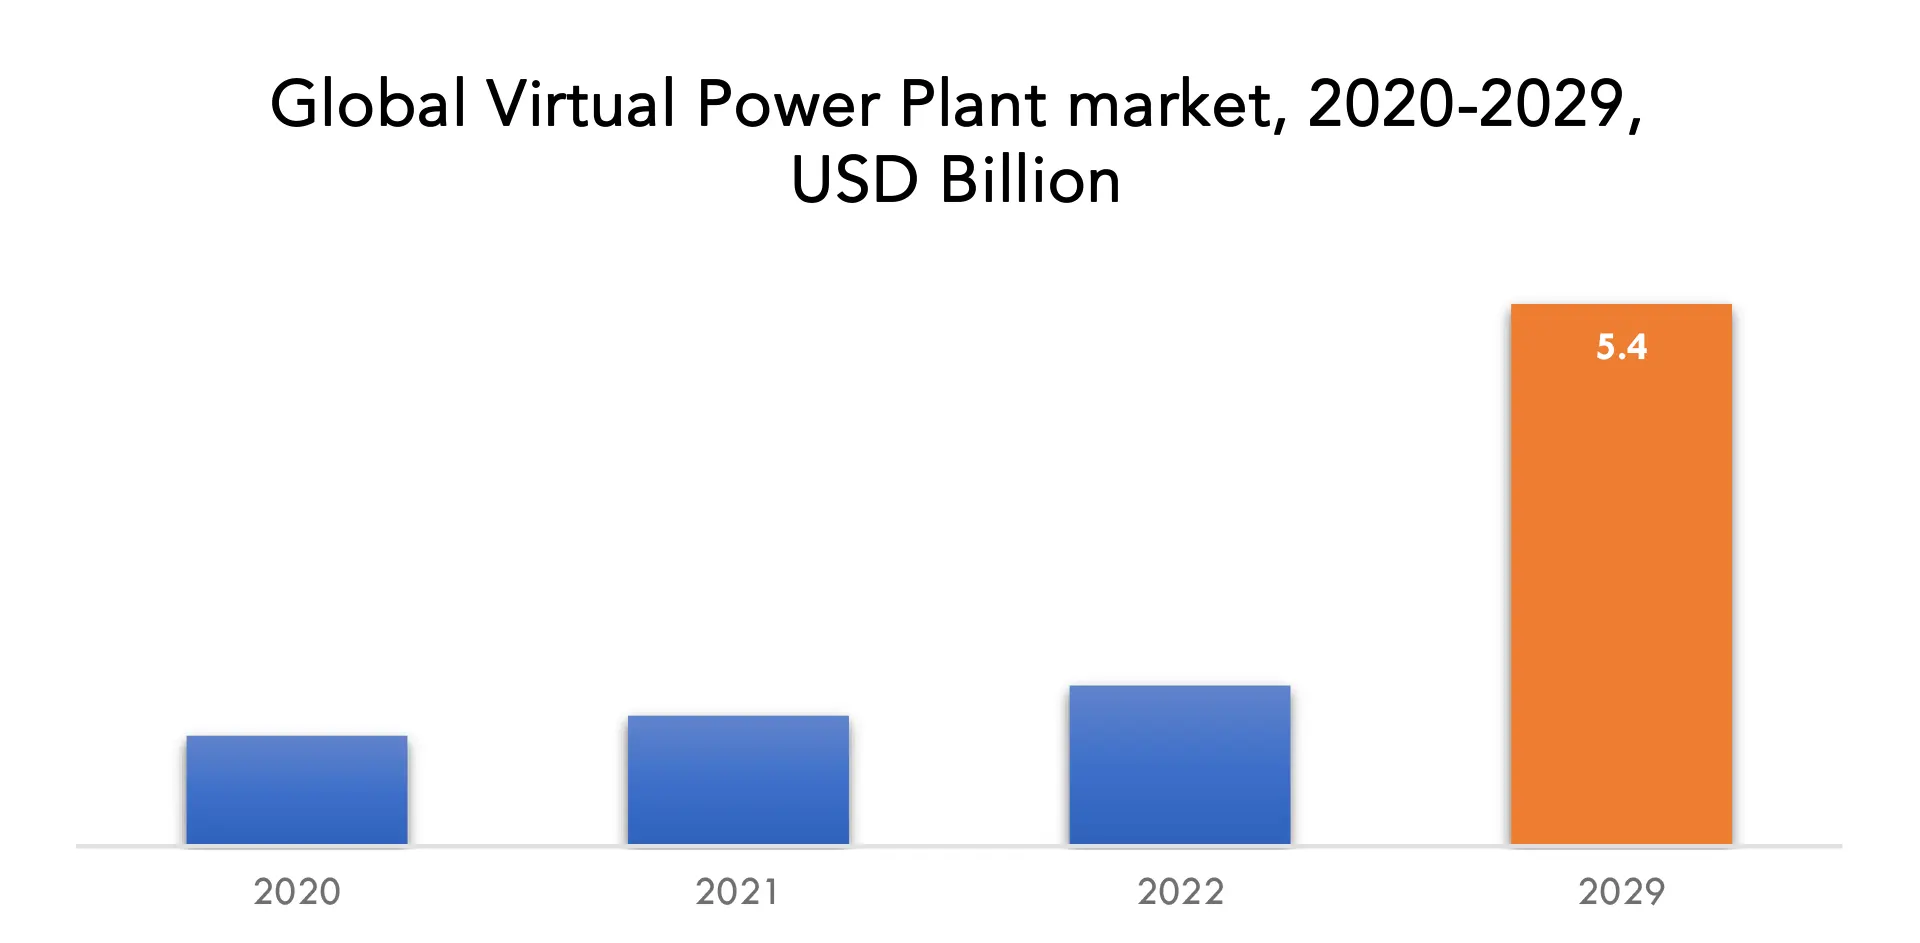
Virtual Power Plant Market Key Players
The Virtual Power Plant market key players Next Kraftwreke, Enbala, EnerNOC, Autogrid, Limejump, Sunverge, Kiwi Power, Greensmith Energy, AGL Energy, ABB, Siemens, Tesla, General Electric.
Industry news: 22-03-2023: - Schneider Electric, the leader in the digital transformation of energy management and industrial automation, broke ground on its new smart factory in Dunavesce, Hungary in the past. With a planned investment of EURO 40 million, the new site was set to span 25,000 m2 and have a headcount of 500 employees. 02-02-2023: Essential Energy partnered with AGL Energy to install its first network battery, which was designed to help improve the reliability of the grid in the Sovereign Hills area of Port Macquarie, New South Wales.Who Should Buy? Or Key stakeholders
- Energy Traders
- Large commercial energy users
- Renewable energy
- Government Agencies
- Power Grid Operates and Utility Companies
- Sport Industry
- Healthcare Industry
Virtual Power Plant Market Regional Analysis
The Virtual Power Plant market by region includes North America, Asia-Pacific (APAC), Europe, South America, and Middle East & Africa (MEA).
- North America: includes the US, Canada, Mexico
- Asia Pacific: includes China, Japan, South Korea, India, Australia, ASEAN and Rest of APAC
- Europe: includes UK, Germany, France, Italy, Spain, Russia, and Rest of Europe
- South America: includes Brazil, Argentina and Rest of South America
- Middle East & Africa: includes Turkey, UAE, Saudi Arabia, South Africa, and Rest of MEA
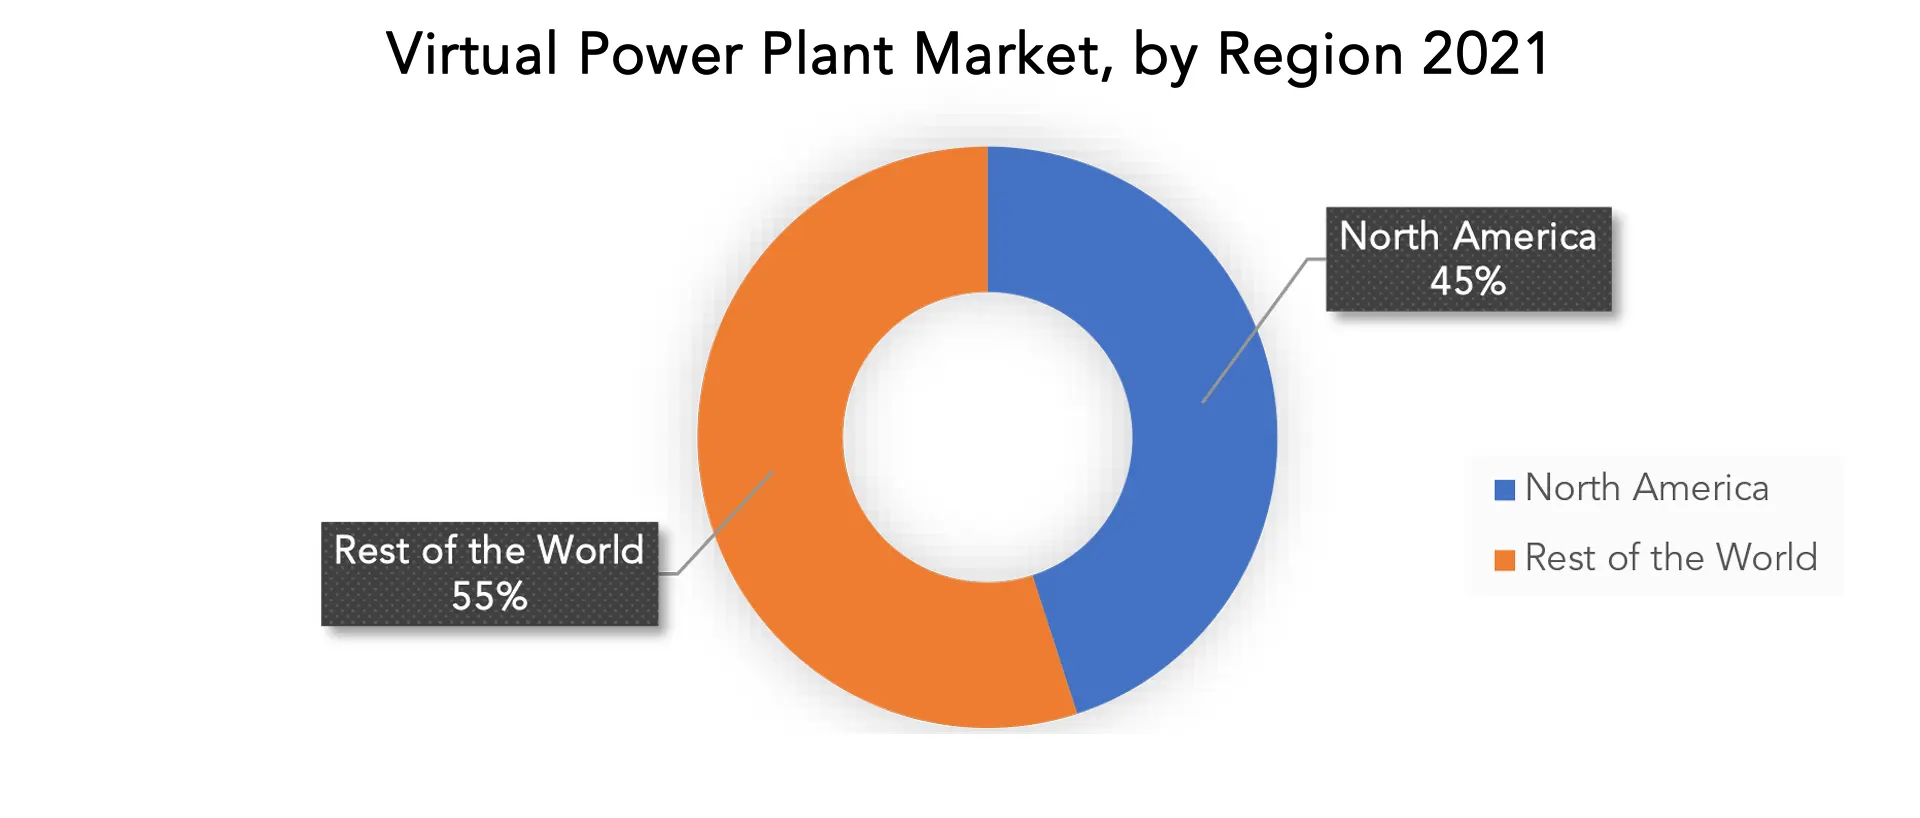
The market for virtual power plant in North America is sizable and expanding holds 45% of total market size. The growing need for clean and sustainable energy is likely to drive significant growth in the virtual power plant (VPP) industry in North America over the next several years. Multiple distributed energy resources (DERs) are combined by VPPs into a single, remotely controllable, energy management-optimized system. Government incentives, rising investments in renewable energy sources, and the demand for reliable and stable grids are some of the drivers that are driving the industry. ABB Ltd., General Electric Company, Schneider Electric, and Siemens AG are significant market participants.
The virtual power plant market in Asia Pacific is expected to grow significantly due to increasing demand for renewable energy, government initiatives to promote clean energy, and the need for efficient energy management systems. The market is also driven by the growing adoption of IoT, big data analytics, and cloud computing technologies.
Key Market Segments: Virtual Power Plant Market
Virtual Power Plant Market by Technology, 2020-2029, (USD Billion), (KWH).- Demand Response
- Distributed Generation
- Mixed Asset
- Residential
- Commercial
- Industrial
- North America
- Asia Pacific
- Europe
- South America
- Middle East and Africa
Exactitude Consultancy Services Key Objectives:
- Increasing sales and market share
- Developing new technology
- Improving profitability
- Entering new markets
- Enhancing brand reputation
Key Question Answered
- What is the expected growth rate of the virtual power plant market over the next 7 years?
- Who are the major players in the virtual power plant market and what is their market share?
- What are the end-user industries driving demand for market and what is their outlook?
- What are the opportunities for growth in emerging markets such as Asia-Pacific, Middle East, And Africa?
- How is the economic environment affecting the virtual power plant market, including factors such as interest rates, inflation, and exchange rates?
- What is the expected impact of government policies and regulations on the virtual power plant market?
- What is the current and forecasted size and growth rate of the global virtual power plant market?
- What are the key drivers of growth in the virtual power plant market?
- What are the distribution channels and supply chain dynamics in the virtual power plant market?
- What are the technological advancements and innovations in the virtual power plant market and their impact on technology development and growth?
- What are the regulatory considerations and their impact on the market?
- What are the challenges faced by players in the virtual power plant market and how are they addressing these challenges?
- What are the opportunities for growth and expansion in the virtual power plant market?
- What are the type offerings and specifications of leading players in the market?
- What is the pricing trend of virtual power plant in the market and what is the impact of raw material prices on the price trend?
- 소개
- 시장 정의
- 시장 세분화
- 연구 일정
- 가정 및 제한
- 연구 방법론
- 데이터 마이닝
- 2차 연구
- 1차 연구
- 주제별 전문가의 조언
- 품질 검사
- 최종 검토
- 데이터 삼각 측량
- 바텀업 방식
- 탑다운 접근 방식
- 연구 흐름
- 데이터 소스
- 데이터 마이닝
- 요약
- 시장 개요
- 글로벌 가상 발전소 시장 전망
- 시장 동인
- 시장 제약
- 시장 기회
- COVID-19가 가상 발전소 시장에 미치는 영향
- 포터의 5가지 힘 모델
- 신규 진입자의 위협
- 대체품으로부터의 위협
- 공급업체의 협상력
- 고객의 협상력
- 경쟁의 정도
- 산업 가치 사슬 분석
- 글로벌 가상 발전소 시장 전망
- GLOBAL VIRTUAL POWER PLANT MARKET BY TECHNOLOGY (USD BILLION, KWH)
- DEMAND RESPONSE
- DISTRIBUTED GENERATION
- MIXED ASSET
- GLOBAL VIRTUAL POWER PLANT MARKET BY END-USER (USD BILLION, KWH)
- RESIDENTIAL
- COMMERCIAL
- INDUSTRIAL
- GLOBAL VIRTUAL POWER PLANT MARKET BY REGION (USD BILLION, KWH)
- NORTH AMERICA
- US
- CANADA
- MEXICO
- SOUTH AMERICA
- BRAZIL
- ARGENTINA
- COLOMBIA
- REST OF SOUTH AMERICA
- EUROPE
- GERMANY
- UK
- FRANCE
- ITALY
- SPAIN
- RUSSIA
- REST OF EUROPE
- ASIA PACIFIC
- INDIA
- CHINA
- JAPAN
- SOUTH KOREA
- AUSTRALIA
- SOUTH-EAST ASIA
- REST OF ASIA PACIFIC
- MIDDLE EAST AND AFRICA
- UAE
- SAUDI ARABIA
- SOUTH AFRICA
- REST OF MIDDLE EAST AND AFRICA
- NORTH AMERICA
- COMPANY PROFILES* (BUSINESS OVERVIEW, COMPANY SNAPSHOT, PRODUCTS OFFERED, RECENT DEVELOPMENTS)
- NEXT KRAFTWERK
- ENBALA
- ENERNOC
- AUTO GRID
- LIME JUMP
- KIWI POWER
- GREEN SMITH ENERGY
- AGL ENERGY
- ABB
- SIEMENS
- TESLA
- GENERAL ELECTRIC *THE COMPANY LIST IS INDICATIVE
LIST OF TABLES
TABLE 1 GLOBAL VIRTUAL POWER PLANT MARKET BY TECHNOLOGY (USD BILLION), 2020-2029
TABLE 2 GLOBAL VIRTUAL POWER PLANT MARKET BY TECHNOLOGY (KWH), 2020-2029
TABLE 3 GLOBAL VIRTUAL POWER PLANT MARKET BY END-USER (USD BILLION), 2020-2029
TABLE 4 GLOBAL VIRTUAL POWER PLANT MARKET BY END-USER (KWH), 2020-2029
TABLE 5 GLOBAL VIRTUAL POWER PLANT MARKET BY REGION (USD BILLION), 2020-2029
TABLE 6 GLOBAL VIRTUAL POWER PLANT MARKET BY REGION (KWH), 2020-2029
TABLE 7 NORTH AMERICA VIRTUAL POWER PLANT MARKET BY TECHNOLOGY (USD BILLION), 2020-2029
TABLE 8 NORTH AMERICA VIRTUAL POWER PLANT MARKET BY TECHNOLOGY (KWH), 2020-2029
TABLE 9 NORTH AMERICA VIRTUAL POWER PLANT MARKET BY END-USER (USD BILLION), 2020-2029
TABLE 10 NORTH AMERICA VIRTUAL POWER PLANT MARKET BY END-USER (KWH), 2020-2029
TABLE 11 NORTH AMERICA VIRTUAL POWER PLANT MARKET BY COUNTRY (USD BILLION), 2020-2029
TABLE 12 NORTH AMERICA VIRTUAL POWER PLANT MARKET BY COUNTRY (KWH), 2020-2029
TABLE 13 US VIRTUAL POWER PLANT MARKET BY TECHNOLOGY (USD BILLION), 2020-2029
TABLE 14 US VIRTUAL POWER PLANT MARKET BY TECHNOLOGY (KWH), 2020-2029
TABLE 15 US VIRTUAL POWER PLANT MARKET BY END-USER (USD BILLION), 2020-2029
TABLE 16 US VIRTUAL POWER PLANT MARKET BY END-USER (KWH), 2020-2029
TABLE 17 CANADA VIRTUAL POWER PLANT MARKET BY TECHNOLOGY (USD BILLION), 2020-2029
TABLE 18 CANADA VIRTUAL POWER PLANT MARKET BY TECHNOLOGY (KWH), 2020-2029
TABLE 19 CANADA VIRTUAL POWER PLANT MARKET BY END-USER (USD BILLION), 2020-2029
TABLE 20 CANADA VIRTUAL POWER PLANT MARKET BY END-USER (KWH), 2020-2029
TABLE 21 MEXICO VIRTUAL POWER PLANT MARKET BY TECHNOLOGY (USD BILLION), 2020-2029
TABLE 22 MEXICO VIRTUAL POWER PLANT MARKET BY TECHNOLOGY (KWH), 2020-2029
TABLE 23 MEXICO VIRTUAL POWER PLANT MARKET BY END-USER (USD BILLION), 2020-2029
TABLE 24 MEXICO VIRTUAL POWER PLANT MARKET BY END-USER (KWH), 2020-2029
TABLE 25 SOUTH AMERICA VIRTUAL POWER PLANT MARKET BY TECHNOLOGY (USD BILLION), 2020-2029
TABLE 26 SOUTH AMERICA VIRTUAL POWER PLANT MARKET BY TECHNOLOGY (KWH), 2020-2029
TABLE 27 SOUTH AMERICA VIRTUAL POWER PLANT MARKET BY END-USER (USD BILLION), 2020-2029
TABLE 28 SOUTH AMERICA VIRTUAL POWER PLANT MARKET BY END-USER (KWH), 2020-2029
TABLE 29 SOUTH AMERICA VIRTUAL POWER PLANT MARKET BY COUNTRY (USD BILLION), 2020-2029
TABLE 30 SOUTH AMERICA VIRTUAL POWER PLANT MARKET BY COUNTRY (KWH), 2020-2029
TABLE 31 BRAZIL VIRTUAL POWER PLANT MARKET BY TECHNOLOGY (USD BILLION), 2020-2029
TABLE 32 BRAZIL VIRTUAL POWER PLANT MARKET BY TECHNOLOGY (KWH), 2020-2029
TABLE 33 BRAZIL VIRTUAL POWER PLANT MARKET BY END-USER (USD BILLION), 2020-2029
TABLE 34 BRAZIL VIRTUAL POWER PLANT MARKET BY END-USER (KWH), 2020-2029
TABLE 35 ARGENTINA VIRTUAL POWER PLANT MARKET BY TECHNOLOGY (USD BILLION), 2020-2029
TABLE 36 ARGENTINA VIRTUAL POWER PLANT MARKET BY TECHNOLOGY (KWH), 2020-2029
TABLE 37 ARGENTINA VIRTUAL POWER PLANT MARKET BY END-USER (USD BILLION), 2020-2029
TABLE 38 ARGENTINA VIRTUAL POWER PLANT MARKET BY END-USER (KWH), 2020-2029
TABLE 39 COLOMBIA VIRTUAL POWER PLANT MARKET BY TECHNOLOGY (USD BILLION), 2020-2029
TABLE 40 COLOMBIA VIRTUAL POWER PLANT MARKET BY TECHNOLOGY (KWH), 2020-2029
TABLE 41 COLOMBIA VIRTUAL POWER PLANT MARKET BY END-USER (USD BILLION), 2020-2029
TABLE 42 COLOMBIA VIRTUAL POWER PLANT MARKET BY END-USER (KWH), 2020-2029
TABLE 43 REST OF SOUTH AMERICA VIRTUAL POWER PLANT MARKET BY TECHNOLOGY (USD BILLION), 2020-2029
TABLE 44 REST OF SOUTH AMERICA VIRTUAL POWER PLANT MARKET BY TECHNOLOGY (KWH), 2020-2029
TABLE 45 REST OF SOUTH AMERICA VIRTUAL POWER PLANT MARKET BY END-USER (USD BILLION), 2020-2029
TABLE 46 REST OF SOUTH AMERICA VIRTUAL POWER PLANT MARKET BY END-USER (KWH), 2020-2029
TABLE 47 ASIA-PACIFIC VIRTUAL POWER PLANT MARKET BY TECHNOLOGY (USD BILLION), 2020-2029
TABLE 48 ASIA-PACIFIC VIRTUAL POWER PLANT MARKET BY TECHNOLOGY (KWH), 2020-2029
TABLE 49 ASIA-PACIFIC VIRTUAL POWER PLANT MARKET BY END-USER (USD BILLION), 2020-2029
TABLE 50 ASIA-PACIFIC VIRTUAL POWER PLANT MARKET BY END-USER (KWH), 2020-2029
TABLE 51 ASIA-PACIFIC VIRTUAL POWER PLANT MARKET BY COUNTRY (USD BILLION), 2020-2029
TABLE 52 ASIA-PACIFIC VIRTUAL POWER PLANT MARKET BY COUNTRY (KWH), 2020-2029
TABLE 53 INDIA VIRTUAL POWER PLANT MARKET BY TECHNOLOGY (USD BILLION), 2020-2029
TABLE 54 INDIA VIRTUAL POWER PLANT MARKET BY TECHNOLOGY (KWH), 2020-2029
TABLE 55 INDIA VIRTUAL POWER PLANT MARKET BY END-USER (USD BILLION), 2020-2029
TABLE 56 INDIA VIRTUAL POWER PLANT MARKET BY END-USER (KWH), 2020-2029
TABLE 57 CHINA VIRTUAL POWER PLANT MARKET BY TECHNOLOGY (USD BILLION), 2020-2029
TABLE 58 CHINA VIRTUAL POWER PLANT MARKET BY TECHNOLOGY (KWH), 2020-2029
TABLE 59 CHINA VIRTUAL POWER PLANT MARKET BY END-USER (USD BILLION), 2020-2029
TABLE 60 CHINA VIRTUAL POWER PLANT MARKET BY END-USER (KWH), 2020-2029
TABLE 61 JAPAN VIRTUAL POWER PLANT MARKET BY TECHNOLOGY (USD BILLION), 2020-2029
TABLE 62 JAPAN VIRTUAL POWER PLANT MARKET BY TECHNOLOGY (KWH), 2020-2029
TABLE 63 JAPAN VIRTUAL POWER PLANT MARKET BY END-USER (USD BILLION), 2020-2029
TABLE 64 JAPAN VIRTUAL POWER PLANT MARKET BY END-USER (KWH), 2020-2029
TABLE 65 SOUTH KOREA VIRTUAL POWER PLANT MARKET BY TECHNOLOGY (USD BILLION), 2020-2029
TABLE 66 SOUTH KOREA VIRTUAL POWER PLANT MARKET BY TECHNOLOGY (KWH), 2020-2029
TABLE 67 SOUTH KOREA VIRTUAL POWER PLANT MARKET BY END-USER (USD BILLION), 2020-2029
TABLE 68 SOUTH KOREA VIRTUAL POWER PLANT MARKET BY END-USER (KWH), 2020-2029
TABLE 69 AUSTRALIA VIRTUAL POWER PLANT MARKET BY TECHNOLOGY (USD BILLION), 2020-2029
TABLE 70 AUSTRALIA VIRTUAL POWER PLANT MARKET BY TECHNOLOGY (KWH), 2020-2029
TABLE 71 AUSTRALIA VIRTUAL POWER PLANT MARKET BY END-USER (USD BILLION), 2020-2029
TABLE 72 AUSTRALIA VIRTUAL POWER PLANT MARKET BY END-USER (KWH), 2020-2029
TABLE 73 SOUTH EAST ASIA VIRTUAL POWER PLANT MARKET BY TECHNOLOGY (USD BILLION), 2020-2029
TABLE 74 SOUTH EAST ASIA VIRTUAL POWER PLANT MARKET BY TECHNOLOGY (KWH), 2020-2029
TABLE 75 SOUTH EAST ASIA VIRTUAL POWER PLANT MARKET BY END-USER (USD BILLION), 2020-2029
TABLE 76 SOUTH EAST ASIA VIRTUAL POWER PLANT MARKET BY END-USER (KWH), 2020-2029
TABLE 77 REST OF ASIA PACIFIC VIRTUAL POWER PLANT MARKET BY TECHNOLOGY (USD BILLION), 2020-2029
TABLE 78 REST OF ASIA PACIFIC VIRTUAL POWER PLANT MARKET BY TECHNOLOGY (KWH), 2020-2029
TABLE 79 REST OF ASIA PACIFIC VIRTUAL POWER PLANT MARKET BY END-USER (USD BILLION), 2020-2029
TABLE 80 REST OF ASIA PACIFIC VIRTUAL POWER PLANT MARKET BY END-USER (KWH), 2020-2029
TABLE 81 EUROPE VIRTUAL POWER PLANT MARKET BY TECHNOLOGY (USD BILLION), 2020-2029
TABLE 82 EUROPE VIRTUAL POWER PLANT MARKET BY TECHNOLOGY (KWH), 2020-2029
TABLE 83 EUROPE VIRTUAL POWER PLANT MARKET BY END-USER (USD BILLION), 2020-2029
TABLE 84 EUROPE VIRTUAL POWER PLANT MARKET BY END-USER (KWH), 2020-2029
TABLE 85 EUROPE VIRTUAL POWER PLANT MARKET BY COUNTRY (USD BILLION), 2020-2029
TABLE 86 EUROPE VIRTUAL POWER PLANT MARKET BY COUNTRY (KWH), 2020-2029
TABLE 87 GERMANY VIRTUAL POWER PLANT MARKET BY TECHNOLOGY (USD BILLION), 2020-2029
TABLE 88 GERMANY VIRTUAL POWER PLANT MARKET BY TECHNOLOGY (KWH), 2020-2029
TABLE 89 GERMANY VIRTUAL POWER PLANT MARKET BY END-USER (USD BILLION), 2020-2029
TABLE 90 GERMANY VIRTUAL POWER PLANT MARKET BY END-USER (KWH), 2020-2029
TABLE 91 UK VIRTUAL POWER PLANT MARKET BY TECHNOLOGY (USD BILLION), 2020-2029
TABLE 92 UK VIRTUAL POWER PLANT MARKET BY TECHNOLOGY (KWH), 2020-2029
TABLE 93 UK VIRTUAL POWER PLANT MARKET BY END-USER (USD BILLION), 2020-2029
TABLE 94 UK VIRTUAL POWER PLANT MARKET BY END-USER (KWH), 2020-2029
TABLE 95 FRANCE VIRTUAL POWER PLANT MARKET BY TECHNOLOGY (USD BILLION), 2020-2029
TABLE 96 FRANCE VIRTUAL POWER PLANT MARKET BY TECHNOLOGY (KWH), 2020-2029
TABLE 97 FRANCE VIRTUAL POWER PLANT MARKET BY END-USER (USD BILLION), 2020-2029
TABLE 98 FRANCE VIRTUAL POWER PLANT MARKET BY END-USER (KWH), 2020-2029
TABLE 99 ITALY VIRTUAL POWER PLANT MARKET BY TECHNOLOGY (USD BILLION), 2020-2029
TABLE 100 ITALY VIRTUAL POWER PLANT MARKET BY TECHNOLOGY (KWH), 2020-2029
TABLE 101 ITALY VIRTUAL POWER PLANT MARKET BY END-USER (USD BILLION), 2020-2029
TABLE 102 ITALY VIRTUAL POWER PLANT MARKET BY END-USER (KWH), 2020-2029
TABLE 103 SPAIN VIRTUAL POWER PLANT MARKET BY TECHNOLOGY (USD BILLION), 2020-2029
TABLE 104 SPAIN VIRTUAL POWER PLANT MARKET BY TECHNOLOGY (KWH), 2020-2029
TABLE 105 SPAIN VIRTUAL POWER PLANT MARKET BY END-USER (USD BILLION), 2020-2029
TABLE 106 SPAIN VIRTUAL POWER PLANT MARKET BY END-USER (KWH), 2020-2029
TABLE 107 RUSSIA VIRTUAL POWER PLANT MARKET BY TECHNOLOGY (USD BILLION), 2020-2029
TABLE 108 RUSSIA VIRTUAL POWER PLANT MARKET BY TECHNOLOGY (KWH), 2020-2029
TABLE 109 RUSSIA VIRTUAL POWER PLANT MARKET BY END-USER (USD BILLION), 2020-2029
TABLE 110 RUSSIA VIRTUAL POWER PLANT MARKET BY END-USER (KWH), 2020-2029
TABLE 111 REST OF EUROPE VIRTUAL POWER PLANT MARKET BY TECHNOLOGY (USD BILLION), 2020-2029
TABLE 112 REST OF EUROPE VIRTUAL POWER PLANT MARKET BY TECHNOLOGY (KWH), 2020-2029
TABLE 113 REST OF EUROPE VIRTUAL POWER PLANT MARKET BY END-USER (USD BILLION), 2020-2029
TABLE 114 REST OF EUROPE VIRTUAL POWER PLANT MARKET BY END-USER (KWH), 2020-2029
TABLE 115 MIDDLE EAST AND AFRICA VIRTUAL POWER PLANT MARKET BY TECHNOLOGY (USD BILLION), 2020-2029
TABLE 116 MIDDLE EAST AND AFRICA VIRTUAL POWER PLANT MARKET BY TECHNOLOGY (KWH), 2020-2029
TABLE 117 MIDDLE EAST AND AFRICA VIRTUAL POWER PLANT MARKET BY END-USER (USD BILLION), 2020-2029
TABLE 118 MIDDLE EAST AND AFRICA VIRTUAL POWER PLANT MARKET BY END-USER (KWH), 2020-2029
TABLE 119 MIDDLE EAST AND AFRICA VIRTUAL POWER PLANT MARKET BY COUNTRY (USD BILLION), 2020-2029
TABLE 120 MIDDLE EAST AND AFRICA VIRTUAL POWER PLANT MARKET BY COUNTRY (KWH), 2020-2029
TABLE 121 UAE VIRTUAL POWER PLANT MARKET BY TECHNOLOGY (USD BILLION), 2020-2029
TABLE 122 UAE VIRTUAL POWER PLANT MARKET BY TECHNOLOGY (KWH), 2020-2029
TABLE 123 UAE VIRTUAL POWER PLANT MARKET BY END-USER (USD BILLION), 2020-2029
TABLE 124 UAE VIRTUAL POWER PLANT MARKET BY END-USER (KWH), 2020-2029
TABLE 125 SAUDI ARABIA VIRTUAL POWER PLANT MARKET BY TECHNOLOGY (USD BILLION), 2020-2029
TABLE 126 SAUDI ARABIA VIRTUAL POWER PLANT MARKET BY TECHNOLOGY (KWH), 2020-2029
TABLE 127 SAUDI ARABIA VIRTUAL POWER PLANT MARKET BY END-USER (USD BILLION), 2020-2029
TABLE 128 SAUDI ARABIA VIRTUAL POWER PLANT MARKET BY END-USER (KWH), 2020-2029
TABLE 129 SOUTH AFRICA VIRTUAL POWER PLANT MARKET BY TECHNOLOGY (USD BILLION), 2020-2029
TABLE 130 SOUTH AFRICA VIRTUAL POWER PLANT MARKET BY TECHNOLOGY (KWH), 2020-2029
TABLE 131 SOUTH AFRICA VIRTUAL POWER PLANT MARKET BY END-USER (USD BILLION), 2020-2029
TABLE 132 SOUTH AFRICA VIRTUAL POWER PLANT MARKET BY END-USER (KWH), 2020-2029
TABLE 133 REST OF MIDDLE EAST AND AFRICA VIRTUAL POWER PLANT MARKET BY TECHNOLOGY (USD BILLION), 2020-2029
TABLE 134 REST OF MIDDLE EAST AND AFRICA VIRTUAL POWER PLANT MARKET BY TECHNOLOGY (KWH), 2020-2029
TABLE 135 REST OF MIDDLE EAST AND AFRICA VIRTUAL POWER PLANT MARKET BY END-USER (USD BILLION), 2020-2029
TABLE 136 REST OF MIDDLE EAST AND AFRICA VIRTUAL POWER PLANT MARKET BY END-USER (KWH), 2020-2029
LIST OF FIGURES
FIGURE 1 MARKET DYNAMICS
FIGURE 2 MARKET SEGMENTATION
FIGURE 3 REPORT TIMELINES: YEARS CONSIDERED
FIGURE 4 DATA TRIANGULATION
FIGURE 5 BOTTOM-UP APPROACH
FIGURE 6 TOP-DOWN APPROACH
FIGURE 7 RESEARCH FLOW
FIGURE 8 GLOBAL VIRTUAL POWER PLANT MARKET BY TECHNOLOGY, USD BILLION, 2020-2029
FIGURE 9 GLOBAL VIRTUAL POWER PLANT MARKET BY END-USER, USD BILLION, 2020-2029
FIGURE 10 GLOBAL VIRTUAL POWER PLANT MARKET BY REGION, USD BILLION, 2020-2029
FIGURE 11 PORTER’S FIVE FORCES MODEL
FIGURE 12 GLOBAL VIRTUAL POWER PLANT MARKET BY TECHNOLOGY, USD BILLION, 2021
FIGURE 13 GLOBAL VIRTUAL POWER PLANT MARKET BY END-USER, USD BILLION, 2021
FIGURE 14 GLOBAL VIRTUAL POWER PLANT MARKET BY REGION, USD BILLION, 2021
FIGURE 15 MARKET SHARE ANALYSIS
FIGURE 16 NEXT KRAFTWREKE: COMPANY SNAPSHOT
FIGURE 17 ENBALA: COMPANY SNAPSHOT
FIGURE 18 ENERNOC: COMPANY SNAPSHOT
FIGURE 19 AUTO GRID: COMPANY SNAPSHOT
FIGURE 20 LIME JUMP: COMPANY SNAPSHOT
FIGURE 21 SUNVERGE: COMPANY SNAPSHOT
FIGURE 22 KIWI POWER: COMPANY SNAPSHOT
FIGURE 23 GREENSMITH ENERGY: COMPANY SNAPSHOT
FIGURE 24 AGL ENERGY: COMPANY SNAPSHOT
FIGURE 25 ABB: COMPANY SNAPSHOT
FIGURE 26 SIEMENS: COMPAY SNAPSHOT
FIGURE 27 TESLA: COMPANY SNAPSHOT
DOWNLOAD FREE SAMPLE REPORT
License Type
SPEAK WITH OUR ANALYST
Want to know more about the report or any specific requirement?
WANT TO CUSTOMIZE THE REPORT?
Our Clients Speak
We asked them to research ‘ Equipment market’ all over the world, and their whole arrangement was helpful to us. thehealthanalytics.com insightful analysis and reports contributed to our current analysis and in creating a future strategy. Besides, the te
Yosuke Mitsui
Senior Associate Construction Equipment Sales & Marketing
We asked them to research ‘Equipment market’ all over the world, and their whole arrangement was helpful to us. thehealthanalytics.com insightful analysis and reports contributed to our current analysis and in creating a future strategy. Besides, the te


