

Base Year Value ()
x.x %
x.x %
CAGR ()
x.x %
x.x %
Forecast Year Value ()
x.x %
x.x %
Historical Data Period
Largest Region
Forecast Period
유형별 스마트 소포 사물함 시장(모듈형 소포 사물함, 신선식품용 냉각 사물함, 우편 사물함 및 세탁 사물함), 배치(실내 및 실외), 지역별(북미, 유럽, 아시아 태평양, 남미, 중동 및 아프리카), 2022년부터 2029년까지의 글로벌 트렌드 및 예측
Instant access to hundreds of data points and trends
- Market estimates from 2014-2029
- Competitive analysis, industry segmentation, financial benchmarks
- Incorporates SWOT, Porter's Five Forces and risk management frameworks
- PDF report or online database with Word, Excel and PowerPoint export options
- 100% money back guarantee
스마트 파셀 락커 시장 개요
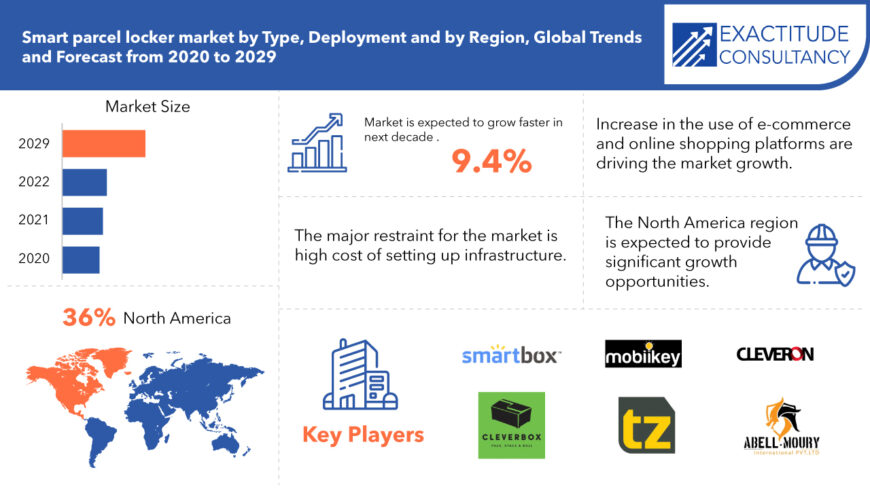
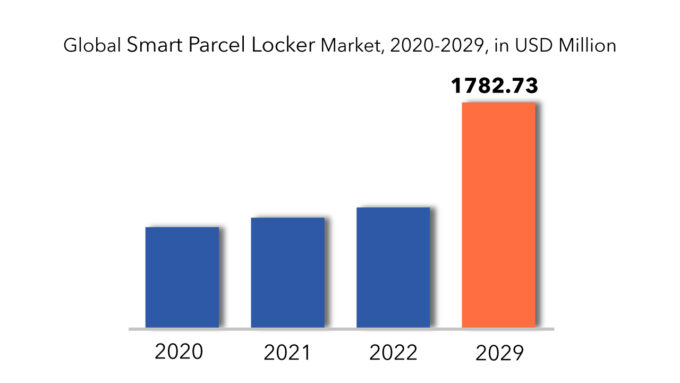
글로벌 스마트 소포 보관함 시장 규모는 2020년에 7억 9,420만 달러로 추산되며, 2029년까지 17억 8,273만 달러에 도달하여 9.4%의 CAGR을 기록할 것으로 예상됩니다.
스마트 소포 보관함은 온라인 채널을 통해 배달되는 소포나 패키지를 보관하는 데 사용되는 자율 컨테이너 기술을 나타냅니다. 이 기술은 소포 관리에 대한 안전하고 편리한 접근 방식을 제공합니다. 급성장하는 전자 상거래 환경과 온라인 쇼핑 플랫폼의 확산은 시장 성장을 촉진할 것으로 예상됩니다. 특히 상업 시설과 다중 세입자 거주지는 여러 수취인에게 전달되는 대량의 소포를 효율적으로 처리하기 위해 이 기술을 점점 더 많이 도입하고 있습니다. 마찬가지로 물류 및 전자 상거래 기업은 지능형 기술 도입으로 전환하고 있습니다.
또한, 시장 확장은 온라인 쇼핑 활동의 급증, 도시화 추세, 인구 밀집 지역으로 인해 촉진됩니다. 비접촉 대안에 대한 수요가 증가하고 IoT 및 RFID 통합과 같은 기술이 발전하고 있습니다. 이러한 요소는 스마트 사물함의 광범위한 채택에 기여하여 마지막 마일 배송 및 패키지 관리와 관련된 과제를 해결하기 위한 안전하고 효율적인 소포 배송 솔루션을 제공합니다.
[캡션 id="attachment_6998" 정렬="정렬센터" 너비="870"]
온라인 소매업의 급속한 성장은 전자상거래 부문의 수요를 높이고 있습니다. 수많은 회사에서 수년에 걸쳐 배달량이 증가하는 것을 관찰했습니다. 이러한 추세를 반영하여 택배 매장이나 사물함 매장의 확산이 크게 증가했습니다. 예를 들어, Deutsche Post Group은 2021년 약 7,000개에서 2023년 15,000개로 택배 사물함 수를 늘릴 계획이라고 발표했습니다.
식품 및 음료, 개인 관리, 의류 및 액세서리, 가전제품을 포함한 다양한 산업 부문에서 소포 배달량이 눈에 띄게 급증했습니다. 전통적인 오프라인 리테일러는 고객 요구에 부응하기 위해 점점 더 전자상거래 및 디지털 플랫폼으로 전환하고 있습니다. Quantum Metric의 데이터에 따르면 전자상거래 플랫폼을 활용하는 오프라인 리테일러는 전환율이 52%나 증가했습니다.
[캡션 id="attachment_7000" 정렬="정렬센터" 너비="680"]
Smart Parcel Locker Market Segment Analysis
The market is segmented into modular parcel lockers, fresh food cooling lockers, postal lockers, and laundry lockers, depending on the type.
The modular parcel locker is expected to dominate the market over the forecast period. The modular parcel locker has a balanced shelf load, is simple to install packages, and may be used in a variety of ways. The demand for this sort of locker is expected to be fueled by the fact that it requires very little maintenance.
As demand develops in the grocery, retail, mall, and e-commerce industries, fresh food chilling lockers are becoming more popular. Because of the growing habit of eating fresh foods, cooling lockers are in high demand.
Due to increased rivalry in the post and parcel market, the postal locker is expected to rise significantly. As a result, in order to stay competitive, the leading parcel handlers have used innovative parcel delivery technologies, which has fueled the expansion of the postal locker industry.
The global market is divided into two categories based on deployment: indoor and outdoor.
The indoor locker is predicted to have a large market share over the forecast period. Customers can deposit their daily mail in the inside lockers. The lockers are easy to assemble and protect against the outdoors.
In retail BOPIS, outdoor lockers are projected to grow more popular. This is anticipated to fuel category expansion in the coming years.
Smart Parcel Locker Market Key Players
Market players focus on growth strategies, such as new product launches, collaborations, partnerships, operational expansion, mergers & acquisitions, and awareness campaigns. Companies operating the target market can focus on partnerships and collaborations, in order to develop advanced products which in turn create lucrative growth opportunities. Few of the important market players TZ Limited, CleverBox Co, Smartbox Ecommerce Solutions Pvt. Ltd, Abell International Pte. Ltd, Cleveron, Package Nexus, Mobiikey Technologies Pvt. Ltd, DeBourgh Manufacturing Co, KEBA AG and Quadient.
Companies are mainly in the developing and they are competing closely with each other. Innovation is one of the most important and key strategy as it has to be for any market. However, companies in the market have also opted and successfully driven inorganic growth strategies like mergers & acquisition and so on.
- Quadient launched advanced parcel locker functionality to manage undelivered or missed delivery in the U.K. The solution helped residential buildings for managing daily incoming parcels with automated and secured processes. This is likely to improve the operational efficiency of the company.
- Grubbrr, a commerce automation company, and Frank Mayer, a premier kioskprovider, have made a strategic partnership to develop smart lockers. The company provided smart lockers for restaurants and other retail stores to ensure safety in a post-COVID-19 pandemic. Frank Mayer has provided a contactless smart locker solution for GRUBBRR to pick up orders with a quick and smooth process to save customers and staff time.
Who Should Buy? Or Key stakeholders
- Smart parcel locker Companies
- Research Organizations
- Investors
- Regulatory Authorities
- Others
Key Takeaways:
- The global smart parcel locker market size is estimated to grow at a CAGR of 9.4%
- Based on type, the modular parcel locker is expected to dominate the market over the forecast period.
- Based on deployment, the indoor locker is predicted to have a large market share over the forecast period.
- The major share is expected to be occupied by North America for global smart parcel locker market during the forecast period.
- The smart parcel locker market is experiencing rapid growth driven by e-commerce expansion and the demand for secure, convenient package delivery solutions.
Smart Parcel Locker Market Regional Analysis
The Smart parcel locker Market by region includes North America, Asia-Pacific (APAC), Europe, South America, and Middle East & Africa (MEA).
- North America: includes US, Canada and Mexico
- Asia Pacific: includes China, Japan, South Korea, India, Australia, ASEAN and Rest of APAC
- Europe: includes UK, Germany, France, Italy, Spain, Russia, and Rest of Europe
- South America: includes Brazil, Argentina and Rest of South America
- Middle East & Africa: includes Turkey, UAE, Saudi Arabia, South Africa, and Rest of MEA
The major share is expected to be occupied by North America for global smart parcel locker market during the forecast period. North America will have the largest share of the worldwide market during the forecast period. This is mostly due to an increase in the number of parcel deliveries as a result of the region's exponential development in online shopping. In addition, prominent e-commerce companies are using cutting-edge technologies to provide their customers with a comfortable purchasing experience.
[caption id="attachment_7001" align="alignnone" width="680"]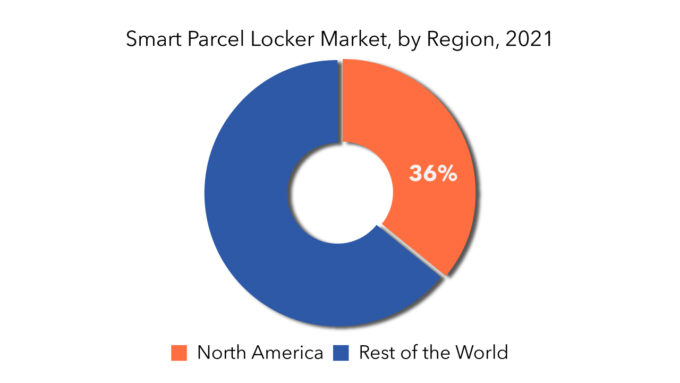
Key Market Segments: Smart parcel locker Market
Smart Parcel Locker Market By Type, 2020-2029, (IN USD Million)- Modular Parcel Locker
- Cooling Lockers For Fresh Food
- Postal Lockers
- Laundry Lockers
- Indoor
- Outdoor
- North America
- Europe
- Asia Pacific
- South America
- Middle East And Africa
Key Question Answered
- What is the current market size of this high growth market?
- What is the overall growth rate?
- What are the key growth areas, applications, end uses and types?
- Key reasons for growth
- Challenges for growth
- Who are the important market players in this market?
- What are the key strategies of these players?
- What technological developments are happening in this area?
- 소개
- 시장 정의
- 시장 세분화
- 연구 타임라인
- 가정 및 제한
- 연구 방법론
- 데이터 마이닝
- 2차 연구
- 1차 연구
- 주제별 전문가의 조언
- 품질 검사
- 최종 검토
- 데이터 삼각 측량
- 하향식 접근 방식
- 탑다운 접근 방식
- 연구 흐름
- 데이터 소스
- 데이터 마이닝
- 요약
- 시장 개요
- 글로벌 스마트 파슬로커 시장 전망
- 시장 동인
- 시장 제약
- 시장 기회
- Covid-19가 글로벌 스마트 소포 보관함 시장에 미치는 영향
- 글로벌 스마트 파슬로커 시장 전망
- 유형별 글로벌 스마트 소포 보관함 시장(백만 달러)(천 대)
- 모듈식 소포 보관함
- 신선 식품을 위한 냉각 보관함
- 우편함
- 세탁실 보관함
- 배포별 글로벌 스마트 소포 보관함 시장(백만 달러)(천 대)
- 실내
- 집 밖의
- 지역별 글로벌 스마트 소포 보관함 시장(USD 백만) (천대)
- 소개
- 아시아 태평양
- 중국
- 인도
- 일본
- 대한민국
- 호주
- 동남아시아
- 아시아 태평양의 나머지 지역
- 북아메리카
- 미국
- 캐나다
- 멕시코
- 유럽
- 독일
- 영국
- 프랑스
- 이탈리아
- 스페인
- 러시아 제국
- 유럽의 나머지 지역
- 남아메리카
- 브라질
- 아르헨티나
- 콜롬비아
- 남미의 나머지 지역
- 중동 및 아프리카
- 아랍에미리트
- 사우디 아라비아
- 남아프리카 공화국
- 중동 및 아프리카의 나머지 지역
- 회사 프로필*
(사업 개요, 회사 스냅샷, 제공되는 유형, 최근 개발 사항)
- TZ 리미티드
- 클레버박스 주식회사
- 스마트박스 이커머스 솔루션스 주식회사
- 아벨 인터내셔널 주식회사
- 클레베론
- 패키지 넥서스
- 모비이키 테크놀로지스 주식회사
- DeBourgh Manufacturing Co
- 케바 AG
- 사분면
*회사 목록은 표시용입니다.
표 목록
TABLE 1 GLOBAL SMART PARCEL LOCKER MARKET BY TYPE (USD MILLIONS), 2020-2029
TABLE 2 GLOBAL SMART PARCEL LOCKER MARKET BY TYPE (THOUSAND UNITS), 2020-2029
TABLE 3 GLOBAL SMART PARCEL LOCKER MARKET BY DEPLOYMENT (USD MILLIONS), 2020-2029
TABLE 4 GLOBAL SMART PARCEL LOCKER MARKET BY DEPLOYMENT (THOUSAND UNITS), 2020-2029
TABLE 5 GLOBAL SMART PARCEL LOCKER MARKET BY REGION (USD MILLIONS), 2020-2029
TABLE 6 GLOBAL SMART PARCEL LOCKER MARKET BY REGION (THOUSAND UNITS), 2020-2029
TABLE 7 NORTH AMERICA SMART PARCEL LOCKER MARKET BY COUNTRY (USD MILLIONS), 2020-2029
TABLE 8 NORTH AMERICA SMART PARCEL LOCKER MARKET BY COUNTRY (THOUSAND UNITS), 2020-2029
TABLE 9 US SMART PARCEL LOCKER MARKET BY TYPE (USD MILLIONS), 2020-2029
TABLE 10 US SMART PARCEL LOCKER MARKET BY TYPE (THOUSAND UNITS), 2020-2029
TABLE 11 US SMART PARCEL LOCKER MARKET BY DEPLOYMENT (USD MILLIONS), 2020-2029
TABLE 12 US SMART PARCEL LOCKER MARKET BY DEPLOYMENT (THOUSAND UNITS), 2020-2029
TABLE 13 CANADA SMART PARCEL LOCKER MARKET BY TYPE (USD MILLIONS), 2020-2029
TABLE 14 CANADA SMART PARCEL LOCKER MARKET BY TYPE (THOUSAND UNITS), 2020-2029
TABLE 15 CANADA SMART PARCEL LOCKER MARKET BY DEPLOYMENT (USD MILLIONS), 2020-2029
TABLE 16 CANADA SMART PARCEL LOCKER MARKET BY DEPLOYMENT (THOUSAND UNITS), 2020-2029
TABLE 17 MEXICO SMART PARCEL LOCKER MARKET BY TYPE (USD MILLIONS), 2020-2029
TABLE 18 MEXICO SMART PARCEL LOCKER MARKET BY TYPE (THOUSAND UNITS), 2020-2029
TABLE 19 MEXICO SMART PARCEL LOCKER MARKET BY DEPLOYMENT (USD MILLIONS), 2020-2029
TABLE 20 MEXICO SMART PARCEL LOCKER MARKET BY DEPLOYMENT (THOUSAND UNITS), 2020-2029
TABLE 21 SOUTH AMERICA SMART PARCEL LOCKER MARKET BY COUNTRY (USD MILLIONS), 2020-2029
TABLE 22 SOUTH AMERICA SMART PARCEL LOCKER MARKET BY COUNTRY (THOUSAND UNITS), 2020-2029
TABLE 23 BRAZIL SMART PARCEL LOCKER MARKET BY TYPE (USD MILLIONS), 2020-2029
TABLE 24 BRAZIL SMART PARCEL LOCKER MARKET BY TYPE (THOUSAND UNITS), 2020-2029
TABLE 25 BRAZIL SMART PARCEL LOCKER MARKET BY DEPLOYMENT (USD MILLIONS), 2020-2029
TABLE 26 BRAZIL SMART PARCEL LOCKER MARKET BY DEPLOYMENT (THOUSAND UNITS), 2020-2029
TABLE 27 ARGENTINA SMART PARCEL LOCKER MARKET BY TYPE (USD MILLIONS), 2020-2029
TABLE 28 ARGENTINA SMART PARCEL LOCKER MARKET BY TYPE (THOUSAND UNITS), 2020-2029
TABLE 29 ARGENTINA SMART PARCEL LOCKER MARKET BY DEPLOYMENT (USD MILLIONS), 2020-2029
TABLE 30 ARGENTINA SMART PARCEL LOCKER MARKET BY DEPLOYMENT (THOUSAND UNITS), 2020-2029
TABLE 31 COLOMBIA SMART PARCEL LOCKER MARKET BY TYPE (USD MILLIONS), 2020-2029
TABLE 32 COLOMBIA SMART PARCEL LOCKER MARKET BY TYPE (THOUSAND UNITS), 2020-2029
TABLE 33 COLOMBIA SMART PARCEL LOCKER MARKET BY DEPLOYMENT (USD MILLIONS), 2020-2029
TABLE 34 COLOMBIA SMART PARCEL LOCKER MARKET BY DEPLOYMENT (THOUSAND UNITS), 2020-2029
TABLE 35 REST OF SOUTH AMERICA SMART PARCEL LOCKER MARKET BY TYPE (USD MILLIONS), 2020-2029
TABLE 36 REST OF SOUTH AMERICA SMART PARCEL LOCKER MARKET BY TYPE (THOUSAND UNITS), 2020-2029
TABLE 37 REST OF SOUTH AMERICA SMART PARCEL LOCKER MARKET BY DEPLOYMENT (USD MILLIONS), 2020-2029
TABLE 38 REST OF SOUTH AMERICA SMART PARCEL LOCKER MARKET BY DEPLOYMENT (THOUSAND UNITS), 2020-2029
TABLE 39 ASIA-PACIFIC SMART PARCEL LOCKER MARKET BY COUNTRY (USD MILLIONS), 2020-2029
TABLE 40 ASIA-PACIFIC SMART PARCEL LOCKER MARKET BY COUNTRY (THOUSAND UNITS), 2020-2029
TABLE 41 INDIA SMART PARCEL LOCKER MARKET BY TYPE (USD MILLIONS), 2020-2029
TABLE 42 INDIA SMART PARCEL LOCKER MARKET BY TYPE (THOUSAND UNITS), 2020-2029
TABLE 43 INDIA SMART PARCEL LOCKER MARKET BY DEPLOYMENT (USD MILLIONS), 2020-2029
TABLE 44 INDIA SMART PARCEL LOCKER MARKET BY DEPLOYMENT (THOUSAND UNITS), 2020-2029
TABLE 45 CHINA SMART PARCEL LOCKER MARKET BY TYPE (USD MILLIONS), 2020-2029
TABLE 46 CHINA SMART PARCEL LOCKER MARKET BY TYPE (THOUSAND UNITS), 2020-2029
TABLE 47 CHINA SMART PARCEL LOCKER MARKET BY DEPLOYMENT (USD MILLIONS), 2020-2029
TABLE 48 CHINA SMART PARCEL LOCKER MARKET BY DEPLOYMENT (THOUSAND UNITS), 2020-2029
TABLE 49 JAPAN SMART PARCEL LOCKER MARKET BY TYPE (USD MILLIONS), 2020-2029
TABLE 50 JAPAN SMART PARCEL LOCKER MARKET BY TYPE (THOUSAND UNITS), 2020-2029
TABLE 51 JAPAN SMART PARCEL LOCKER MARKET BY DEPLOYMENT (USD MILLIONS), 2020-2029
TABLE 52 JAPAN SMART PARCEL LOCKER MARKET BY DEPLOYMENT (THOUSAND UNITS), 2020-2029
TABLE 53 SOUTH KOREA SMART PARCEL LOCKER MARKET BY TYPE (USD MILLIONS), 2020-2029
TABLE 54 SOUTH KOREA SMART PARCEL LOCKER MARKET BY TYPE (THOUSAND UNITS), 2020-2029
TABLE 55 SOUTH KOREA SMART PARCEL LOCKER MARKET BY DEPLOYMENT (USD MILLIONS), 2020-2029
TABLE 56 SOUTH KOREA SMART PARCEL LOCKER MARKET BY DEPLOYMENT (THOUSAND UNITS), 2020-2029
TABLE 57 AUSTRALIA SMART PARCEL LOCKER MARKET BY TYPE (USD MILLIONS), 2020-2029
TABLE 58 AUSTRALIA SMART PARCEL LOCKER MARKET BY TYPE (THOUSAND UNITS), 2020-2029
TABLE 59 AUSTRALIA SMART PARCEL LOCKER MARKET BY DEPLOYMENT (USD MILLIONS), 2020-2029
TABLE 60 AUSTRALIA SMART PARCEL LOCKER MARKET BY DEPLOYMENT (THOUSAND UNITS), 2020-2029
TABLE 61 SOUTH-EAST ASIA SMART PARCEL LOCKER MARKET BY TYPE (USD MILLIONS), 2020-2029
TABLE 62 SOUTH-EAST ASIA SMART PARCEL LOCKER MARKET BY TYPE (THOUSAND UNITS), 2020-2029
TABLE 63 SOUTH-EAST ASIA SMART PARCEL LOCKER MARKET BY DEPLOYMENT (USD MILLIONS), 2020-2029
TABLE 64 SOUTH-EAST ASIA SMART PARCEL LOCKER MARKET BY DEPLOYMENT (THOUSAND UNITS), 2020-2029
TABLE 65 REST OF ASIA PACIFIC SMART PARCEL LOCKER MARKET BY TYPE (USD MILLIONS), 2020-2029
TABLE 66 REST OF ASIA PACIFIC SMART PARCEL LOCKER MARKET BY TYPE (THOUSAND UNITS), 2020-2029
TABLE 67 REST OF ASIA PACIFIC SMART PARCEL LOCKER MARKET BY DEPLOYMENT (USD MILLIONS), 2020-2029
TABLE 68 REST OF ASIA PACIFIC SMART PARCEL LOCKER MARKET BY DEPLOYMENT (THOUSAND UNITS), 2020-2029
TABLE 69 EUROPE SMART PARCEL LOCKER MARKET BY COUNTRY (USD MILLIONS), 2020-2029
TABLE 70 EUROPE SMART PARCEL LOCKER MARKET BY COUNTRY (THOUSAND UNITS), 2020-2029
TABLE 71 GERMANY SMART PARCEL LOCKER MARKET BY TYPE (USD MILLIONS), 2020-2029
TABLE 72 GERMANY SMART PARCEL LOCKER MARKET BY TYPE (THOUSAND UNITS), 2020-2029
TABLE 73 GERMANY SMART PARCEL LOCKER MARKET BY DEPLOYMENT (USD MILLIONS), 2020-2029
TABLE 74 GERMANY SMART PARCEL LOCKER MARKET BY DEPLOYMENT (THOUSAND UNITS), 2020-2029
TABLE 75 UK SMART PARCEL LOCKER MARKET BY TYPE (USD MILLIONS), 2020-2029
TABLE 76 UK SMART PARCEL LOCKER MARKET BY TYPE (THOUSAND UNITS), 2020-2029
TABLE 77 UK SMART PARCEL LOCKER MARKET BY DEPLOYMENT (USD MILLIONS), 2020-2029
TABLE 78 UK SMART PARCEL LOCKER MARKET BY DEPLOYMENT (THOUSAND UNITS), 2020-2029
TABLE 79 FRANCE SMART PARCEL LOCKER MARKET BY TYPE (USD MILLIONS), 2020-2029
TABLE 80 FRANCE SMART PARCEL LOCKER MARKET BY TYPE (THOUSAND UNITS), 2020-2029
TABLE 81 FRANCE SMART PARCEL LOCKER MARKET BY DEPLOYMENT (USD MILLIONS), 2020-2029
TABLE 82 FRANCE SMART PARCEL LOCKER MARKET BY DEPLOYMENT (THOUSAND UNITS), 2020-2029
TABLE 83 ITALY SMART PARCEL LOCKER MARKET BY TYPE (USD MILLIONS), 2020-2029
TABLE 84 ITALY SMART PARCEL LOCKER MARKET BY TYPE (THOUSAND UNITS), 2020-2029
TABLE 85 ITALY SMART PARCEL LOCKER MARKET BY DEPLOYMENT (USD MILLIONS), 2020-2029
TABLE 86 ITALY SMART PARCEL LOCKER MARKET BY DEPLOYMENT (THOUSAND UNITS), 2020-2029
TABLE 87 SPAIN SMART PARCEL LOCKER MARKET BY TYPE (USD MILLIONS), 2020-2029
TABLE 88 SPAIN SMART PARCEL LOCKER MARKET BY TYPE (THOUSAND UNITS), 2020-2029
TABLE 89 SPAIN SMART PARCEL LOCKER MARKET BY DEPLOYMENT (USD MILLIONS), 2020-2029
TABLE 90 SPAIN SMART PARCEL LOCKER MARKET BY DEPLOYMENT (THOUSAND UNITS), 2020-2029
TABLE 91 RUSSIA SMART PARCEL LOCKER MARKET BY TYPE (USD MILLIONS), 2020-2029
TABLE 92 RUSSIA SMART PARCEL LOCKER MARKET BY TYPE (THOUSAND UNITS), 2020-2029
TABLE 93 RUSSIA SMART PARCEL LOCKER MARKET BY DEPLOYMENT (USD MILLIONS), 2020-2029
TABLE 94 RUSSIA SMART PARCEL LOCKER MARKET BY DEPLOYMENT (THOUSAND UNITS), 2020-2029
TABLE 95 REST OF EUROPE SMART PARCEL LOCKER MARKET BY TYPE (USD MILLIONS), 2020-2029
TABLE 96 REST OF EUROPE SMART PARCEL LOCKER MARKET BY TYPE (THOUSAND UNITS), 2020-2029
TABLE 97 REST OF EUROPE SMART PARCEL LOCKER MARKET BY DEPLOYMENT (USD MILLIONS), 2020-2029
TABLE 98 REST OF EUROPE SMART PARCEL LOCKER MARKET BY DEPLOYMENT (THOUSAND UNITS), 2020-2029
TABLE 99 MIDDLE EAST AND AFRICA SMART PARCEL LOCKER MARKET BY COUNTRY (USD MILLIONS), 2020-2029
TABLE 100 MIDDLE EAST AND AFRICA SMART PARCEL LOCKER MARKET BY COUNTRY (THOUSAND UNITS), 2020-2029
TABLE 101 UAE SMART PARCEL LOCKER MARKET BY TYPE (USD MILLIONS), 2020-2029
TABLE 102 UAE SMART PARCEL LOCKER MARKET BY TYPE (THOUSAND UNITS), 2020-2029
TABLE 103 UAE SMART PARCEL LOCKER MARKET BY DEPLOYMENT (USD MILLIONS), 2020-2029
TABLE 104 UAE SMART PARCEL LOCKER MARKET BY DEPLOYMENT (THOUSAND UNITS), 2020-2029
TABLE 105 SAUDI ARABIA SMART PARCEL LOCKER MARKET BY TYPE (USD MILLIONS), 2020-2029
TABLE 106 SAUDI ARABIA SMART PARCEL LOCKER MARKET BY TYPE (THOUSAND UNITS), 2020-2029
TABLE 107 SAUDI ARABIA SMART PARCEL LOCKER MARKET BY DEPLOYMENT (USD MILLIONS), 2020-2029
TABLE 108 SAUDI ARABIA SMART PARCEL LOCKER MARKET BY DEPLOYMENT (THOUSAND UNITS), 2020-2029
TABLE 109 SOUTH AFRICA SMART PARCEL LOCKER MARKET BY TYPE (USD MILLIONS), 2020-2029
TABLE 110 SOUTH AFRICA SMART PARCEL LOCKER MARKET BY TYPE (THOUSAND UNITS), 2020-2029
TABLE 111 SOUTH AFRICA SMART PARCEL LOCKER MARKET BY DEPLOYMENT (USD MILLIONS), 2020-2029
TABLE 112 SOUTH AFRICA SMART PARCEL LOCKER MARKET BY DEPLOYMENT (THOUSAND UNITS), 2020-2029
TABLE 113 REST OF MIDDLE EAST AND AFRICA SMART PARCEL LOCKER MARKET BY TYPE (USD MILLIONS), 2020-2029
TABLE 114 REST OF MIDDLE EAST AND AFRICA SMART PARCEL LOCKER MARKET BY TYPE (THOUSAND UNITS), 2020-2029
TABLE 115 REST OF MIDDLE EAST AND AFRICA SMART PARCEL LOCKER MARKET BY DEPLOYMENT (USD MILLIONS), 2020-2029
TABLE 116 REST OF MIDDLE EAST AND AFRICA SMART PARCEL LOCKER MARKET BY DEPLOYMENT (THOUSAND UNITS), 2020-2029
LIST OF FIGURES
FIGURE 1 MARKET DYNAMICS
FIGURE 2 MARKET SEGMENTATION
FIGURE 3 REPORT TIMELINES: YEARS CONSIDERED
FIGURE 4 DATA TRIANGULATION
FIGURE 5 BOTTOM-UP APPROACH
FIGURE 6 TOP-DOWN APPROACH
FIGURE 7 RESEARCH FLOW
FIGURE 8 GLOBAL SMART PARCEL LOCKER MARKET BY TYPE, USD MILLION, 2020-2029
FIGURE 9 GLOBAL SMART PARCEL LOCKER MARKET BY DEPLOYMENT, USD MILLION, 2020-2029
FIGURE 10 GLOBAL SMART PARCEL LOCKER MARKET BY REGION, USD MILLION, 2020-2029
FIGURE 11 PORTER’S FIVE FORCES MODEL
FIGURE 12 GLOBAL SMART PARCEL LOCKER MARKET BY TYPE, USD MILLION, 2020-2029
FIGURE 13 GLOBAL SMART PARCEL LOCKER MARKET BY DEPLOYMENT, USD MILLION, 2020-2029
FIGURE 14 GLOBAL SMART PARCEL LOCKER MARKET BY REGION, USD MILLION, 2020-2029
FIGURE 15 SMART PARCEL LOCKER MARKET BY REGION 2020
FIGURE 16 MARKET SHARE ANALYSIS
FIGURE 17 TZ LIMITED: COMPANY SNAPSHOT
FIGURE 18 CLEVERBOX CO: COMPANY SNAPSHOT
FIGURE 19 SMARTBOX ECOMMERCE SOLUTIONS PVT. LTD: COMPANY SNAPSHOT
FIGURE 20 ABELL INTERNATIONAL PTE. LTD: COMPANY SNAPSHOT
FIGURE 21 CLEVERON: COMPANY SNAPSHOT
FIGURE 22 PACKAGE NEXUS: COMPANY SNAPSHOT
FIGURE 23 MOBIIKEY TECHNOLOGIES PVT. LTD: COMPANY SNAPSHOT
FIGURE 24 DEBOURGH MANUFACTURING CO: COMPANY SNAPSHOT
FIGURE 25 KEBA AG: COMPANY SNAPSHOT
FIGURE 26 QUADIENT: COMPANY SNAPSHOT
DOWNLOAD FREE SAMPLE REPORT
License Type
SPEAK WITH OUR ANALYST
Want to know more about the report or any specific requirement?
WANT TO CUSTOMIZE THE REPORT?
Our Clients Speak
We asked them to research ‘ Equipment market’ all over the world, and their whole arrangement was helpful to us. thehealthanalytics.com insightful analysis and reports contributed to our current analysis and in creating a future strategy. Besides, the te
Yosuke Mitsui
Senior Associate Construction Equipment Sales & Marketing
We asked them to research ‘Equipment market’ all over the world, and their whole arrangement was helpful to us. thehealthanalytics.com insightful analysis and reports contributed to our current analysis and in creating a future strategy. Besides, the te


