

Base Year Value ()
x.x %
x.x %
CAGR ()
x.x %
x.x %
Forecast Year Value ()
x.x %
x.x %
Historical Data Period
Largest Region
Forecast Period
제품 유형별 롤링 스톡 시장(기관차, 고속철도, 객차, 왜건, 기타) 기관차 기술(기존 기관차, 터보차저 기관차, 자기부상) 구성 요소(열차 제어 시스템, 판토그래프, 차축, 휠셋, 견인 모터, 승객 정보 시스템, 브레이크, 에어컨 시스템, 보조 전원 시스템, 기어박스, 배플 기어, 커플러) 응용 분야(승객 수송, 화물 수송) 및 지역, 2023년부터 2030년까지의 글로벌 트렌드 및 예측
Instant access to hundreds of data points and trends
- Market estimates from 2014-2029
- Competitive analysis, industry segmentation, financial benchmarks
- Incorporates SWOT, Porter's Five Forces and risk management frameworks
- PDF report or online database with Word, Excel and PowerPoint export options
- 100% money back guarantee
시장 개요
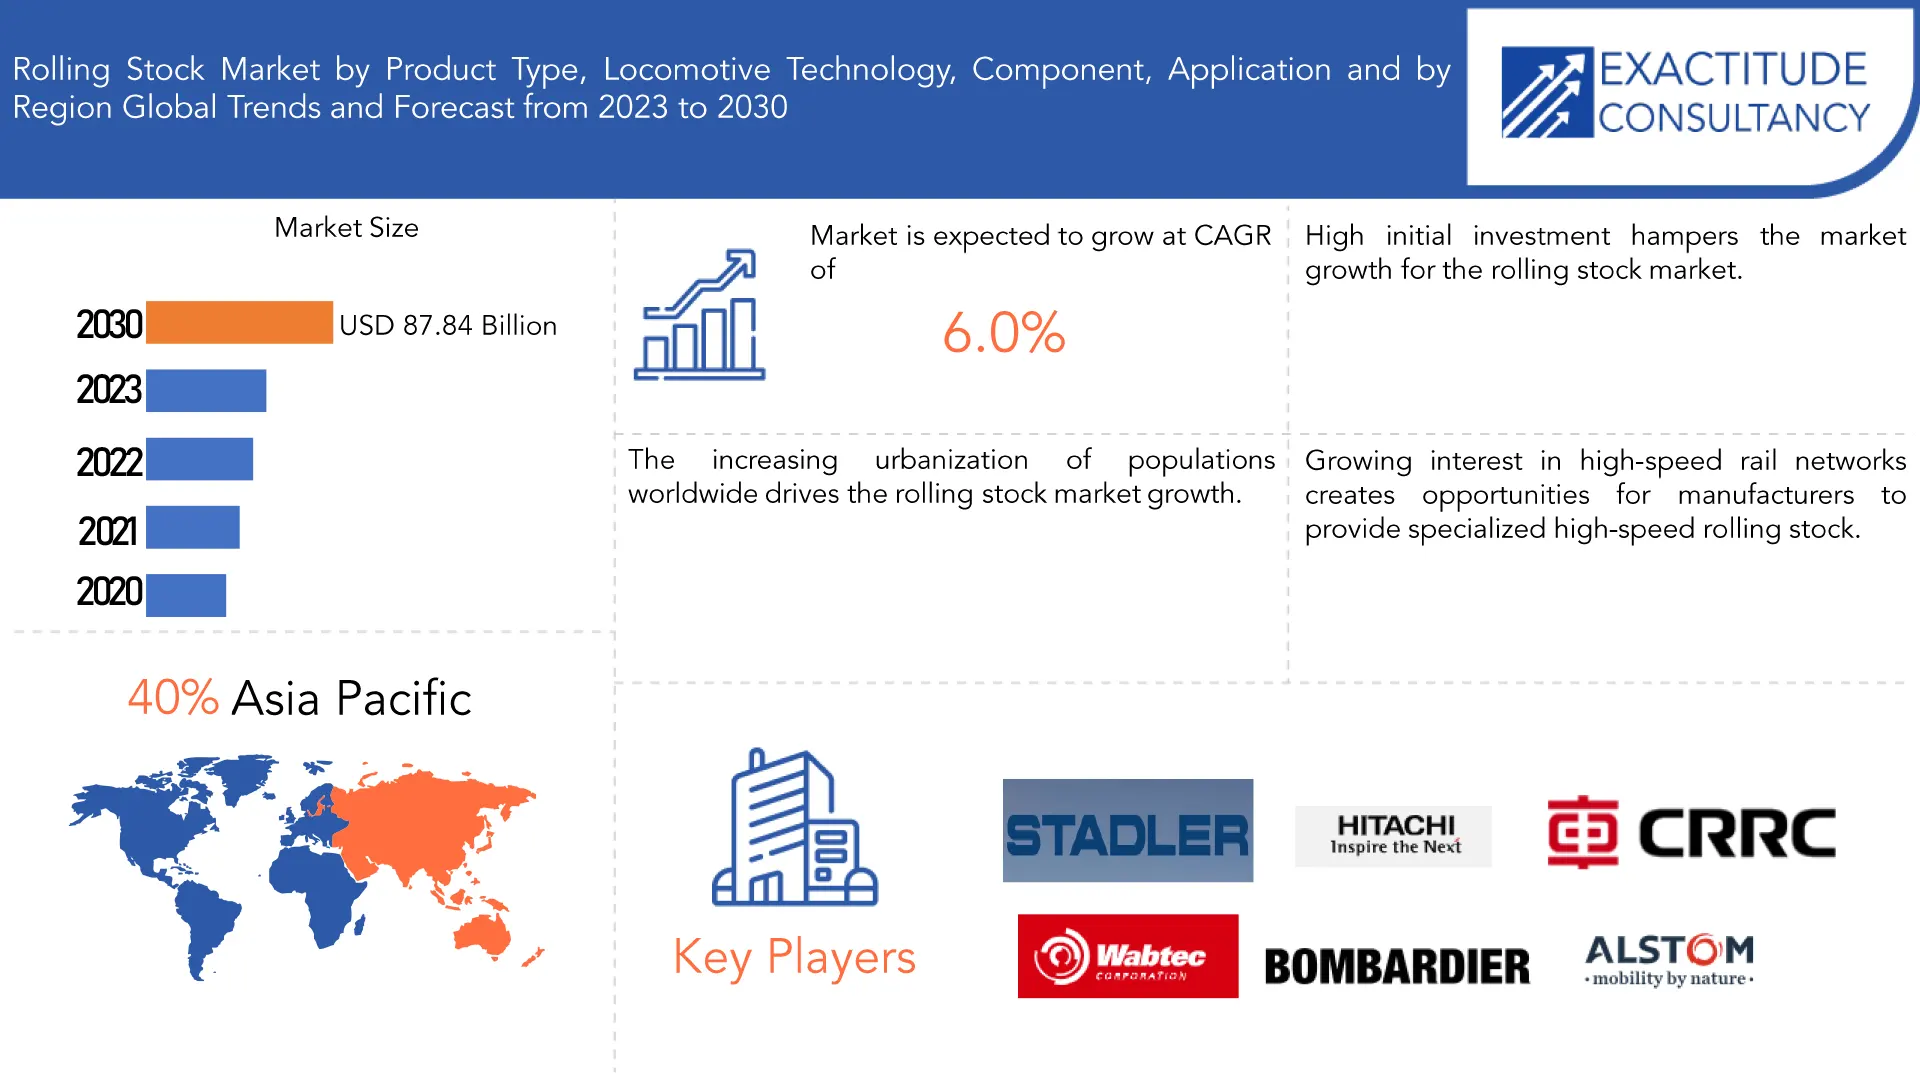
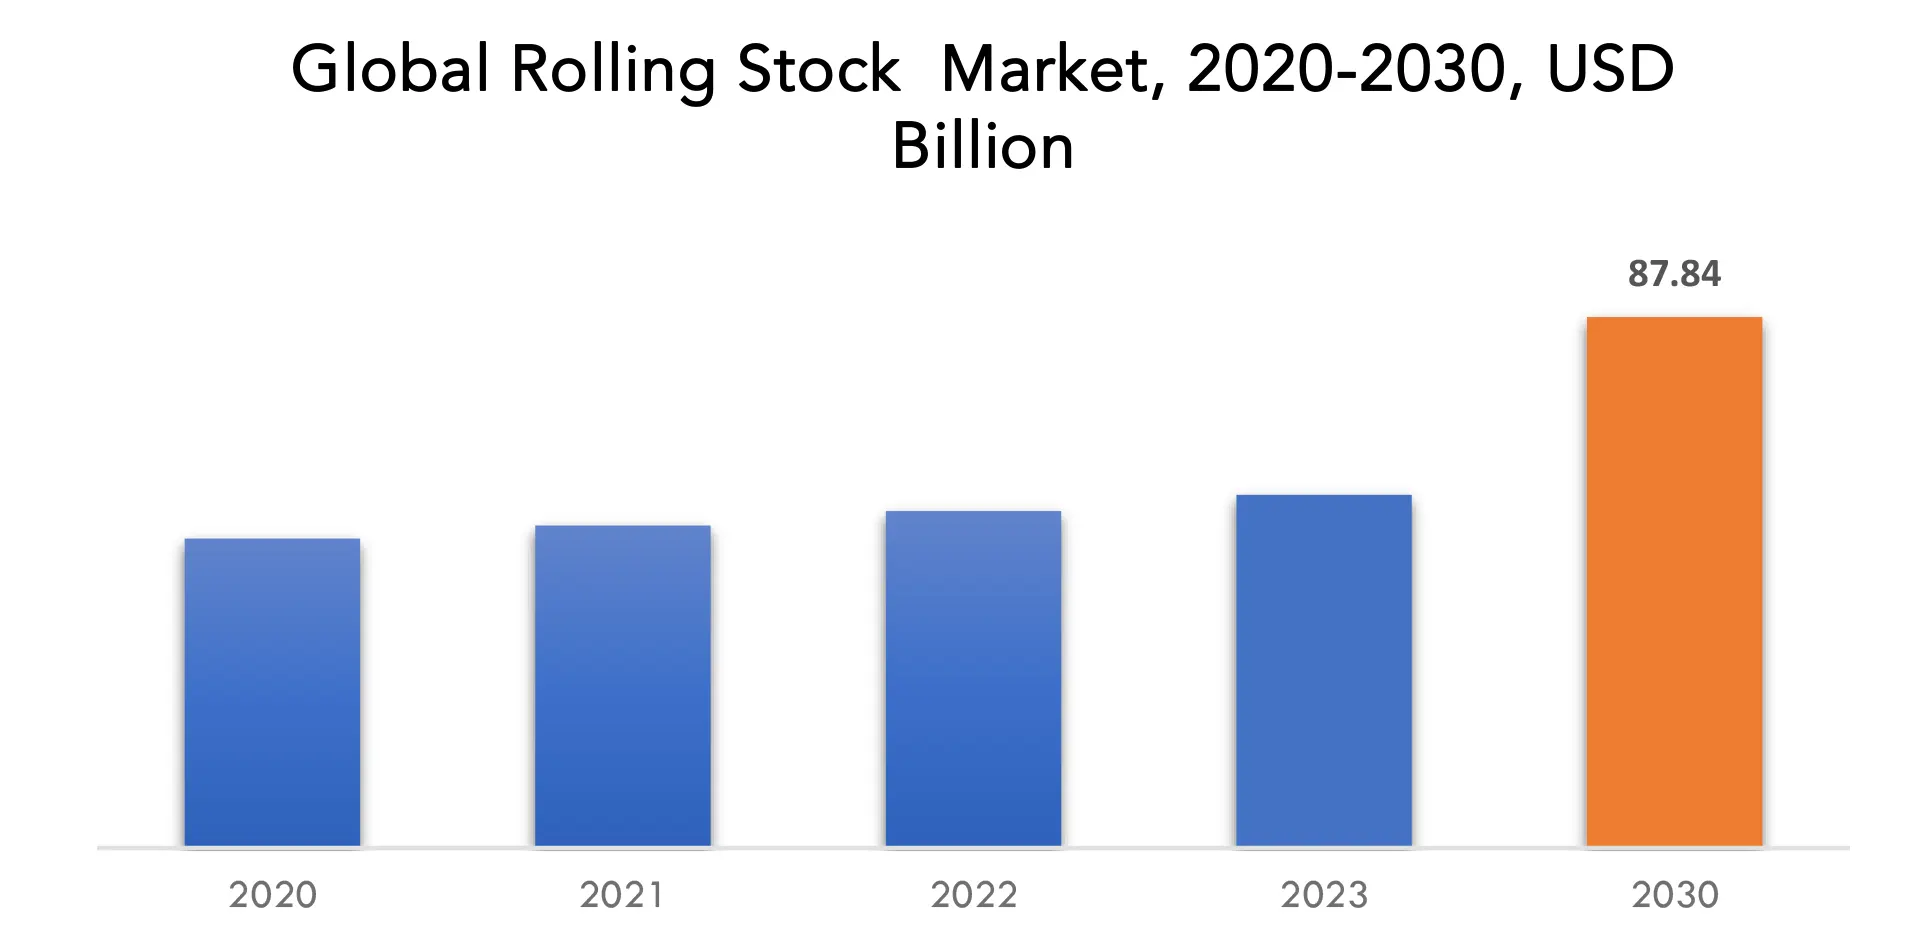
글로벌 롤링 스톡 시장은 2023년 584억 3천만 달러에서 2030년 8784만 달러로 성장할 것으로 예상되며, 예측 기간 동안 연평균 성장률은 6.0%입니다. 롤링 스톡은 기관차, 객차, 화물차 및 철도 시스템 운영에 사용되는 기타 차량을 포함한 철도 차량
모음을 말합니다 . 이러한 차량은 바퀴나 선로로 움직이기 때문에 "롤링"합니다. 롤링 스톡은 승객이나 화물을 수송하든 철도 네트워크의 기능에 중요한 역할을 합니다. 일부 철도는 특정 목적을 위해 특수 롤링 스톡을 사용합니다. 예를 들어, 선로 검사 차량, 밸러스트 조절기 및 레일 연삭기와 같은 선로 유지 관리를 위한 유지 관리 차량이 있습니다. 냉장 또는 기타 특정 조건이 필요한 물품을 운송하기 위한 특수 차량도 있습니다. 특히 기차 형태의 롤링 스톡은 승객과 물품 모두에게 효율적이고 안정적인 운송 수단을 제공합니다. 기차는 많은 양의 사람과 화물을 장거리에 걸쳐 빠르고 경제적으로 운송할 수 있습니다. 롤링 스톡으로 구동되는 철도 운송은 고속도로에서 차량을 제거하여 도로 혼잡을 줄이는 데 도움이 됩니다. 이는 대기 오염을 줄이고 도로 인프라의 마모를 줄임으로써 환경적 이점이 있습니다. 롤링 스톡은 자연 재해나 위기 상황에서 비상 대응을 위해 재활용될 수 있습니다. 기차는 인력, 물품 및 장비를 영향을 받는 지역으로 운송할 수 있습니다. [캡션 id="attachment_32907" align="alignnone" width="1920"]
The world's population remains to grow, and an increasing percentage of people are residing in urban areas. This trend has led to higher demand for efficient and sustainable urban transportation systems, including commuter trains, subways, and light rail systems, which rely on rolling stock. Rolling stock, especially electric trains, is known for its energy efficiency. Trains can move large volumes of people and goods with lower energy consumption per passenger or ton of cargo compared to road transport. This efficiency has been appealing to both operators and governments seeking to reduce fuel consumption and emissions. Government policies and incentives, such as subsidies, grants, and tax benefits, have encouraged investments in rolling stock. These incentives can make it more financially attractive for rail operators to acquire new trains. Advances in rolling stock Locomotive Technology, including improved safety systems, energy-efficient designs, and digital connectivity, have made new trains more appealing to operators looking to enhance safety and reduce operating costs. Private sector companies, including rolling stock manufacturers and transportation operators, have made significant investments in the development and expansion of rail networks.
| ATTRIBUTE | DETAILS |
| Base year | 2022 |
| Estimated year | 2023 |
| Forecasted year | 2023-2030 |
| Historical period | 2019-2021 |
| Unit | Value (USD Billion) (Thousand Units) |
| Segmentation | By Product Type, Locomotive Technology, Component, Application and Region |
| By Product Type |
|
| By Locomotive Technology |
|
| By Component |
|
| By Application |
|
| By Region |
|
Frequently Asked Questions
• What is the market size for the Rolling Stock market?
The global Rolling Stock market is anticipated to grow from USD 58.43 Billion in 2023 to USD 87.84 Million by 2030, at a CAGR of 6.0 % during the forecast period.
• Which region is domaining in the Rolling Stock market?
Asia pacific accounted for the largest market in the Rolling Stock market. Asia pacific accounted for the 40 % market share across the globe.
• Who are the major key players in the Rolling Stock market?
Alstom, Siemens Mobility, CRRC Corporation Limited, Bombardier Transportation (Now part of Alstom), Hitachi Rail, Stadler Rail, Kawasaki Heavy Industries, Hyundai Rotem
• What is the latest trend in the Rolling Stock market?
Growing emphasis on electrification and sustainable propulsion methods, including battery-electric and hydrogen fuel cell-powered trains, to reduce emissions and environmental impact. Continued expansion of high-speed rail networks in various regions, offering faster and more efficient passenger transportation options between major cities.
Rolling Stock Market Segmentation Analysis
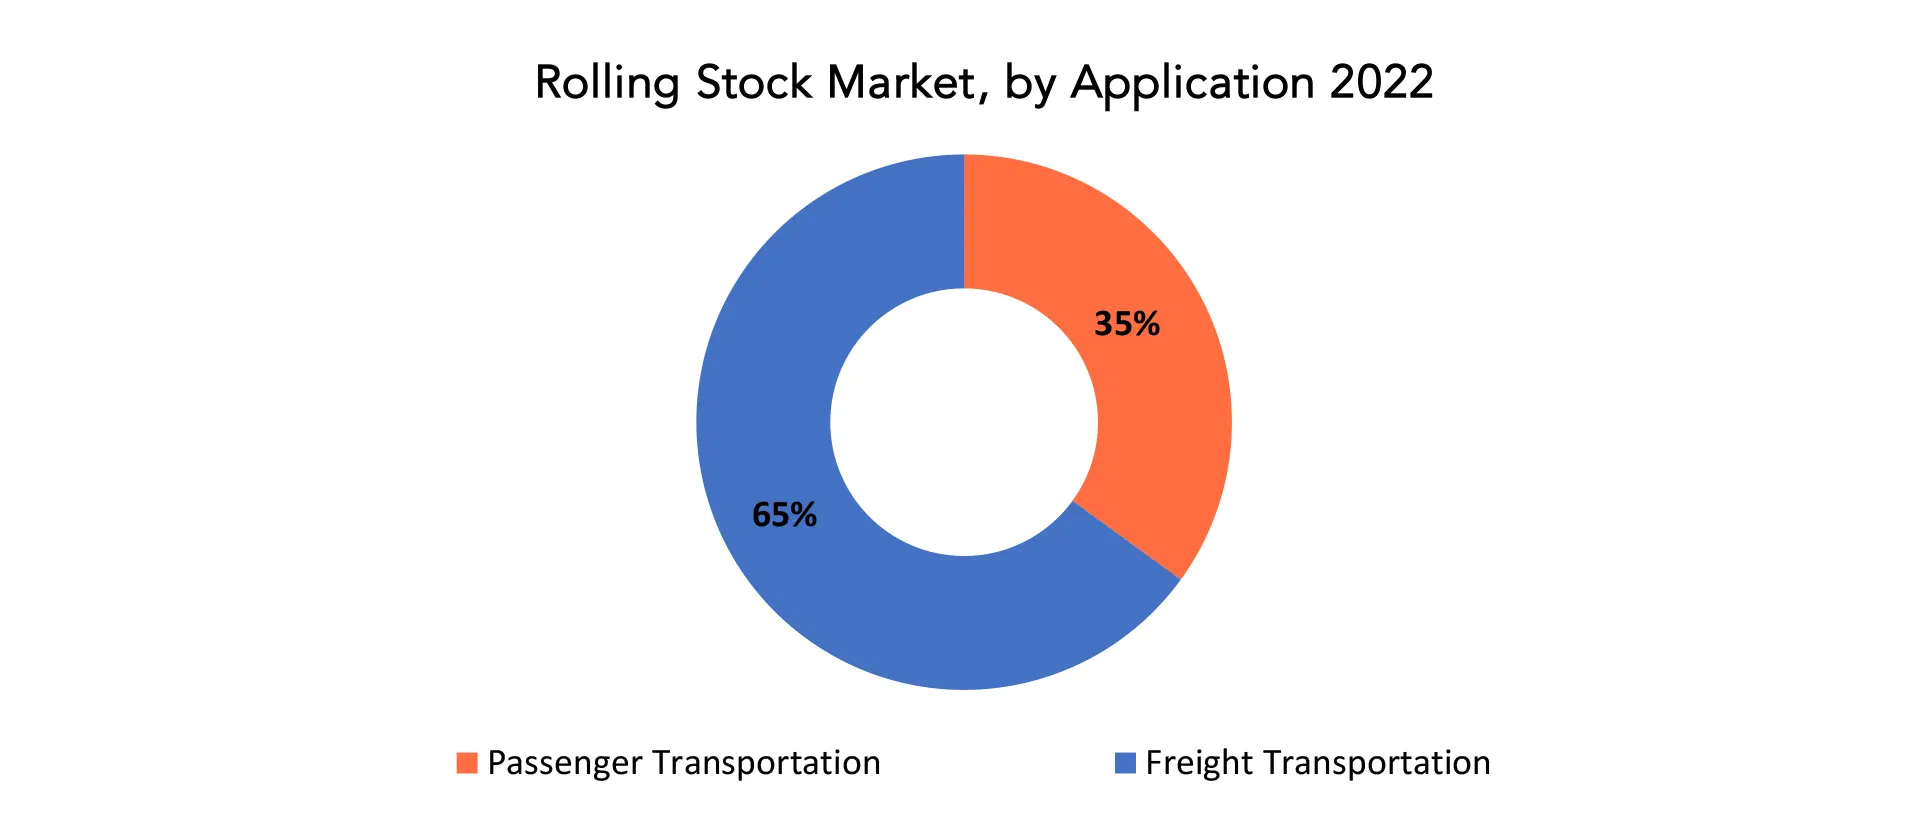
Rolling Stock market is divided into 5 segments, Product type, Components, Application, Locomotive Locomotive Technology and region. by product type the market is bifurcated into Locomotives, Rapid Transit, Coaches, Wagons, Others. By Locomotive Technology the market is bifurcated into Conventional Locomotives, Turbocharged Locomotives, Maglev. By component the market is bifurcated into Train Control Systems, Pantographs, Axles, Wheelsets, Traction Motors, Passenger Information Systems, Brakes, Air Conditioning Systems, Auxiliary Power Systems, Gearboxes, Baffle Gear, Coupler. By application the market is bifurcated into Passenger Transportation, Freight Transportation. [caption id="attachment_32908" align="aligncenter" width="1920"]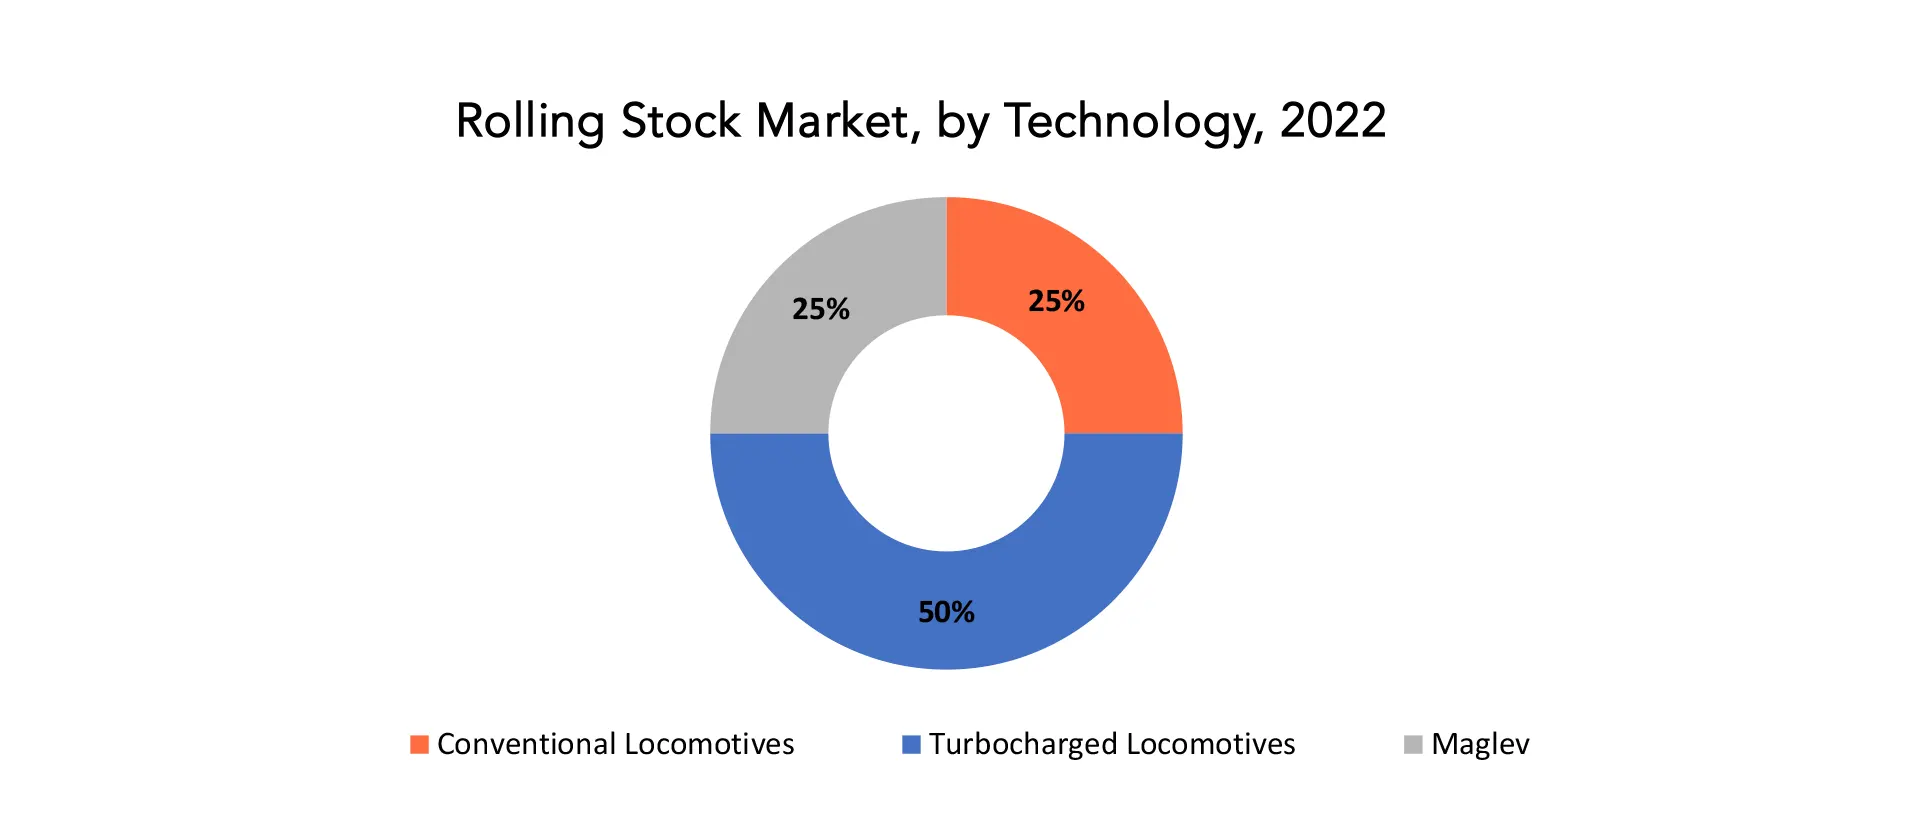
Rolling Stock Market Trends
- Many regions were investing in the electrification of rail networks to reduce carbon emissions and enhance energy efficiency. This trend drove the demand for electric locomotives, multiple units (MUs), and tram systems.
- The expansion of high-speed rail networks continued to be a prominent trend in several countries. High-speed trains offered a competitive alternative to air travel for certain routes, driving the demand for specialized high-speed rolling stock.
- The integration of digital technologies, such as Internet of Things (IoT) sensors, predictive maintenance systems, and onboard Wi-Fi, was becoming increasingly common in rolling stock. This digitalization aimed to improve passenger experience, safety, and operational efficiency.
- Some regions were experimenting with hydrogen fuel cell trains as a clean alternative to diesel locomotives. These trains generated electricity onboard through hydrogen fuel cells, emitting only water vapor as a byproduct.
- Battery-electric trains were being developed and deployed for shorter commuter routes and lines where electrification was not feasible. Advances in battery Locomotive Technology made electric trains more practical for various rail networks.
- Rail operators and manufacturers were focusing on sustainability, incorporating eco-friendly materials, and implementing emission reduction technologies. Sustainability certifications for rolling stock became more common.
- Urbanization and increased urban populations drove the demand for high-capacity rolling stock, including longer trains and articulated cars, to accommodate more passengers during peak hours.
- The integration of various modes of transportation, such as rail, bus, and bicycles, within urban transportation systems became a priority in many cities. Rolling stock manufacturers developed versatile vehicles to support these integrated transportation ecosystems.
- Rolling stock manufacturers were placing greater emphasis on passenger comfort, accessibility, and safety features. This included improved seating arrangements, accessibility for passengers with disabilities, and enhanced security measures.
- Rolling stock manufacturers sought to expand their presence in international markets by exporting their products to regions with growing rail networks and transportation needs.
- The adoption of predictive maintenance solutions using data analytics and sensor Locomotive Technology aimed to reduce downtime, lower maintenance costs, and enhance the reliability of rolling stock.
- Integrated ticketing and payment systems, often utilizing contactless Locomotive Technology and mobile apps, simplified the passenger experience and improved fare collection.
Competitive Landscape
The competitive landscape for the rolling stock market is evolving rapidly as more companies enter the space to capitalize on the growing demand for advanced tire technologies. While established tire manufacturers, automotive suppliers, and Locomotive Technology companies are prominent players, startups and innovative companies have also made significant strides
- Alstom
- Siemens Mobility
- CRRC Corporation Limited
- Bombardier Transportation (Now part of Alstom)
- Hitachi Rail
- Stadler Rail
- Kawasaki Heavy Industries
- Hyundai Rotem
- Talgo
- CAF (Construcciones y Auxiliar de Ferrocarriles)
- Škoda Transportation
- Wabtec Corporation
- Knorr-Bremse
- Ansaldo STS (now merged into Hitachi Rail)
- Toshiba Infrastructure Systems & Solutions Corporation
- Hyundai-Rotem (Hyundai Motor Group)
- Siemens Mobility (Siemens AG)
- Wabtec Corporation (Westinghouse Air Brake Technologies Corporation)
- CRRC Corporation Limited (China Railway Rolling Stock Corporation)
- Greenbrier Companies
Regional Analysis
Asia pacific accounted for the largest market in the Rolling Stock market. Asia pacific accounted for the 40 % market share across the globe. The Asia-Pacific region is home to some of the world's fastest-growing urban centers. As more people migrate to cities, the demand for efficient urban transportation systems, including metros, trams, and commuter trains, has surged. This has driven the need for rolling stock to support urban mobility. Governments in the Asia-Pacific region have allocated substantial funds for rail infrastructure development, creating opportunities for rolling stock manufacturers. Initiatives such as "Belt and Road" and national infrastructure projects have spurred investments in rail systems. Asian rolling stock manufacturers, such as CRRC and Hyundai Rotem, have expanded their reach globally, exporting their products to various markets. This global presence has contributed to market growth. Some emerging markets within the Asia-Pacific region, including Southeast Asia and South Asia, have started developing or expanding their rail networks. This presents opportunities for rolling stock manufacturers to enter new markets. [caption id="attachment_32912" align="aligncenter" width="1920"]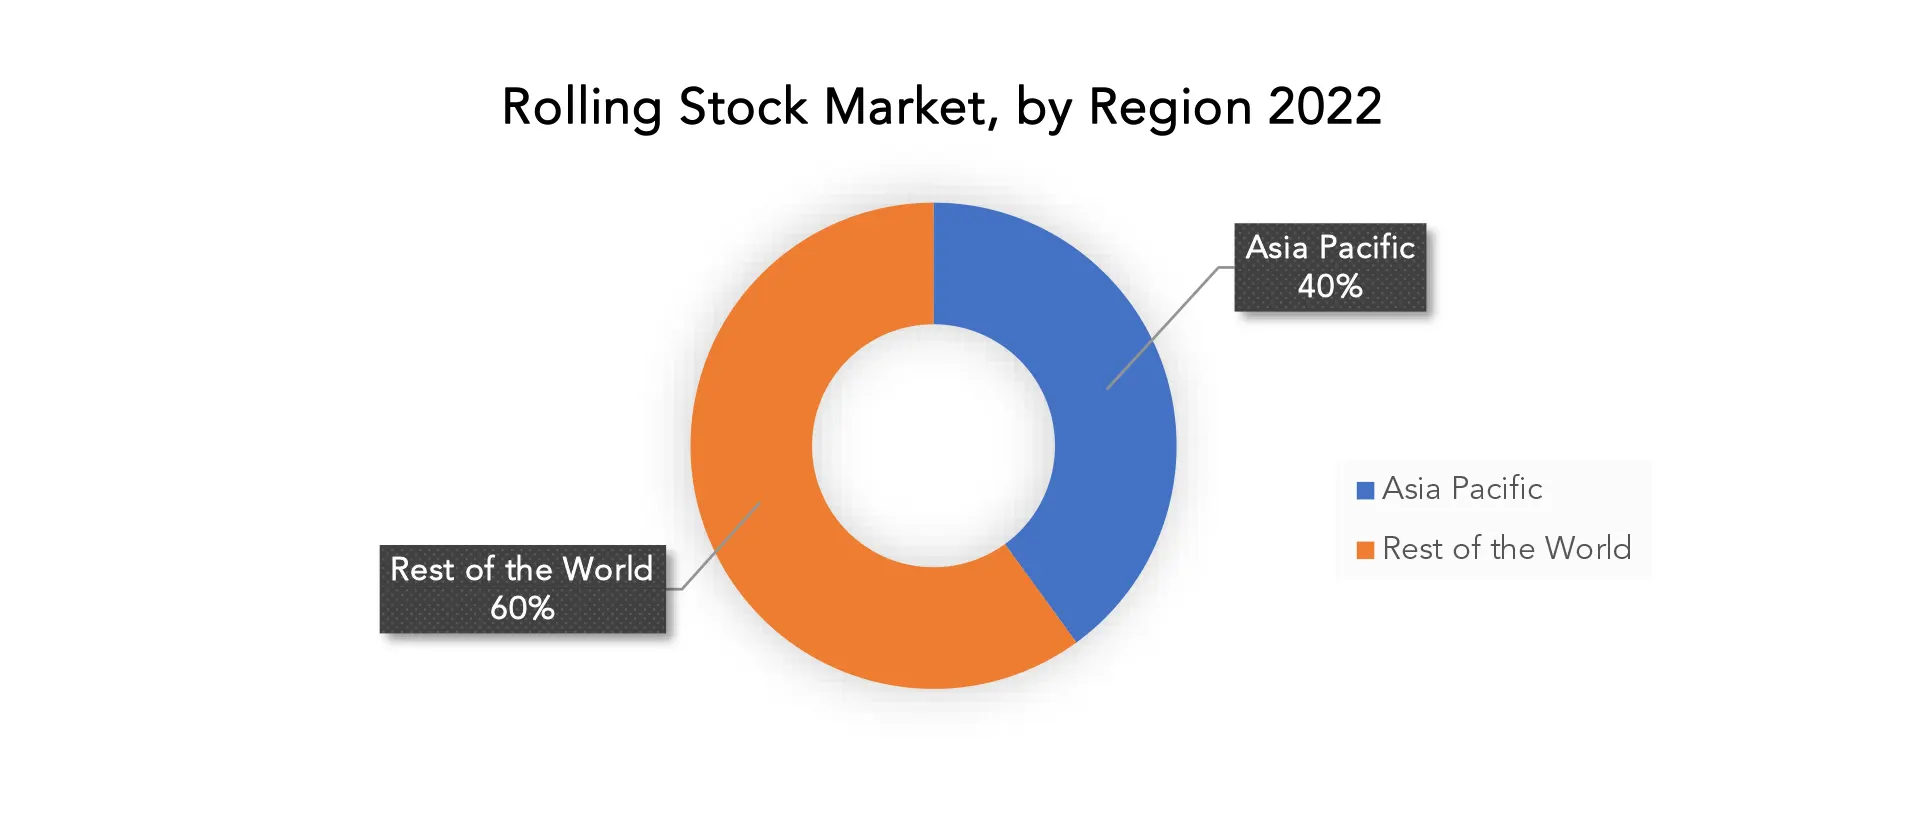
Target Audience for Rolling Stock Market
- Railway Operators and Authorities
- Passenger Rail Services
- Freight and Logistics Companies
- Government Agencies and Regulators
- Rolling Stock Manufacturers
- Leasing and Finance Companies
- Maintenance and Service Providers
- Locomotive Technology and Component Suppliers
- Consulting and Engineering Firms
- Investors and Financial Institutions
- Passengers
- Environmental and Sustainability Organizations
- Research and Academic Institutions
- Trade Associations and Industry Groups
Import & Export Data for Rolling Stock Market
Exactitude consultancy provides import and export data for the recent years. It also offers insights on production and consumption volume of the product. Understanding the import and export data is pivotal for any player in the Rolling Stock’s market. This knowledge equips businesses with strategic advantages, such as:- Identifying emerging markets with untapped potential.
- Adapting supply chain strategies to optimize cost-efficiency and market responsiveness.
- Navigating competition by assessing major players' trade dynamics.
- Trade volume trends: our report dissects import and export data spanning the last five years to reveal crucial trends and growth patterns within the global Area Scan Camera Market. This data-driven exploration empowers readers with a deep understanding of the market's trajectory.
- Market players: gain insights into the leading players driving the Surgical Drill trade. From established giants to emerging contenders, our analysis highlights the key contributors to the import and export landscape.
- Geographical dynamics: delve into the geographical distribution of trade activities. Uncover which regions dominate exports and which ones hold the reins on imports, painting a comprehensive picture of the industry's global footprint.
- Product breakdown: by segmenting data based on Surgical Drill types –– we provide a granular view of trade preferences and shifts, enabling businesses to align strategies with the evolving technological landscape.
Segments Covered in the Rolling Stock Market Report
Rolling Stock Market by Product Type, 2020-2030, (USD Billion), (Thousand Units)- Locomotives
- Diesel Locomotives
- Electric Locomotives
- Electro-Diesel Locomotives
- Rapid Transit
- Diesel Multiple Unit (DMU)
- Electric Multiple Unit (EMU)
- Light Rails/Trams
- Subways/Metros
- Monorails
- Coaches
- Wagons
- Others
- Conventional Locomotives
- Turbocharged Locomotives
- Maglev
- Train Control Systems
- Pantographs
- Axles
- Wheelsets
- Traction Motors
- Passenger Information Systems
- Brakes
- Air Conditioning Systems
- Auxiliary Power Systems
- Gearboxes
- Baffle Gear
- Coupler
- Passenger Transportation
- Freight Transportation
- North America
- Europe
- Asia Pacific
- South America
- Middle East and Africa
Key Question Answered
- What is the expected growth rate of the rolling stock market over the next 7 years?
- Who are the major players in the rolling stock market and what is their market share?
- What are the end-user industries driving market demand and what is their outlook?
- What are the opportunities for growth in emerging markets such as asia-pacific, the middle east, and africa?
- How is the economic environment affecting the rolling stock market, including factors such as interest rates, inflation, and exchange rates?
- What is the expected impact of government policies and regulations on the rolling stock market?
- What is the current and forecasted size and growth rate of the rolling stock market?
- What are the key drivers of growth in the rolling stock market?
- Who are the major players in the market and what is their market share?
- What are the distribution channels and supply chain dynamics in the rolling stock market?
- What are the technological advancements and innovations in the rolling stock market and their impact on product development and growth?
- What are the regulatory considerations and their impact on the market?
- What are the challenges faced by players in the rolling stock market and how are they addressing these challenges?
- What are the opportunities for growth and expansion in the rolling stock market?
- What are the product products and specifications of leading players in the market?
- INTRODUCTION
- MARKET DEFINITION
- MARKET SEGMENTATION
- RESEARCH TIMELINES
- ASSUMPTIONS AND LIMITATIONS
- RESEARCH METHODOLOGY
- DATA MINING
- SECONDARY RESEARCH
- PRIMARY RESEARCH
- SUBJECT-MATTER EXPERTS’ ADVICE
- QUALITY CHECKS
- FINAL REVIEW
- DATA TRIANGULATION
- BOTTOM-UP APPROACH
- TOP-DOWN APPROACH
- RESEARCH FLOW
- DATA SOURCES
- DATA MINING
- EXECUTIVE SUMMARY
- MARKET OVERVIEW
- ROLLING STOCK MARKET OUTLOOK
- MARKET DRIVERS
- MARKET RESTRAINTS
- MARKET OPPORTUNITIES
- IMPACT OF COVID-19 ON ROLLING STOCK MARKET
- PORTER’S FIVE FORCES MODEL
- THREAT FROM NEW ENTRANTS
- THREAT FROM SUBSTITUTES
- BARGAINING POWER OF SUPPLIERS
- BARGAINING POWER OF CUSTOMERS
- DEGREE OF COMPETITION
- INDUSTRY VALUE CHAIN ANALYSIS
- ROLLING STOCK MARKET OUTLOOK
- GLOBAL ROLLING STOCK MARKET BY PRODUCT TYPE, 2020-2030, (USD BILLION) (THOUSAND UNITS)
- LOCOMOTIVES
- DIESEL LOCOMOTIVES
- ELECTRIC LOCOMOTIVES
- ELECTRO-DIESEL LOCOMOTIVES
- RAPID TRANSIT
- DIESEL MULTIPLE UNIT (DMU)
- ELECTRIC MULTIPLE UNIT (EMU)
- LIGHT RAILS/TRAMS
- SUBWAYS/METROS
- MONORAILS
- COACHES
- WAGONS
- OTHERS
- LOCOMOTIVES
- GLOBAL ROLLING STOCK MARKET BY LOCOMOTIVE TECHNOLOGY, 2020-2030, (USD BILLION) (THOUSAND UNITS)
- CONVENTIONAL LOCOMOTIVES
- TURBOCHARGED LOCOMOTIVES
- MAGLEV
- GLOBAL ROLLING STOCK MARKET BY COMPONENT, 2020-2030, (USD BILLION) (THOUSAND UNITS)
- TRAIN CONTROL SYSTEMS
- PANTOGRAPHS
- AXLES
- WHEELSETS
- TRACTION MOTORS
- PASSENGER INFORMATION SYSTEMS
- BRAKES
- AIR CONDITIONING SYSTEMS
- AUXILIARY POWER SYSTEMS
- GEARBOXES
- BAFFLE GEAR
- COUPLER
GLOBAL ROLLING STOCK MARKET BY APPLICATION, 2020-2030, (USD BILLION) (THOUSAND UNITS)
- PASSENGER TRANSPORTATION
- FREIGHT TRANSPORTATION
- GLOBAL ROLLING STOCK MARKET BY REGION, 2020-2030, (USD BILLION) (THOUSAND UNITS)
- NORTH AMERICA
- US
- CANADA
- MEXICO
- SOUTH AMERICA
- BRAZIL
- ARGENTINA
- COLOMBIA
- REST OF SOUTH AMERICA
- EUROPE
- GERMANY
- UK
- FRANCE
- ITALY
- SPAIN
- RUSSIA
- REST OF EUROPE
- ASIA PACIFIC
- INDIA
- CHINA
- JAPAN
- SOUTH KOREA
- AUSTRALIA
- SOUTH-EAST ASIA
- REST OF ASIA PACIFIC
- MIDDLE EAST AND AFRICA
- UAE
- SAUDI ARABIA
- SOUTH AFRICA
- REST OF MIDDLE EAST AND AFRICA
- NORTH AMERICA
- COMPANY PROFILES*
(BUSINESS OVERVIEW, COMPANY SNAPSHOT, PRODUCTS OFFERED, RECENT DEVELOPMENTS)
- ALSTOM
- SIEMENS MOBILITY
- CRRC CORPORATION LIMITED
- BOMBARDIER TRANSPORTATION (NOW PART OF ALSTOM)
- HITACHI RAIL
- STADLER RAIL
- KAWASAKI HEAVY INDUSTRIES
- HYUNDAI ROTEM
- TALGO
- CAF (CONSTRUCCIONES Y AUXILIAR DE FERROCARRILES)
- ŠKODA TRANSPORTATION
- WABTEC CORPORATION
- KNORR-BREMSE
- ANSALDO STS (NOW MERGED INTO HITACHI RAIL)
- TOSHIBA INFRASTRUCTURE SYSTEMS & SOLUTIONS CORPORATION
- HYUNDAI-ROTEM (HYUNDAI MOTOR GROUP)
- SIEMENS MOBILITY (SIEMENS AG)
- WABTEC CORPORATION (WESTINGHOUSE AIR BRAKE TECHNOLOGIES CORPORATION)
- CRRC CORPORATION LIMITED (CHINA RAILWAY ROLLING STOCK CORPORATION)
- GREENBRIER COMPANIES
*THE COMPANY LIST IS INDICATIVE
LIST OF TABLES
TABLE 1 GLOBAL ROLLING STOCK MARKET BY COMPONENT (USD BILLION) 2020-2030
TABLE 2 GLOBAL ROLLING STOCK MARKET BY COMPONENT (THOUSAND UNITS) 2020-2030
TABLE 3 GLOBAL ROLLING STOCK MARKET BY APPLICATION (USD BILLION) 2020-2030
TABLE 4 GLOBAL ROLLING STOCK MARKET BY APPLICATION (THOUSAND UNITS) 2020-2030
TABLE 5 GLOBAL ROLLING STOCK MARKET BY LOCOMOTIVE TECHNOLOGY (USD BILLION) 2020-2030
TABLE 6 GLOBAL ROLLING STOCK MARKET BY LOCOMOTIVE TECHNOLOGY (THOUSAND UNITS) 2020-2030
TABLE 7 GLOBAL ROLLING STOCK MARKET BY PRODUCT TYPE (USD BILLION) 2020-2030
TABLE 8 GLOBAL ROLLING STOCK MARKET BY PRODUCT TYPE (THOUSAND UNITS) 2020-2030
TABLE 9 GLOBAL ROLLING STOCK MARKET BY REGION (USD BILLION) 2020-2030
TABLE 10 GLOBAL ROLLING STOCK MARKET BY REGION (THOUSAND UNITS) 2020-2030
TABLE 11 NORTH AMERICA ROLLING STOCK MARKET BY COUNTRY (USD BILLION) 2020-2030
TABLE 12 NORTH AMERICA ROLLING STOCK MARKET BY COUNTRY (THOUSAND UNITS) 2020-2030
TABLE 13 NORTH AMERICA ROLLING STOCK MARKET BY COMPONENT (USD BILLION) 2020- 2030
TABLE 14 NORTH AMERICA ROLLING STOCK MARKET BY COMPONENT (THOUSAND UNITS) 2020-2030
TABLE 15 NORTH AMERICA ROLLING STOCK MARKET BY APPLICATION (USD BILLION) 2020-2030
TABLE 16 NORTH AMERICA ROLLING STOCK MARKET BY APPLICATION (THOUSAND UNITS) 2020-2030
TABLE 17 NORTH AMERICA ROLLING STOCK MARKET BY LOCOMOTIVE TECHNOLOGY (USD BILLION) 2020-2030
TABLE 18 NORTH AMERICA ROLLING STOCK MARKET BY LOCOMOTIVE TECHNOLOGY (THOUSAND UNITS) 2020- 2030
TABLE 19 NORTH AMERICA ROLLING STOCK MARKET BY PRODUCT TYPE (USD BILLION) 2020-2030
TABLE 20 NORTH AMERICA ROLLING STOCK MARKET BY PRODUCT TYPE (THOUSAND UNITS) 2020-2030
TABLE 21 US ROLLING STOCK MARKET BY COMPONENT (USD BILLION) 2020-2030
TABLE 22 US ROLLING STOCK MARKET BY COMPONENT (THOUSAND UNITS) 2020-2030
TABLE 23 US ROLLING STOCK MARKET BY APPLICATION (USD BILLION) 2020-2030
TABLE 24 US ROLLING STOCK MARKET BY APPLICATION (THOUSAND UNITS) 2020-2030
TABLE 25 US ROLLING STOCK MARKET BY LOCOMOTIVE TECHNOLOGY (USD BILLION) 2020-2030
TABLE 26 US ROLLING STOCK MARKET BY LOCOMOTIVE TECHNOLOGY (THOUSAND UNITS) 2020-2030
TABLE 27 US ROLLING STOCK MARKET BY PRODUCT TYPE (USD BILLION) 2020-2030
TABLE 28 US ROLLING STOCK MARKET BY PRODUCT TYPE (THOUSAND UNITS) 2020-2030
TABLE 29 CANADA ROLLING STOCK MARKET BY COMPONENT (USD BILLION) 2020-2030
TABLE 30 CANADA ROLLING STOCK MARKET BY COMPONENT (THOUSAND UNITS) 2020-2030
TABLE 31 CANADA ROLLING STOCK MARKET BY APPLICATION (USD BILLION) 2020-2030
TABLE 32 CANADA ROLLING STOCK MARKET BY APPLICATION (THOUSAND UNITS) 2020-2030
TABLE 33 CANADA ROLLING STOCK MARKET BY LOCOMOTIVE TECHNOLOGY (USD BILLION) 2020-2030
TABLE 34 CANADA ROLLING STOCK MARKET BY LOCOMOTIVE TECHNOLOGY (THOUSAND UNITS) 2020-2030
TABLE 35 CANADA ROLLING STOCK MARKET BY PRODUCT TYPE (USD BILLION) 2020-2030
TABLE 36 CANADA ROLLING STOCK MARKET BY PRODUCT TYPE (THOUSAND UNITS) 2020-2030
TABLE 37 MEXICO ROLLING STOCK MARKET BY COMPONENT (USD BILLION) 2020-2030
TABLE 38 MEXICO ROLLING STOCK MARKET BY COMPONENT (THOUSAND UNITS) 2020-2030
TABLE 39 MEXICO ROLLING STOCK MARKET BY APPLICATION (USD BILLION) 2020-2030
TABLE 40 MEXICO ROLLING STOCK MARKET BY APPLICATION (THOUSAND UNITS) 2020-2030
TABLE 41 MEXICO ROLLING STOCK MARKET BY LOCOMOTIVE TECHNOLOGY (USD BILLION) 2020-2030
TABLE 42 MEXICO ROLLING STOCK MARKET BY LOCOMOTIVE TECHNOLOGY (THOUSAND UNITS) 2020-2030
TABLE 43 MEXICO ROLLING STOCK MARKET BY PRODUCT TYPE (USD BILLION) 2020-2030
TABLE 44 MEXICO ROLLING STOCK MARKET BY PRODUCT TYPE (THOUSAND UNITS) 2020-2030
TABLE 45 SOUTH AMERICA ROLLING STOCK MARKET BY COUNTRY (USD BILLION) 2020-2030
TABLE 46 SOUTH AMERICA ROLLING STOCK MARKET BY COUNTRY (THOUSAND UNITS) 2020-2030
TABLE 47 SOUTH AMERICA ROLLING STOCK MARKET BY COMPONENT (USD BILLION) 2020-2030
TABLE 48 SOUTH AMERICA ROLLING STOCK MARKET BY COMPONENT (THOUSAND UNITS) 2020-2030
TABLE 49 SOUTH AMERICA ROLLING STOCK MARKET BY APPLICATION (USD BILLION) 2020-2030
TABLE 50 SOUTH AMERICA ROLLING STOCK MARKET BY APPLICATION (THOUSAND UNITS) 2020-2030
TABLE 51 SOUTH AMERICA ROLLING STOCK MARKET BY LOCOMOTIVE TECHNOLOGY (USD BILLION) 2020-2030
TABLE 52 SOUTH AMERICA ROLLING STOCK MARKET BY LOCOMOTIVE TECHNOLOGY (THOUSAND UNITS) 2020-2030
TABLE 53 SOUTH AMERICA ROLLING STOCK MARKET BY PRODUCT TYPE (USD BILLION) 2020-2030
TABLE 54 SOUTH AMERICA ROLLING STOCK MARKET BY PRODUCT TYPE (THOUSAND UNITS) 2020-2030
TABLE 55 BRAZIL ROLLING STOCK MARKET BY COMPONENT (USD BILLION) 2020-2030
TABLE 56 BRAZIL ROLLING STOCK MARKET BY COMPONENT (THOUSAND UNITS) 2020-2030
TABLE 57 BRAZIL ROLLING STOCK MARKET BY APPLICATION (USD BILLION) 2020-2030
TABLE 58 BRAZIL ROLLING STOCK MARKET BY APPLICATION (THOUSAND UNITS) 2020-2030
TABLE 59 BRAZIL ROLLING STOCK MARKET BY LOCOMOTIVE TECHNOLOGY (USD BILLION) 2020-2030
TABLE 60 BRAZIL ROLLING STOCK MARKET BY LOCOMOTIVE TECHNOLOGY (THOUSAND UNITS) 2020-2030
TABLE 61 BRAZIL ROLLING STOCK MARKET BY PRODUCT TYPE (USD BILLION) 2020-2030
TABLE 62 BRAZIL ROLLING STOCK MARKET BY PRODUCT TYPE (THOUSAND UNITS) 2020-2030
TABLE 63 ARGENTINA ROLLING STOCK MARKET BY COMPONENT (USD BILLION) 2020-2030
TABLE 64 ARGENTINA ROLLING STOCK MARKET BY COMPONENT (THOUSAND UNITS) 2020-2030
TABLE 65 ARGENTINA ROLLING STOCK MARKET BY APPLICATION (USD BILLION) 2020-2030
TABLE 66 ARGENTINA ROLLING STOCK MARKET BY APPLICATION (THOUSAND UNITS) 2020-2030
TABLE 67 ARGENTINA ROLLING STOCK MARKET BY LOCOMOTIVE TECHNOLOGY (USD BILLION) 2020-2030
TABLE 68 ARGENTINA ROLLING STOCK MARKET BY LOCOMOTIVE TECHNOLOGY (THOUSAND UNITS) 2020-2030
TABLE 69 ARGENTINA ROLLING STOCK MARKET BY PRODUCT TYPE (USD BILLION) 2020-2030
TABLE 70 ARGENTINA ROLLING STOCK MARKET BY PRODUCT TYPE (THOUSAND UNITS) 2020-2030
TABLE 71 COLOMBIA ROLLING STOCK MARKET BY COMPONENT (USD BILLION) 2020-2030
TABLE 72 COLOMBIA ROLLING STOCK MARKET BY COMPONENT (THOUSAND UNITS) 2020-2030
TABLE 73 COLOMBIA ROLLING STOCK MARKET BY APPLICATION (USD BILLION) 2020-2030
TABLE 74 COLOMBIA ROLLING STOCK MARKET BY APPLICATION (THOUSAND UNITS) 2020-2030
TABLE 75 COLOMBIA ROLLING STOCK MARKET BY LOCOMOTIVE TECHNOLOGY (USD BILLION) 2020-2030
TABLE 76 COLOMBIA ROLLING STOCK MARKET BY LOCOMOTIVE TECHNOLOGY (THOUSAND UNITS) 2020-2030
TABLE 77 COLOMBIA ROLLING STOCK MARKET BY PRODUCT TYPE (USD BILLION) 2020-2030
TABLE 78 COLOMBIA ROLLING STOCK MARKET BY PRODUCT TYPE (THOUSAND UNITS) 2020-2030
TABLE 79 REST OF SOUTH AMERICA ROLLING STOCK MARKET BY COMPONENT (USD BILLION) 2020-2030
TABLE 80 REST OF SOUTH AMERICA ROLLING STOCK MARKET BY COMPONENT (THOUSAND UNITS) 2020-2030
TABLE 81 REST OF SOUTH AMERICA ROLLING STOCK MARKET BY APPLICATION (USD BILLION) 2020-2030
TABLE 82 REST OF SOUTH AMERICA ROLLING STOCK MARKET BY APPLICATION (THOUSAND UNITS) 2020-2030
TABLE 83 REST OF SOUTH AMERICA ROLLING STOCK MARKET BY LOCOMOTIVE TECHNOLOGY (USD BILLION) 2020-2030
TABLE 84 REST OF SOUTH AMERICA ROLLING STOCK MARKET BY LOCOMOTIVE TECHNOLOGY (THOUSAND UNITS) 2020-2030
TABLE 85 REST OF SOUTH AMERICA ROLLING STOCK MARKET BY PRODUCT TYPE (USD BILLION) 2020-2030
TABLE 86 REST OF SOUTH AMERICA ROLLING STOCK MARKET BY PRODUCT TYPE (THOUSAND UNITS) 2020-2030
TABLE 87 ASIA-PACIFIC ROLLING STOCK MARKET BY COUNTRY (USD BILLION) 2020-2030
TABLE 88 ASIA-PACIFIC ROLLING STOCK MARKET BY COUNTRY (THOUSAND UNITS) 2020-2030
TABLE 89 ASIA-PACIFIC ROLLING STOCK MARKET BY COMPONENT (USD BILLION) 2020-2030
TABLE 90 ASIA-PACIFIC ROLLING STOCK MARKET BY COMPONENT (THOUSAND UNITS) 2020-2030
TABLE 91 ASIA-PACIFIC ROLLING STOCK MARKET BY APPLICATION (USD BILLION) 2020-2030
TABLE 92 ASIA-PACIFIC ROLLING STOCK MARKET BY APPLICATION (THOUSAND UNITS) 2020-2030
TABLE 93 ASIA-PACIFIC ROLLING STOCK MARKET BY LOCOMOTIVE TECHNOLOGY (USD BILLION) 2020-2030
TABLE 94 ASIA-PACIFIC ROLLING STOCK MARKET BY LOCOMOTIVE TECHNOLOGY (THOUSAND UNITS) 2020-2030
TABLE 95 ASIA-PACIFIC ROLLING STOCK MARKET BY PRODUCT TYPE (USD BILLION) 2020-2030
TABLE 96 ASIA-PACIFIC ROLLING STOCK MARKET BY PRODUCT TYPE (THOUSAND UNITS) 2020-2030
TABLE 97 INDIA ROLLING STOCK MARKET BY COMPONENT (USD BILLION) 2020-2030
TABLE 98 INDIA ROLLING STOCK MARKET BY COMPONENT (THOUSAND UNITS) 2020-2030
TABLE 99 INDIA ROLLING STOCK MARKET BY APPLICATION (USD BILLION) 2020-2030
TABLE 100 INDIA ROLLING STOCK MARKET BY APPLICATION (THOUSAND UNITS) 2020-2030
TABLE 101 INDIA ROLLING STOCK MARKET BY LOCOMOTIVE TECHNOLOGY (USD BILLION) 2020-2030
TABLE 102 INDIA ROLLING STOCK MARKET BY LOCOMOTIVE TECHNOLOGY (THOUSAND UNITS) 2020-2030
TABLE 103 INDIA ROLLING STOCK MARKET BY PRODUCT TYPE (USD BILLION) 2020-2030
TABLE 104 INDIA ROLLING STOCK MARKET BY PRODUCT TYPE (THOUSAND UNITS) 2020-2030
TABLE 105 CHINA ROLLING STOCK MARKET BY COMPONENT (USD BILLION) 2020-2030
TABLE 106 CHINA ROLLING STOCK MARKET BY COMPONENT (THOUSAND UNITS) 2020-2030
TABLE 107 CHINA ROLLING STOCK MARKET BY APPLICATION (USD BILLION) 2020-2030
TABLE 108 CHINA ROLLING STOCK MARKET BY APPLICATION (THOUSAND UNITS) 2020-2030
TABLE 109 CHINA ROLLING STOCK MARKET BY LOCOMOTIVE TECHNOLOGY (USD BILLION) 2020-2030
TABLE 110 CHINA ROLLING STOCK MARKET BY LOCOMOTIVE TECHNOLOGY (THOUSAND UNITS) 2020-2030
TABLE 111 CHINA ROLLING STOCK MARKET BY PRODUCT TYPE (USD BILLION) 2020-2030
TABLE 112 CHINA ROLLING STOCK MARKET BY PRODUCT TYPE (THOUSAND UNITS) 2020-2030
TABLE 113 JAPAN ROLLING STOCK MARKET BY COMPONENT (USD BILLION) 2020-2030
TABLE 114 JAPAN ROLLING STOCK MARKET BY COMPONENT (THOUSAND UNITS) 2020-2030
TABLE 115 JAPAN ROLLING STOCK MARKET BY APPLICATION (USD BILLION) 2020-2030
TABLE 116 JAPAN ROLLING STOCK MARKET BY APPLICATION (THOUSAND UNITS) 2020-2030
TABLE 117 JAPAN ROLLING STOCK MARKET BY LOCOMOTIVE TECHNOLOGY (USD BILLION) 2020-2030
TABLE 118 JAPAN ROLLING STOCK MARKET BY LOCOMOTIVE TECHNOLOGY (THOUSAND UNITS) 2020-2030
TABLE 119 JAPAN ROLLING STOCK MARKET BY PRODUCT TYPE (USD BILLION) 2020-2030
TABLE 120 JAPAN ROLLING STOCK MARKET BY PRODUCT TYPE (THOUSAND UNITS) 2020-2030
TABLE 121 SOUTH KOREA ROLLING STOCK MARKET BY COMPONENT (USD BILLION) 2020-2030
TABLE 122 SOUTH KOREA ROLLING STOCK MARKET BY COMPONENT (THOUSAND UNITS) 2020-2030
TABLE 123 SOUTH KOREA ROLLING STOCK MARKET BY APPLICATION (USD BILLION) 2020-2030
TABLE 124 SOUTH KOREA ROLLING STOCK MARKET BY APPLICATION (THOUSAND UNITS) 2020-2030
TABLE 125 SOUTH KOREA ROLLING STOCK MARKET BY LOCOMOTIVE TECHNOLOGY (USD BILLION) 2020-2030
TABLE 126 SOUTH KOREA ROLLING STOCK MARKET BY LOCOMOTIVE TECHNOLOGY (THOUSAND UNITS) 2020-2030
TABLE 127 SOUTH KOREA ROLLING STOCK MARKET BY PRODUCT TYPE (USD BILLION) 2020-2030
TABLE 128 SOUTH KOREA ROLLING STOCK MARKET BY PRODUCT TYPE (THOUSAND UNITS) 2020-2030
TABLE 129 AUSTRALIA ROLLING STOCK MARKET BY COMPONENT (USD BILLION) 2020-2030
TABLE 130 AUSTRALIA ROLLING STOCK MARKET BY COMPONENT (THOUSAND UNITS) 2020-2030
TABLE 131 AUSTRALIA ROLLING STOCK MARKET BY APPLICATION (USD BILLION) 2020-2030
TABLE 132 AUSTRALIA ROLLING STOCK MARKET BY APPLICATION (THOUSAND UNITS) 2020-2030
TABLE 133 AUSTRALIA ROLLING STOCK MARKET BY LOCOMOTIVE TECHNOLOGY (USD BILLION) 2020-2030
TABLE 134 AUSTRALIA ROLLING STOCK MARKET BY LOCOMOTIVE TECHNOLOGY (THOUSAND UNITS) 2020-2030
TABLE 135 AUSTRALIA ROLLING STOCK MARKET BY PRODUCT TYPE (USD BILLION) 2020-2030
TABLE 136 AUSTRALIA ROLLING STOCK MARKET BY PRODUCT TYPE (THOUSAND UNITS) 2020-2030
TABLE 137 SOUTH-EAST ASIA ROLLING STOCK MARKET BY COMPONENT (USD BILLION) 2020-2030
TABLE 138 SOUTH-EAST ASIA ROLLING STOCK MARKET BY COMPONENT (THOUSAND UNITS) 2020-2030
TABLE 139 SOUTH-EAST ASIA ROLLING STOCK MARKET BY APPLICATION (USD BILLION) 2020-2030
TABLE 140 SOUTH-EAST ASIA ROLLING STOCK MARKET BY APPLICATION (THOUSAND UNITS) 2020-2030
TABLE 141 SOUTH-EAST ASIA ROLLING STOCK MARKET BY LOCOMOTIVE TECHNOLOGY (USD BILLION) 2020-2030
TABLE 142 SOUTH-EAST ASIA ROLLING STOCK MARKET BY LOCOMOTIVE TECHNOLOGY (THOUSAND UNITS) 2020-2030
TABLE 143 SOUTH-EAST ASIA ROLLING STOCK MARKET BY PRODUCT TYPE (USD BILLION) 2020-2030
TABLE 144 SOUTH-EAST ASIA ROLLING STOCK MARKET BY PRODUCT TYPE (THOUSAND UNITS) 2020-2030
TABLE 145 REST OF ASIA PACIFIC ROLLING STOCK MARKET BY COMPONENT (USD BILLION) 2020-2030
TABLE 146 REST OF ASIA PACIFIC ROLLING STOCK MARKET BY COMPONENT (THOUSAND UNITS) 2020-2030
TABLE 147 REST OF ASIA PACIFIC ROLLING STOCK MARKET BY APPLICATION (USD BILLION) 2020-2030
TABLE 148 REST OF ASIA PACIFIC ROLLING STOCK MARKET BY APPLICATION (THOUSAND UNITS) 2020-2030
TABLE 149 REST OF ASIA PACIFIC ROLLING STOCK MARKET BY LOCOMOTIVE TECHNOLOGY (USD BILLION) 2020-2030
TABLE 150 REST OF ASIA PACIFIC ROLLING STOCK MARKET BY LOCOMOTIVE TECHNOLOGY (THOUSAND UNITS) 2020-2030
TABLE 151 REST OF ASIA PACIFIC ROLLING STOCK MARKET BY PRODUCT TYPE (USD BILLION) 2020-2030
TABLE 152 REST OF ASIA PACIFIC ROLLING STOCK MARKET BY PRODUCT TYPE (THOUSAND UNITS) 2020-2030
TABLE 153 EUROPE ROLLING STOCK MARKET BY COUNTRY (USD BILLION) 2020-2030
TABLE 154 EUROPE ROLLING STOCK MARKET BY COUNTRY (THOUSAND UNITS) 2020-2030
TABLE 155 EUROPE ROLLING STOCK MARKET BY COMPONENT (USD BILLION) 2020-2030
TABLE 156 EUROPE ROLLING STOCK MARKET BY COMPONENT (THOUSAND UNITS) 2020-2030
TABLE 157 EUROPE ROLLING STOCK MARKET BY APPLICATION (USD BILLION) 2020-2030
TABLE 158 EUROPE ROLLING STOCK MARKET BY APPLICATION (THOUSAND UNITS) 2020-2030
TABLE 159 EUROPE ROLLING STOCK MARKET BY LOCOMOTIVE TECHNOLOGY (USD BILLION) 2020-2030
TABLE 160 EUROPE ROLLING STOCK MARKET BY LOCOMOTIVE TECHNOLOGY (THOUSAND UNITS) 2020-2030
TABLE 161 EUROPE ROLLING STOCK MARKET BY PRODUCT TYPE (USD BILLION) 2020-2030
TABLE 162 EUROPE ROLLING STOCK MARKET BY PRODUCT TYPE (THOUSAND UNITS) 2020-2030
TABLE 163 GERMANY ROLLING STOCK MARKET BY COMPONENT (USD BILLION) 2020-2030
TABLE 164 GERMANY ROLLING STOCK MARKET BY COMPONENT (THOUSAND UNITS) 2020-2030
TABLE 165 GERMANY ROLLING STOCK MARKET BY APPLICATION (USD BILLION) 2020-2030
TABLE 166 GERMANY ROLLING STOCK MARKET BY APPLICATION (THOUSAND UNITS) 2020-2030
TABLE 167 GERMANY ROLLING STOCK MARKET BY LOCOMOTIVE TECHNOLOGY (USD BILLION) 2020-2030
TABLE 168 GERMANY ROLLING STOCK MARKET BY LOCOMOTIVE TECHNOLOGY (THOUSAND UNITS) 2020-2030
TABLE 169 GERMANY ROLLING STOCK MARKET BY PRODUCT TYPE (USD BILLION) 2020-2030
TABLE 170 GERMANY ROLLING STOCK MARKET BY PRODUCT TYPE (THOUSAND UNITS) 2020-2030
TABLE 171 UK ROLLING STOCK MARKET BY COMPONENT (USD BILLION) 2020-2030
TABLE 172 UK ROLLING STOCK MARKET BY COMPONENT (THOUSAND UNITS) 2020-2030
TABLE 173 UK ROLLING STOCK MARKET BY APPLICATION (USD BILLION) 2020-2030
TABLE 174 UK ROLLING STOCK MARKET BY APPLICATION (THOUSAND UNITS) 2020-2030
TABLE 175 UK ROLLING STOCK MARKET BY LOCOMOTIVE TECHNOLOGY (USD BILLION) 2020-2030
TABLE 176 UK ROLLING STOCK MARKET BY LOCOMOTIVE TECHNOLOGY (THOUSAND UNITS) 2020-2030
TABLE 177 UK ROLLING STOCK MARKET BY PRODUCT TYPE (USD BILLION) 2020-2030
TABLE 178 UK ROLLING STOCK MARKET BY PRODUCT TYPE (THOUSAND UNITS) 2020-2030
TABLE 179 FRANCE ROLLING STOCK MARKET BY COMPONENT (USD BILLION) 2020-2030
TABLE 180 FRANCE ROLLING STOCK MARKET BY COMPONENT (THOUSAND UNITS) 2020-2030
TABLE 181 FRANCE ROLLING STOCK MARKET BY APPLICATION (USD BILLION) 2020-2030
TABLE 182 FRANCE ROLLING STOCK MARKET BY APPLICATION (THOUSAND UNITS) 2020-2030
TABLE 183 FRANCE ROLLING STOCK MARKET BY LOCOMOTIVE TECHNOLOGY (USD BILLION) 2020-2030
TABLE 184 FRANCE ROLLING STOCK MARKET BY LOCOMOTIVE TECHNOLOGY (THOUSAND UNITS) 2020-2030
TABLE 185 FRANCE ROLLING STOCK MARKET BY PRODUCT TYPE (USD BILLION) 2020-2030
TABLE 186 FRANCE ROLLING STOCK MARKET BY PRODUCT TYPE (THOUSAND UNITS) 2020-2030
TABLE 187 ITALY ROLLING STOCK MARKET BY COMPONENT (USD BILLION) 2020-2030
TABLE 188 ITALY ROLLING STOCK MARKET BY COMPONENT (THOUSAND UNITS) 2020-2030
TABLE 189 ITALY ROLLING STOCK MARKET BY APPLICATION (USD BILLION) 2020-2030
TABLE 190 ITALY ROLLING STOCK MARKET BY APPLICATION (THOUSAND UNITS) 2020-2030
TABLE 191 ITALY ROLLING STOCK MARKET BY LOCOMOTIVE TECHNOLOGY (USD BILLION) 2020-2030
TABLE 192 ITALY ROLLING STOCK MARKET BY LOCOMOTIVE TECHNOLOGY (THOUSAND UNITS) 2020-2030
TABLE 193 ITALY ROLLING STOCK MARKET BY PRODUCT TYPE (USD BILLION) 2020-2030
TABLE 194 ITALY ROLLING STOCK MARKET BY PRODUCT TYPE (THOUSAND UNITS) 2020-2030
TABLE 195 SPAIN ROLLING STOCK MARKET BY COMPONENT (USD BILLION) 2020-2030
TABLE 196 SPAIN ROLLING STOCK MARKET BY COMPONENT (THOUSAND UNITS) 2020-2030
TABLE 197 SPAIN ROLLING STOCK MARKET BY APPLICATION (USD BILLION) 2020-2030
TABLE 198 SPAIN ROLLING STOCK MARKET BY APPLICATION (THOUSAND UNITS) 2020-2030
TABLE 199 SPAIN ROLLING STOCK MARKET BY LOCOMOTIVE TECHNOLOGY (USD BILLION) 2020-2030
TABLE 200 SPAIN ROLLING STOCK MARKET BY LOCOMOTIVE TECHNOLOGY (THOUSAND UNITS) 2020-2030
TABLE 201 SPAIN ROLLING STOCK MARKET BY PRODUCT TYPE (USD BILLION) 2020-2030
TABLE 202 SPAIN ROLLING STOCK MARKET BY PRODUCT TYPE (THOUSAND UNITS) 2020-2030
TABLE 203 RUSSIA ROLLING STOCK MARKET BY COMPONENT (USD BILLION) 2020-2030
TABLE 204 RUSSIA ROLLING STOCK MARKET BY COMPONENT (THOUSAND UNITS) 2020-2030
TABLE 205 RUSSIA ROLLING STOCK MARKET BY APPLICATION (USD BILLION) 2020-2030
TABLE 206 RUSSIA ROLLING STOCK MARKET BY APPLICATION (THOUSAND UNITS) 2020-2030
TABLE 207 RUSSIA ROLLING STOCK MARKET BY LOCOMOTIVE TECHNOLOGY (USD BILLION) 2020-2030
TABLE 208 RUSSIA ROLLING STOCK MARKET BY LOCOMOTIVE TECHNOLOGY (THOUSAND UNITS) 2020-2030
TABLE 209 RUSSIA ROLLING STOCK MARKET BY PRODUCT TYPE (USD BILLION) 2020-2030
TABLE 210 RUSSIA ROLLING STOCK MARKET BY PRODUCT TYPE (THOUSAND UNITS) 2020-2030
TABLE 211 REST OF EUROPE ROLLING STOCK MARKET BY COMPONENT (USD BILLION) 2020-2030
TABLE 212 REST OF EUROPE ROLLING STOCK MARKET BY COMPONENT (THOUSAND UNITS) 2020-2030
TABLE 213 REST OF EUROPE ROLLING STOCK MARKET BY APPLICATION (USD BILLION) 2020-2030
TABLE 214 REST OF EUROPE ROLLING STOCK MARKET BY APPLICATION (THOUSAND UNITS) 2020-2030
TABLE 215 REST OF EUROPE ROLLING STOCK MARKET BY LOCOMOTIVE TECHNOLOGY (USD BILLION) 2020-2030
TABLE 216 REST OF EUROPE ROLLING STOCK MARKET BY LOCOMOTIVE TECHNOLOGY (THOUSAND UNITS) 2020-2030
TABLE 217 REST OF EUROPE ROLLING STOCK MARKET BY PRODUCT TYPE (USD BILLION) 2020-2030
TABLE 218 REST OF EUROPE ROLLING STOCK MARKET BY PRODUCT TYPE (THOUSAND UNITS) 2020-2030
TABLE 219 MIDDLE EAST AND AFRICA ROLLING STOCK MARKET BY COUNTRY (USD BILLION) 2020-2030
TABLE 220 MIDDLE EAST AND AFRICA ROLLING STOCK MARKET BY COUNTRY (THOUSAND UNITS) 2020-2030
TABLE 221 MIDDLE EAST AND AFRICA ROLLING STOCK MARKET BY COMPONENT (USD BILLION) 2020-2030
TABLE 222 MIDDLE EAST AND AFRICA ROLLING STOCK MARKET BY COMPONENT (THOUSAND UNITS) 2020-2030
TABLE 223 MIDDLE EAST AND AFRICA ROLLING STOCK MARKET BY APPLICATION (USD BILLION) 2020-2030
TABLE 224 MIDDLE EAST AND AFRICA ROLLING STOCK MARKET BY APPLICATION (THOUSAND UNITS) 2020-2030
TABLE 225 MIDDLE EAST AND AFRICA ROLLING STOCK MARKET BY LOCOMOTIVE TECHNOLOGY (USD BILLION) 2020-2030
TABLE 226 MIDDLE EAST AND AFRICA ROLLING STOCK MARKET BY LOCOMOTIVE TECHNOLOGY (THOUSAND UNITS) 2020-2030
TABLE 227 MIDDLE EAST AND AFRICA ROLLING STOCK MARKET BY PRODUCT TYPE (USD BILLION) 2020-2030
TABLE 228 MIDDLE EAST AND AFRICA ROLLING STOCK MARKET BY PRODUCT TYPE (THOUSAND UNITS) 2020-2030
TABLE 229 UAE ROLLING STOCK MARKET BY COMPONENT (USD BILLION) 2020-2030
TABLE 230 UAE ROLLING STOCK MARKET BY COMPONENT (THOUSAND UNITS) 2020-2030
TABLE 231 UAE ROLLING STOCK MARKET BY APPLICATION (USD BILLION) 2020-2030
TABLE 232 UAE ROLLING STOCK MARKET BY APPLICATION (THOUSAND UNITS) 2020-2030
TABLE 233 UAE ROLLING STOCK MARKET BY LOCOMOTIVE TECHNOLOGY (USD BILLION) 2020-2030
TABLE 234 UAE ROLLING STOCK MARKET BY LOCOMOTIVE TECHNOLOGY (THOUSAND UNITS) 2020-2030
TABLE 235 UAE ROLLING STOCK MARKET BY PRODUCT TYPE (USD BILLION) 2020-2030
TABLE 236 UAE ROLLING STOCK MARKET BY PRODUCT TYPE (THOUSAND UNITS) 2020-2030
TABLE 237 SAUDI ARABIA ROLLING STOCK MARKET BY COMPONENT (USD BILLION) 2020-2030
TABLE 238 SAUDI ARABIA ROLLING STOCK MARKET BY COMPONENT (THOUSAND UNITS) 2020-2030
TABLE 239 SAUDI ARABIA ROLLING STOCK MARKET BY APPLICATION (USD BILLION) 2020-2030
TABLE 240 SAUDI ARABIA ROLLING STOCK MARKET BY APPLICATION (THOUSAND UNITS) 2020-2030
TABLE 241 SAUDI ARABIA ROLLING STOCK MARKET BY LOCOMOTIVE TECHNOLOGY (USD BILLION) 2020-2030
TABLE 242 SAUDI ARABIA ROLLING STOCK MARKET BY LOCOMOTIVE TECHNOLOGY (THOUSAND UNITS) 2020-2030
TABLE 243 SAUDI ARABIA ROLLING STOCK MARKET BY PRODUCT TYPE (USD BILLION) 2020-2030
TABLE 244 SAUDI ARABIA ROLLING STOCK MARKET BY PRODUCT TYPE (THOUSAND UNITS) 2020-2030
TABLE 245 SOUTH AFRICA ROLLING STOCK MARKET BY COMPONENT (USD BILLION) 2020-2030
TABLE 246 SOUTH AFRICA ROLLING STOCK MARKET BY COMPONENT (THOUSAND UNITS) 2020-2030
TABLE 247 SOUTH AFRICA ROLLING STOCK MARKET BY APPLICATION (USD BILLION) 2020-2030
TABLE 248 SOUTH AFRICA ROLLING STOCK MARKET BY APPLICATION (THOUSAND UNITS) 2020-2030
TABLE 249 SOUTH AFRICA ROLLING STOCK MARKET BY LOCOMOTIVE TECHNOLOGY (USD BILLION) 2020-2030
TABLE 250 SOUTH AFRICA ROLLING STOCK MARKET BY LOCOMOTIVE TECHNOLOGY (THOUSAND UNITS) 2020-2030
TABLE 251 SOUTH AFRICA ROLLING STOCK MARKET BY PRODUCT TYPE (USD BILLION) 2020-2030
TABLE 252 SOUTH AFRICA ROLLING STOCK MARKET BY PRODUCT TYPE (THOUSAND UNITS) 2020-2030
TABLE 253 REST OF MIDDLE EAST AND AFRICA ROLLING STOCK MARKET BY VEHICLE TYPE (USD BILLION) 2020-2030
TABLE 254 REST OF MIDDLE EAST AND AFRICA ROLLING STOCK MARKET BY COMPONENT (THOUSAND UNITS) 2020-2030
TABLE 255 REST OF MIDDLE EAST AND AFRICA ROLLING STOCK MARKET BY APPLICATION (USD BILLION) 2020-2030
TABLE 256 REST OF MIDDLE EAST AND AFRICA ROLLING STOCK MARKET BY APPLICATION (THOUSAND UNITS) 2020-2030
TABLE 257 REST OF MIDDLE EAST AND AFRICA ROLLING STOCK MARKET BY LOCOMOTIVE TECHNOLOGY (USD BILLION) 2020-2030
TABLE 258 REST OF MIDDLE EAST AND AFRICA ROLLING STOCK MARKET BY LOCOMOTIVE TECHNOLOGY (THOUSAND UNITS) 2020-2030
TABLE 259 REST OF MIDDLE EAST AND AFRICA ROLLING STOCK MARKET BY PRODUCT TYPE (USD BILLION) 2020-2030
TABLE 260 REST OF MIDDLE EAST AND AFRICA ROLLING STOCK MARKET BY PRODUCT TYPE (THOUSAND UNITS) 2020-2030
LIST OF FIGURES
FIGURE 1 MARKET DYNAMICS
FIGURE 2 MARKET SEGMENTATION
FIGURE 3 REPORT TIMELINES: YEARS CONSIDERED
FIGURE 4 DATA TRIANGULATION
FIGURE 5 BOTTOM-UP APPROACH
FIGURE 6 TOP-DOWN APPROACH
FIGURE 7 RESEARCH FLOW
FIGURE 8 GLOBAL ROLLING STOCK MARKET BY PRODUCT TYPE USD BILLION, 2020-2030
FIGURE 9 GLOBAL ROLLING STOCK MARKET BY LOCOMOTIVE TECHNOLOGY USD BILLION, 2020-2030
FIGURE 10 GLOBAL ROLLING STOCK MARKET BY COMPONENT, USD BILLION, 2020-2030
FIGURE 11 GLOBAL ROLLING STOCK MARKET BY APPLICATION, USD BILLION, 2020-2030
FIGURE 12 GLOBAL ROLLING STOCK MARKET BY REGION, USD BILLION, 2020-2030
FIGURE 13 PORTER’S FIVE FORCES MODEL
FIGURE 14 GLOBAL ROLLING STOCK MARKET BY PRODUCT TYPE USD BILLION, 2022
FIGURE 15 GLOBAL ROLLING STOCK MARKET BY LOCOMOTIVE TECHNOLOGY, USD BILLION, 2022
FIGURE 16 GLOBAL ROLLING STOCK MARKET BY COMPONENT, USD BILLION, 2022
FIGURE 17 GLOBAL ROLLING STOCK MARKET BY APPLICATION, USD BILLION, 2022
FIGURE 18 GLOBAL ROLLING STOCK MARKET BY REGION, USD BILLION, 2022
FIGURE 19 MARKET SHARE ANALYSIS
FIGURE 20 ALSTOM: COMPANY SNAPSHOT
FIGURE 21 SIEMENS MOBILITY: COMPANY SNAPSHOT
FIGURE 22 CRRC CORPORATION LIMITED: COMPANY SNAPSHOT
FIGURE 23 BOMBARDIER TRANSPORTATION: COMPANY SNAPSHOT
FIGURE 24 HITACHI RAIL: COMPANY SNAPSHOT
FIGURE 25 STADLER RAIL: COMPANY SNAPSHOT
FIGURE 26 KAWASAKI HEAVY INDUSTRIES: COMPANY SNAPSHOT
FIGURE 27 TALGO: COMPANY SNAPSHOT
FIGURE 28 HYUNDAI ROTEM: COMPANY SNAPSHOT
FIGURE 29 ŠKODA TRANSPORTATION: COMPANY SNAPSHOT
FIGURE 30 WABTEC CORPORATION: COMPANY SNAPSHOT
FIGURE 31 KNORR-BREMSE: COMPANY SNAPSHOT
FIGURE 32 ANSALDO STS: COMPANY SNAPSHOT
FIGURE 33 TOSHIBA INFRASTRUCTURE SYSTEMS & SOLUTIONS CORPORATION: COMPANY SNAPSHOT
DOWNLOAD FREE SAMPLE REPORT
License Type
SPEAK WITH OUR ANALYST
Want to know more about the report or any specific requirement?
WANT TO CUSTOMIZE THE REPORT?
Our Clients Speak
We asked them to research ‘ Equipment market’ all over the world, and their whole arrangement was helpful to us. thehealthanalytics.com insightful analysis and reports contributed to our current analysis and in creating a future strategy. Besides, the te
Yosuke Mitsui
Senior Associate Construction Equipment Sales & Marketing
We asked them to research ‘Equipment market’ all over the world, and their whole arrangement was helpful to us. thehealthanalytics.com insightful analysis and reports contributed to our current analysis and in creating a future strategy. Besides, the te


