

Base Year Value ()
x.x %
x.x %
CAGR ()
x.x %
x.x %
Forecast Year Value ()
x.x %
x.x %
Historical Data Period
Largest Region
Forecast Period
수직(석유 및 가스, 건설, 에너지 및 전력, 기타), 서비스(운송, 창고, 재고 관리, 창고) 및 지역별 프로젝트 물류 시장, 2023년부터 2030년까지의 글로벌 추세 및 예측
Instant access to hundreds of data points and trends
- Market estimates from 2014-2029
- Competitive analysis, industry segmentation, financial benchmarks
- Incorporates SWOT, Porter's Five Forces and risk management frameworks
- PDF report or online database with Word, Excel and PowerPoint export options
- 100% money back guarantee
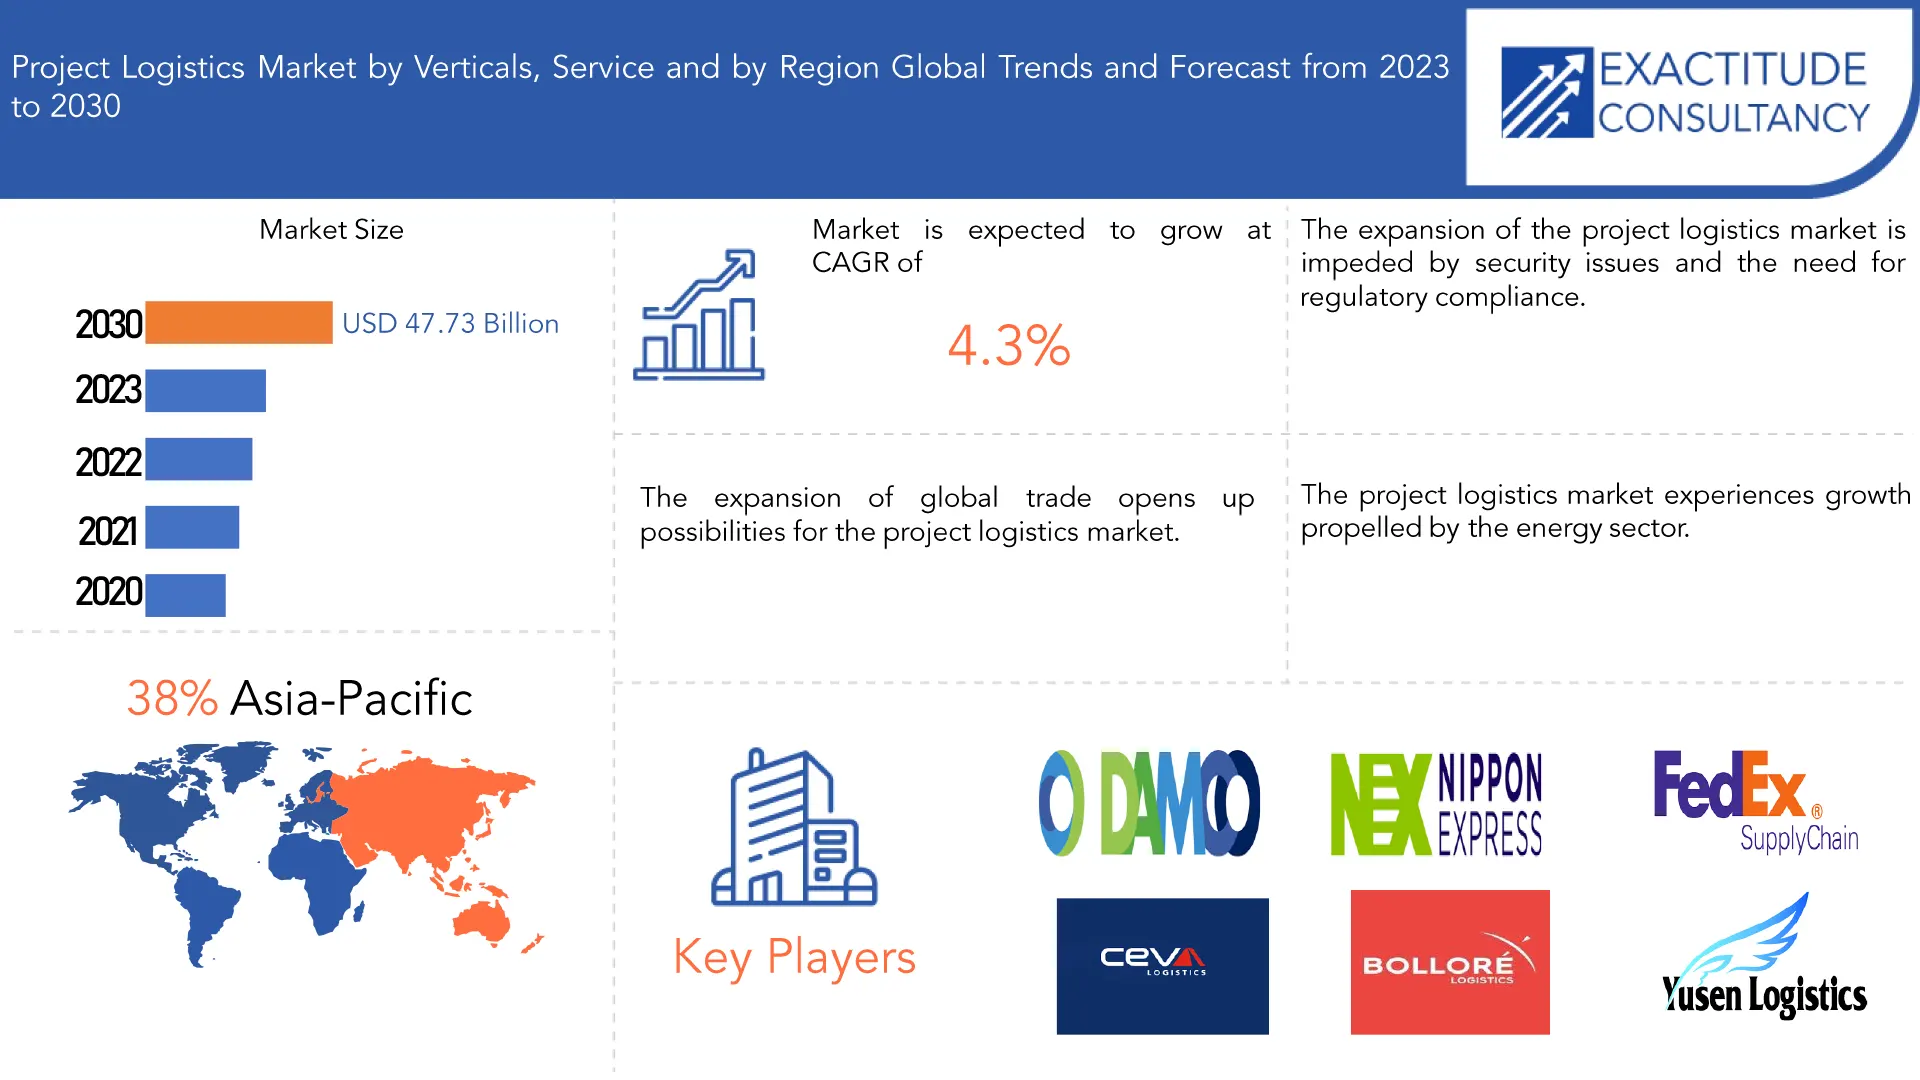
프로젝트 물류 시장 개요
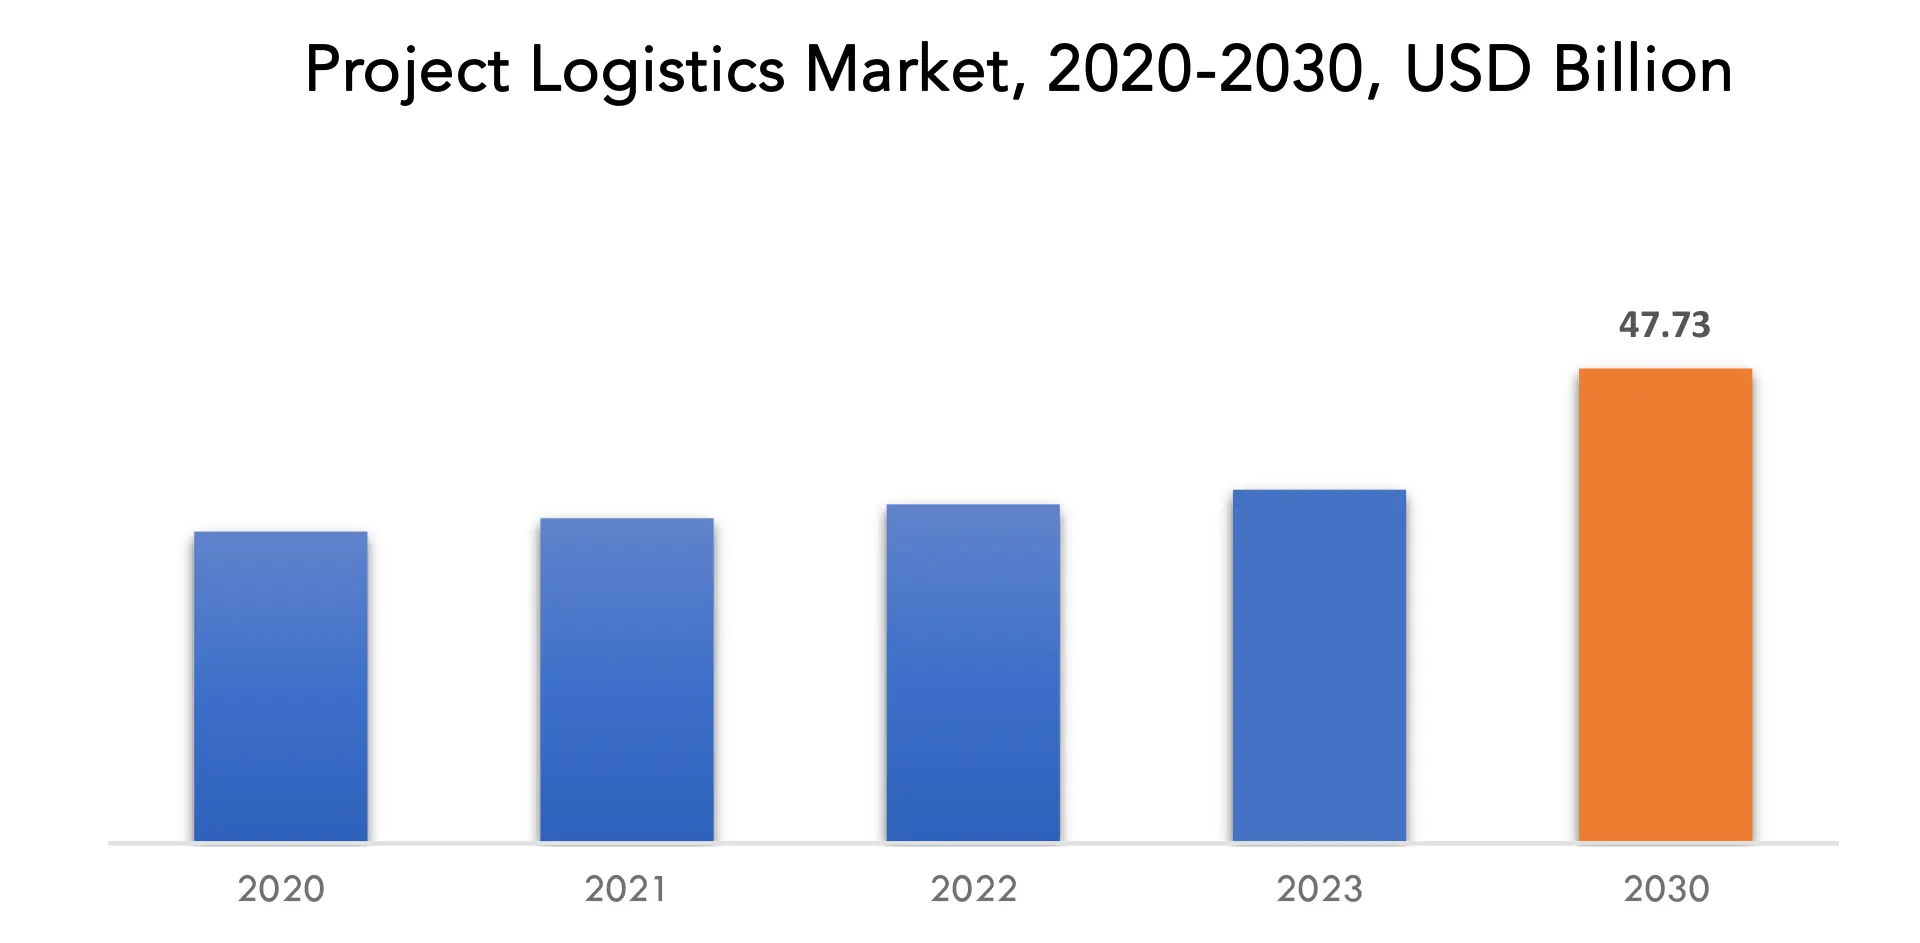
글로벌 프로젝트 물류 시장은 2022년 340억 7,800만 달러에서 2030년 477 억 3,000만 달러로 성장할 것으로 예상되며, 이는 예측 기간 동안 4.3%의 CAGR입니다.
프로젝트 물류는 프로젝트 내에서 자원과 활동의 원활하고 효율적인 흐름을 보장하기 위한 다양한 작업의 전략적 계획, 조정 및 실행을 포함합니다. 이 다면적인 분야는 프로젝트 목표를 달성하기 위한 자재, 인력, 정보 및 시간 관리를 포함합니다. 프로젝트 물류의 핵심 구성 요소에는 공급망 관리 , 운송, 재고 관리 및 유통이 포함됩니다. 이러한 요소의 효율적인 조정은 프로젝트 일정과 예산 제약을 충족하는 데 중요합니다. 프로젝트 관리자는 물류 전문가와 긴밀히 협력하여 자원 할당을 최적화하고 지연을 최소화하며 위험을 완화합니다. 효과적인 커뮤니케이션은 팀원과 이해 관계자 간의 협업을 용이하게 하기 때문에 프로젝트 물류에서 가장 중요합니다. 여기에는 명확한 문서화, 정기적인 업데이트 및 예상치 못한 과제를 해결하기 위한 비상 계획이 포함됩니다. 최첨단 소프트웨어를 활용하여 데이터를 추적, 모니터링, 분석하여 현명한 결정을 내리는 것은 기술이 중요한 역할을 하는 한 가지 방법입니다. 프로젝트 성공과 전반적인 조직 효율성은 궁극적으로 효과적인 프로젝트 물류에 영향을 받으며, 이는 필요할 때 적절한 리소스를 사용할 수 있음을 보장합니다. 프로젝트 목표를 달성하려면 전략적 접근 방식, 변화하는 상황에 대한 유연성, 프로세스 최적화에 대한 날카로운 집중이 필요합니다. 글로벌 공급망에서 프로젝트 물류 시장은 원산지에서 목적지까지 자재와 상품의 원활한 흐름에 필수적입니다. 이 산업에는 유통, 창고, 운송, 프로젝트 조정과 같은 광범위한 업무가 포함됩니다. 프로젝트 물류 시장에 대한 포괄적인 개요는 역동성을 형성하는 주요 추세, 과제 및 기회를 보여줍니다. [캡션 id="attachment_34616" align="aligncenter" width="1920"]
| 기인하다 | 세부 |
| 학습 기간 | 2020-2030 |
| 기준년도 | 2022 |
| 추정 연도 | 2023 |
| 예상 연도 | 2023-2030 |
| 역사적 기간 | 2019-2021 |
| 단위 | 가치(USD 10억) (천 단위) |
| 분할 | 수직별, 서비스별 및 지역별 |
| 수직별 |
|
| 서비스별로 |
|
| 지역별로 |
|
Frequently Asked Questions
What is the market size for the project logistics market?
The global macarons market is anticipated to grow from USD 755.35 Billion in 2022 to USD 1,357.21 Billion by 2030, at a CAGR of 7.60% during the forecast period.
Which region is domaining in the project logistics market?
Asia-Pacific accounted for the largest market in the macarons market. Asia-Pacific accounted for the 38 % percent market share of the global market value.
Who are the major key players in the project logistics market?
DHL Global Forwarding, Kuehne + Nagel, DB Schenker, Panalpina, CEVA Logistics, Expeditors International, Agility, Bolloré Logistics, Geodis, UPS Supply Chain Solutions, FedEx Supply Chain, C.H. Robinson, Yusen Logistics, DSV Panalpina, Penske Logistics, Nippon Express, Sinotrans, DAMCO, Hellmann Worldwide Logistics, Rhenus Group are some of the major key players in the project logistics market.
What are the opportunities in the project logistics market?
The project logistics market presents substantial opportunities for growth and innovation. With the increasing complexity of global supply chains, there is a rising demand for efficient and specialized logistics solutions. Emerging technologies, such as blockchain and artificial intelligence, offer avenues for optimization and enhanced visibility. Sustainability concerns also drive the need for eco-friendly transportation and packaging solutions. The ongoing expansion of e-commerce and cross-border trade further amplifies the demand for robust project logistics services. Companies that can navigate these trends and provide agile, cost-effective, and sustainable solutions are well-positioned to capitalize on the dynamic opportunities within the project logistics market.
Project Logistics Market Segmentation Analysis:
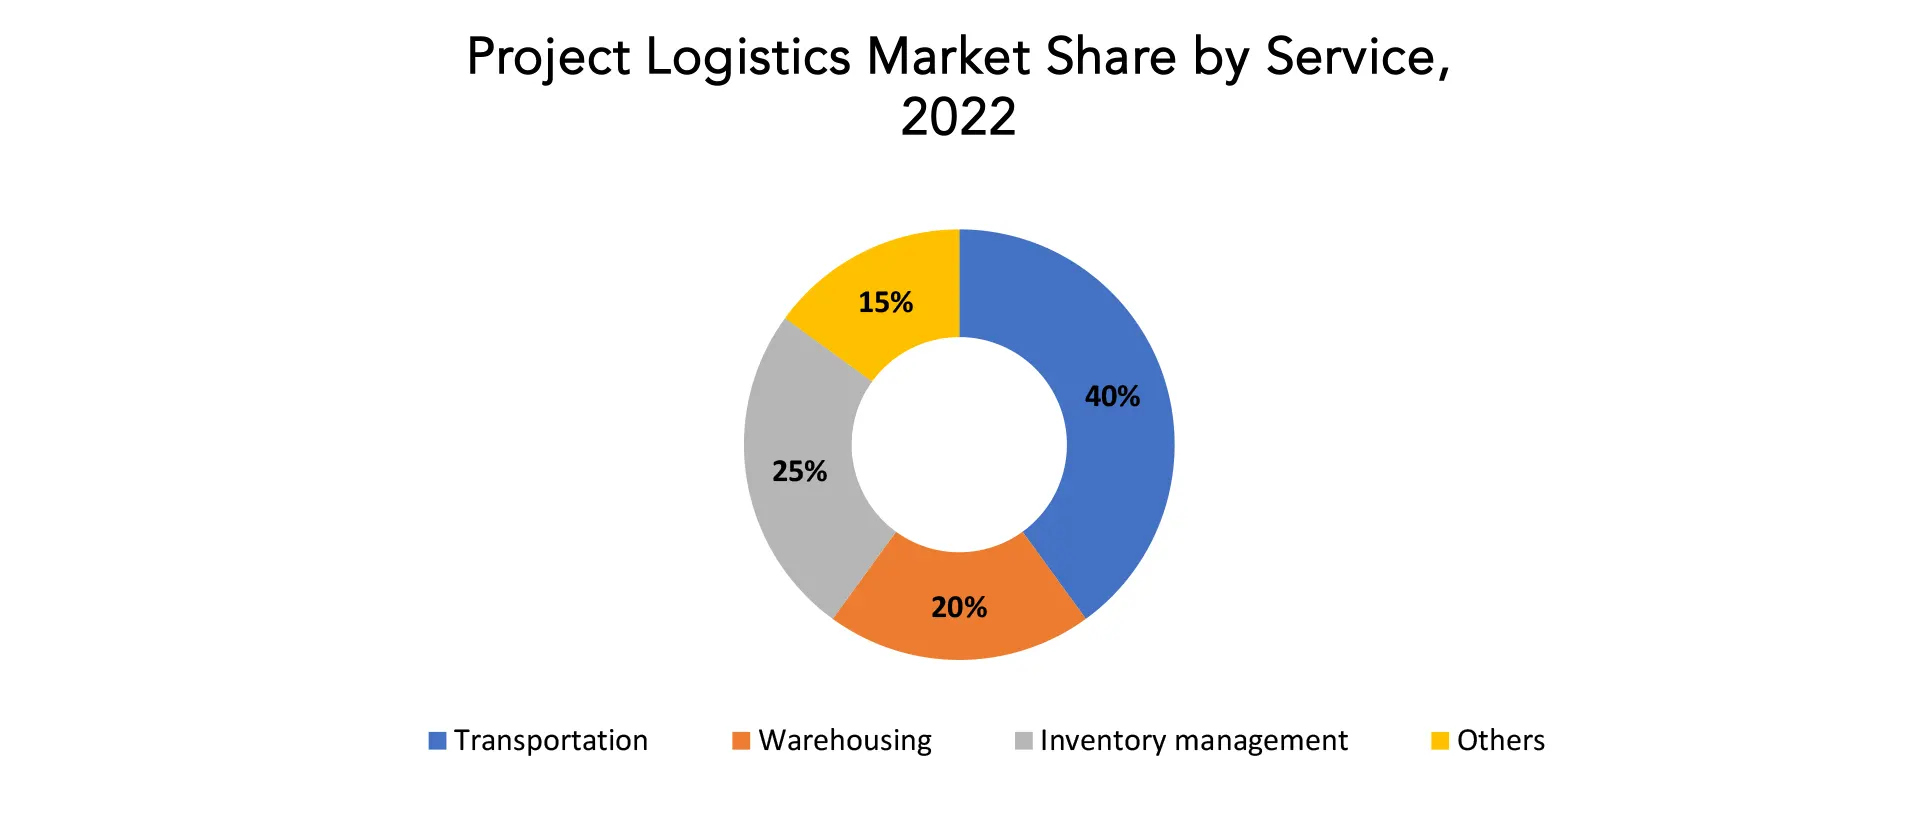
The project logistics market is divided into 3 segments. By verticals the market is bifurcated into oil and gas, construction, energy and power, other. By service the market is bifurcated into transportation, warehousing, inventory management, others. The successful execution of oil and gas projects relies heavily on efficient and well-managed logistics. From exploration to production, each phase demands meticulous planning and execution to ensure timely delivery of equipment, materials, and personnel to remote and challenging locations. One of the primary challenges in oil and gas logistics is the need to transport heavy and oversized equipment to often remote and inhospitable locations. This necessitates careful route planning, coordination with various transportation modes, and compliance with regulatory requirements. Specialized carriers capable of handling oversized loads play a crucial role in overcoming these challenges, ensuring that essential equipment reaches its destination safely and on schedule. In addition to physical challenges, oil and gas projects are often subject to geopolitical and environmental factors. Supply chains may be at risk from political unrest in some areas, so businesses may need to diversify their sourcing approaches and create backup plans. Environmental factors are also important, since the industry is under growing pressure to use sustainable practices. This entails minimizing transportation's negative environmental effects and implementing carbon-emissions-reducing technologies. The effective management of inventory is another critical aspect of oil and gas project logistics. It's hard to keep an accurate and current inventory in the vast and remote places where projects are frequently located. Project managers can monitor the movement of materials and equipment in real time by using advanced technologies like real-time tracking systems and radio-frequency identification (RFID) to improve visibility. Better decision-making is facilitated by this, and it also helps avoid delays and cost overruns. [caption id="attachment_34637" align="aligncenter" width="1920"]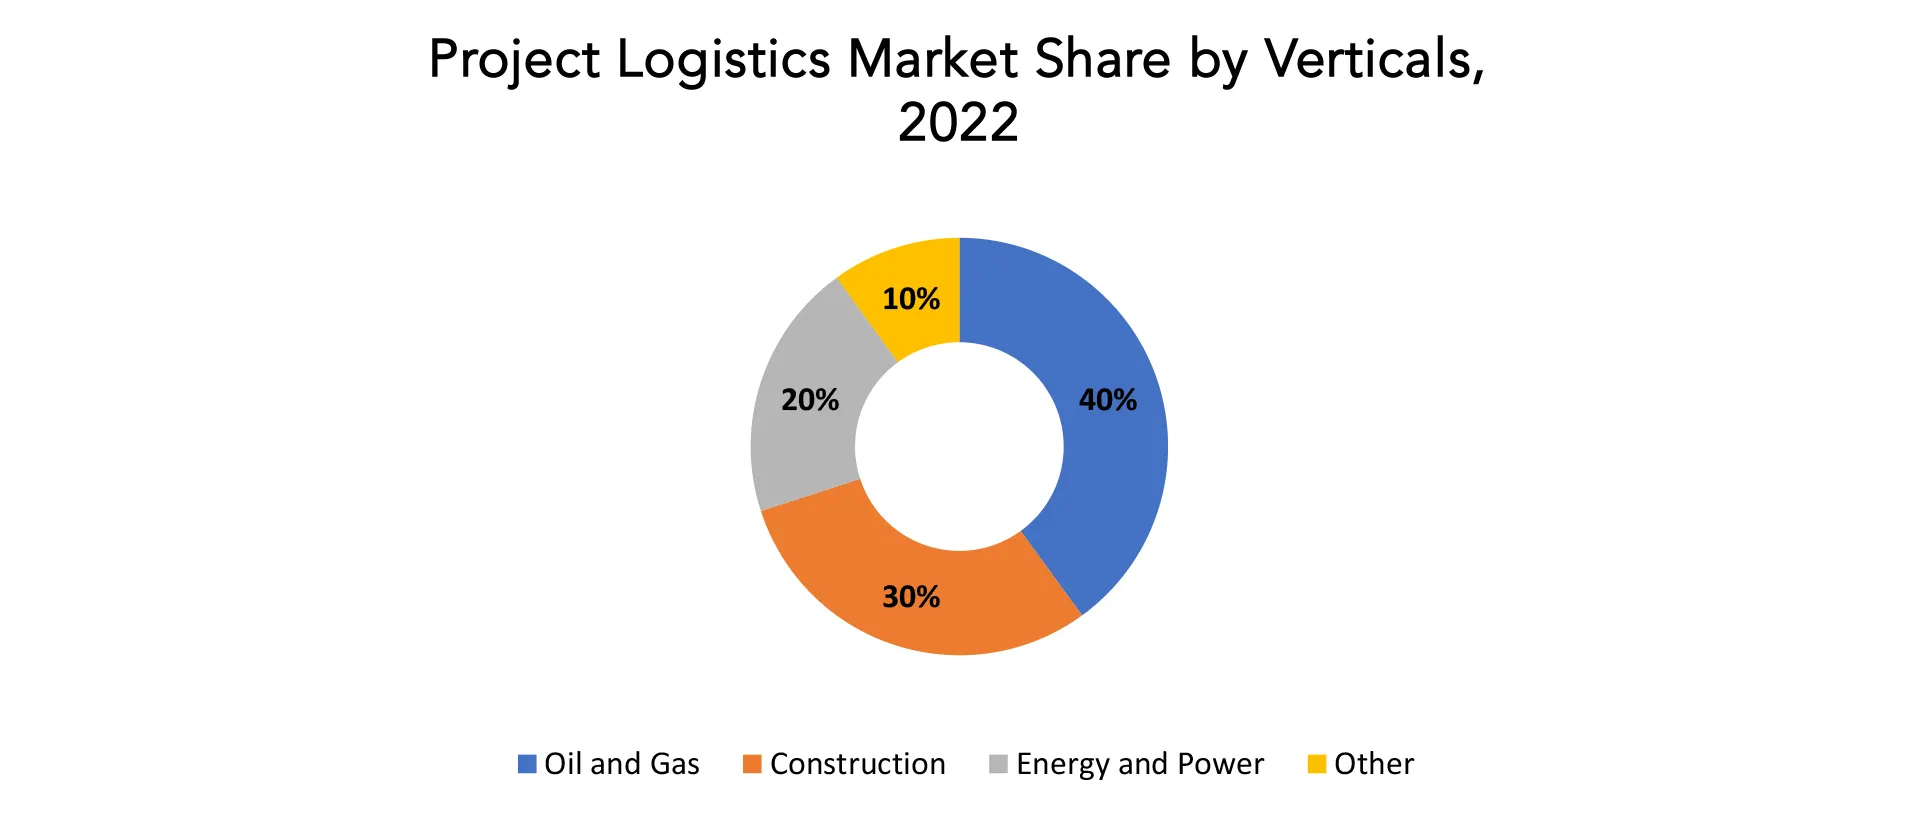
Project Logistics Market Trends
- The logistics industry, including project logistics, has been undergoing digital transformation. Technologies like Internet of Things (IoT), blockchain, and data analytics are being increasingly adopted to enhance visibility, efficiency, and transparency in supply chain operations.
- The logistics industry is increasingly focusing on sustainability. To lessen their impact on the environment, businesses are implementing greener strategies, such as using electric vehicles, eco-friendly packaging, and eco-friendly warehouses.
- Project logistics is often associated with large-scale, complex projects that span multiple countries. As globalization continues, the demand for efficient and reliable project logistics solutions has increased.
- With disruptions such as the COVID-19 pandemic highlighting the importance of supply chain resilience, companies are placing greater emphasis on risk management strategies. This includes diversifying suppliers, building redundancy into supply chains, and adopting technologies that enhance visibility and agility.
- Collaboration within the logistics ecosystem is on the rise. Companies are forming strategic partnerships and alliances to enhance their capabilities, expand their reach, and provide end-to-end solutions for project logistics.
- The growth of e-commerce has influenced logistics across the board, including project logistics. The need for timely and cost-effective delivery of goods has led to innovations and optimizations in transportation and distribution networks.
- Ongoing changes in international trade agreements, tariffs, and customs regulations can significantly impact project logistics. Companies need to stay informed about these changes to ensure compliance and minimize disruptions.
- The use of advanced analytics, machine learning, and predictive technologies is helping companies optimize their logistics operations. This includes demand forecasting, route optimization, and predictive maintenance for transportation assets.
- Remote monitoring and IoT technologies play a crucial role in tracking the location and condition of goods in transit. This is particularly important in project logistics, where the movement of large and valuable assets requires close monitoring.
- Customers increasingly expect real-time visibility, accurate tracking, and on-time delivery. Meeting and exceeding these expectations is a key focus for companies in the project logistics market.
Competitive Landscape
The competitive landscape of the project logistics market is diverse and includes various players, from multinational corporations to artisanal and specialty brands.- DHL Global Forwarding
- Kuehne + Nagel
- DB Schenker
- Panalpina
- CEVA Logistics
- Expeditors International
- Agility
- Bolloré Logistics
- Geodis
- UPS Supply Chain Solutions
- FedEx Supply Chain
- C.H. Robinson
- Yusen Logistics
- DSV Panalpina
- Penske Logistics
- Nippon Express
- Sinotrans
- DAMCO
- Hellmann Worldwide Logistics
- Rhenus Group
Recent Development
- On 15th December 2021 - Aprojects Austria, a member of the Project Logistics Alliance, joined forces together with their long-trusted partner, Antwerp Metal Logistics, to ship heavy loads comprising: A reactor weighing 359 tons, a pool condenser weighing 286 tons and a stripper weighing 243 tons.
- On 2ndAugust 2023 - Huisman has been awarded a contract by Seaway7, part of Subsea7 Group, for the delivery of the entire monopile installation spread for jack-up vessel Seaway Ventus, consisting of a Monopile Gripper, an Upending Frame, and two sets of Monopile Storage Cradles.
Target Audience for Project Logistics Market
- Manufacturers and Suppliers
- Construction Companies
- Energy and Oil Companies
- Infrastructure Development Firms
- Government Agencies
- Mining Companies
- Aerospace and Defense Manufacturers
- Technology and Telecommunications Companies
- Pharmaceutical Companies
- E-commerce and Retailers
- Engineering and Project Management Firms
- Environmental and Renewable Energy Companies
Import & Export Data for Project Logistics Market
Exactitude consultancy provides import and export data for the recent years. It also offers insights on production and consumption volume of the product. Understanding the import and export data is pivotal for any player in the project logistics market. This knowledge equips businesses with strategic advantages, such as:- Identifying emerging markets with untapped potential.
- Adapting supply chain strategies to optimize cost-efficiency and market responsiveness.
- Navigating competition by assessing major players' trade dynamics.
- Trade volume trends: our report dissects import and export data spanning the last five years to reveal crucial trends and growth patterns within the global project logistics market. This data-driven exploration empowers readers with a deep understanding of the market's trajectory.
- Market players: gain insights into the leading players driving the Surgical Drill trade. From established giants to emerging contenders, our analysis highlights the key contributors to the import and export landscape.
- Geographical dynamics: delve into the geographical distribution of trade activities. Uncover which regions dominate exports and which ones hold the reins on imports, painting a comprehensive picture of the industry's global footprint.
- Product breakdown: by segmenting data based on Surgical Drill types –– we provide a granular view of trade preferences and shifts, enabling businesses to align strategies with the evolving technological landscape.
Segments Covered in the Project Logistics Market Report
Project Logistics Market by Verticals 2020-2030, USD Billion, (Thousand Units)- Oil and Gas
- Construction
- Energy and Power
- Other
- Transportation
- Warehousing
- Inventory Management
- Other
- North America
- Europe
- Asia Pacific
- South America
- Middle East and Africa
Key Question Answered
- What is the expected growth rate of the project logistics market over the next 7 years?
- Who are the major players in the project logistics market and what is their market share?
- What are the end-user industries driving market demand and what is their outlook?
- What are the opportunities for growth in emerging markets such as Asia-Pacific, the middle east, and Africa?
- How is the economic environment affecting the project logistics market, including factors such as interest rates, inflation, and exchange rates?
- What is the expected impact of government policies and regulations on the project logistics market?
- What is the current and forecasted size and growth rate of the project logistics market?
- What are the key drivers of growth in the project logistics market?
- Who are the major players in the market and what is their market share?
- What are the distribution channels and supply chain dynamics in the project logistics market?
- What are the technological advancements and innovations in the project logistics market and their impact on product development and growth?
- What are the regulatory considerations and their impact on the market?
- What are the challenges faced by players in the project logistics market and how are they addressing these challenges?
- What are the opportunities for growth and expansion in the project logistics market?
- What are the products and specifications of leading players in the market?
INTRODUCTION
(BUSINESS OVERVIEW, COMPANY SNAPSHOT, VERTICALS OFFERED, RECENT DEVELOPMENTS)
*THE COMPANY LIST IS INDICATIVE
LIST OF TABLES
TABLE 1 GLOBAL PROJECT LOGISTICS MARKET BY SERVICE (USD BILLION) 2020-2030
TABLE 2 GLOBAL PROJECT LOGISTICS MARKET BY SERVICE (THOUSAND UNITS) 2020-2030
TABLE 3 GLOBAL PROJECT LOGISTICS MARKET BY VERTICALS (USD BILLION) 2020-2030
TABLE 4 GLOBAL PROJECT LOGISTICS MARKET BY VERTICALS (THOUSAND UNITS) 2020-2030
TABLE 5 GLOBAL PROJECT LOGISTICS MARKET BY REGION (USD BILLION) 2020-2030
TABLE 6 GLOBAL PROJECT LOGISTICS MARKET BY REGION (THOUSAND UNITS) 2020-2030
TABLE 7 NORTH AMERICA PROJECT LOGISTICS MARKET BY COUNTRY (USD BILLION)
2020-2030
TABLE 8 NORTH AMERICA PROJECT LOGISTICS MARKET BY COUNTRY (THOUSAND UNITS)
2020-2030
TABLE 9 NORTH AMERICA PROJECT LOGISTICS MARKET BY SERVICE (USD BILLION) 2020-2030
TABLE 10 NORTH AMERICA PROJECT LOGISTICS MARKET BY SERVICE (THOUSAND UNITS) 2020-2030
TABLE 11 NORTH AMERICA PROJECT LOGISTICS MARKET BY VERTICALS (USD BILLION) 2020-2030
TABLE 12 NORTH AMERICA PROJECT LOGISTICS MARKET BY VERTICALS (THOUSAND UNITS) 2020-2030
TABLE 13 US PROJECT LOGISTICS MARKET BY SERVICE (USD BILLION) 2020-2030
TABLE 14 US PROJECT LOGISTICS MARKET BY SERVICE (THOUSAND UNITS) 2020-2030
TABLE 15 US PROJECT LOGISTICS MARKET BY VERTICALS (USD BILLION) 2020-2030
TABLE 16 US PROJECT LOGISTICS MARKET BY VERTICALS (THOUSAND UNITS) 2020-2030
TABLE 17 CANADA PROJECT LOGISTICS MARKET BY SERVICE (USD BILLION) 2020-2030
TABLE 18 CANADA PROJECT LOGISTICS MARKET BY SERVICE (THOUSAND UNITS) 2020-2030
TABLE 19 CANADA PROJECT LOGISTICS MARKET BY VERTICALS (USD BILLION) 2020-2030
TABLE 20 CANADA PROJECT LOGISTICS MARKET BY VERTICALS (THOUSAND UNITS) 2020-2030
TABLE 21 MEXICO PROJECT LOGISTICS MARKET BY SERVICE (USD BILLION) 2020-2030
TABLE 22 MEXICO PROJECT LOGISTICS MARKET BY SERVICE (THOUSAND UNITS) 2020-2030
TABLE 23 MEXICO PROJECT LOGISTICS MARKET BY VERTICALS (USD BILLION) 2020-2030
TABLE 24 MEXICO PROJECT LOGISTICS MARKET BY VERTICALS (THOUSAND UNITS) 2020-2030
TABLE 25 SOUTH AMERICA PROJECT LOGISTICS MARKET BY COUNTRY (USD BILLION) 2020-2030
TABLE 26 SOUTH AMERICA PROJECT LOGISTICS MARKET BY COUNTRY (THOUSAND UNITS) 2020-2030
TABLE 27 SOUTH AMERICA PROJECT LOGISTICS MARKET BY SERVICE (USD BILLION) 2020-2030
TABLE 28 SOUTH AMERICA PROJECT LOGISTICS MARKET BY SERVICE (THOUSAND UNITS) 2020-2030
TABLE 29 SOUTH AMERICA PROJECT LOGISTICSMARKET BY VERTICALS (USD BILLION) 2020-2030
TABLE 30 SOUTH AMERICA PROJECT LOGISTICS MARKET BY VERTICALS (THOUSAND UNITS) 2020-2030
TABLE 31 BRAZIL PROJECT LOGISTICS MARKET BY SERVICE (USD BILLION) 2020-2030
TABLE 32 BRAZIL PROJECT LOGISTICS MARKET BY SERVICE (THOUSAND UNITS) 2020-2030
TABLE 33 BRAZIL PROJECT LOGISTICS MARKET BY VERTICALS (USD BILLION) 2020-2030
TABLE 34 BRAZIL PROJECT LOGISTICS MARKET BY VERTICALS (THOUSAND UNITS) 2020-2030
TABLE 35 ARGENTINA PROJECT LOGISTICSMARKET BY SERVICE (USD BILLION) 2020-2030
TABLE 36 ARGENTINA PROJECT LOGISTICS MARKET BY SERVICE (THOUSAND UNITS) 2020-2030
TABLE 37 ARGENTINA PROJECT LOGISTICS MARKET BY VERTICALS (USD BILLION) 2020-2030
TABLE 38 ARGENTINA PROJECT LOGISTICS MARKET BY VERTICALS (THOUSAND UNITS) 2020-2030
TABLE 39 COLOMBIA PROJECT LOGISTICS MARKET BY SERVICE (USD BILLION) 2020-2030
TABLE 40 COLOMBIA PROJECT LOGISTICS MARKET BY SERVICE (THOUSAND UNITS) 2020-2030
TABLE 41 COLOMBIA PROJECT LOGISTICS MARKET BY VERTICALS (USD BILLION) 2020-2030
TABLE 42 COLOMBIA PROJECT LOGISTICS MARKET BY VERTICALS (THOUSAND UNITS) 2020-2030
TABLE 43 REST OF SOUTH AMERICA PROJECT LOGISTICS MARKET BY SERVICE (USD BILLION) 2020-2030
TABLE 44 REST OF SOUTH AMERICA PROJECT LOGISTICS MARKET BY SERVICE (THOUSAND UNITS) 2020-2030
TABLE 45 REST OF SOUTH AMERICA PROJECT LOGISTICS MARKET BY VERTICALS (USD BILLION) 2020-2030
TABLE 46 REST OF SOUTH AMERICA PROJECT LOGISTICS MARKET BY VERTICALS (THOUSAND UNITS) 2020-2030
TABLE 47 ASIA-PACIFIC PROJECT LOGISTICS MARKET BY COUNTRY (USD BILLION) 2020-2030
TABLE 48 ASIA-PACIFIC PROJECT LOGISTICS MARKET BY COUNTRY (THOUSAND UNITS) 2020-2030
TABLE 49 ASIA-PACIFIC PROJECT LOGISTICS MARKET BY SERVICE (USD BILLION) 2020-2030
TABLE 50 ASIA-PACIFIC PROJECT LOGISTICS MARKET BY SERVICE (THOUSAND UNITS) 2020-2030
TABLE 51 ASIA-PACIFIC PROJECT LOGISTICS MARKET BY VERTICALS (USD BILLION) 2020-2030
TABLE 52 ASIA-PACIFIC PROJECT LOGISTICS MARKET BY VERTICALS (THOUSAND UNITS) 2020-2030
TABLE 53 INDIA PROJECT LOGISTICS MARKET BY SERVICE (USD BILLION) 2020-2030
TABLE 54 INDIA PROJECT LOGISTICS MARKET BY SERVICE (THOUSAND UNITS) 2020-2030
TABLE 55 INDIA PROJECT LOGISTICS MARKET BY VERTICALS (USD BILLION) 2020-2030
TABLE 56 INDIA PROJECT LOGISTICS MARKET BY VERTICALS (THOUSAND UNITS) 2020-2030
TABLE 57 CHINA PROJECT LOGISTICS MARKET BY SERVICE (USD BILLION) 2020-2030
TABLE 58 CHINA PROJECT LOGISTICS MARKET BY SERVICE (THOUSAND UNITS) 2020-2030
TABLE 59 CHINA PROJECT LOGISTICS MARKET BY VERTICALS (USD BILLION) 2020-2030
TABLE 60 CHINA PROJECT LOGISTICS MARKET BY VERTICALS (THOUSAND UNITS) 2020-2030
TABLE 61 JAPAN PROJECT LOGISTICS MARKET BY SERVICE (USD BILLION) 2020-2030
TABLE 62 JAPAN PROJECT LOGISTICS MARKET BY SERVICE (THOUSAND UNITS) 2020-2030
TABLE 63 JAPAN PROJECT LOGISTICS MARKET BY VERTICALS (USD BILLION) 2020-2030
TABLE 64 JAPAN PROJECT LOGISTICS MARKET BY VERTICALS (THOUSAND UNITS) 2020-2030
TABLE 65 SOUTH KOREA PROJECT LOGISTICS MARKET BY SERVICE (USD BILLION) 2020-2030
TABLE 66 SOUTH KOREA PROJECT LOGISTICS MARKET BY SERVICE (THOUSAND UNITS) 2020-2030
TABLE 67 SOUTH KOREA PROJECT LOGISTICS MARKET BY VERTICALS (USD BILLION) 2020-2030
TABLE 68 SOUTH KOREA PROJECT LOGISTICS MARKET BY VERTICALS (THOUSAND UNITS) 2020-2030
TABLE 69 AUSTRALIA PROJECT LOGISTICS MARKET BY SERVICE (USD BILLION) 2020-2030
TABLE 70 AUSTRALIA PROJECT LOGISTICS MARKET BY SERVICE (THOUSAND UNITS) 2020-2030
TABLE 71 AUSTRALIA PROJECT LOGISTICS MARKET BY VERTICALS (USD BILLION) 2020-2030
TABLE 72 AUSTRALIA PROJECT LOGISTICS MARKET BY VERTICALS (THOUSAND UNITS) 2020-2030
TABLE 73 SOUTH-EAST ASIA PROJECT LOGISTICS MARKET BY SERVICE (USD BILLION) 2020-2030
TABLE 74 SOUTH-EAST ASIA PROJECT LOGISTICS MARKET BY SERVICE (THOUSAND UNITS) 2020-2030
TABLE 75 SOUTH-EAST ASIA PROJECT LOGISTICS MARKET BY VERTICALS (USD BILLION) 2020-2030
TABLE 76 SOUTH-EAST ASIA PROJECT LOGISTICS MARKET BY VERTICALS (THOUSAND UNITS) 2020-2030
TABLE 77 REST OF ASIA PACIFIC PROJECT LOGISTICS MARKET BY SERVICE (USD BILLION) 2020-2030
TABLE 78 REST OF ASIA PACIFIC PROJECT LOGISTICS MARKET BY SERVICE (THOUSAND UNITS) 2020-2030
TABLE 79 REST OF ASIA PACIFIC PROJECT LOGISTICS MARKET BY VERTICALS (USD BILLION) 2020-2030
TABLE 80 REST OF ASIA PACIFIC PROJECT LOGISTICS MARKET BY VERTICALS (THOUSAND UNITS) 2020-2030
TABLE 81 EUROPE PROJECT LOGISTICS MARKET BY COUNTRY (USD BILLION) 2020-2030
TABLE 82 EUROPE PROJECT LOGISTICS MARKET BY COUNTRY (THOUSAND UNITS) 2020-2030
TABLE 83 EUROPE PROJECT LOGISTICS MARKET BY SERVICE (USD BILLION) 2020-2030
TABLE 84 EUROPE PROJECT LOGISTICS MARKET BY SERVICE (THOUSAND UNITS) 2020-2030
TABLE 85 EUROPE PROJECT LOGISTICS MARKET BY VERTICALS (USD BILLION) 2020-2030
TABLE 86 EUROPE PROJECT LOGISTICS MARKET BY VERTICALS (THOUSAND UNITS) 2020-2030
TABLE 87 GERMANY PROJECT LOGISTICS MARKET BY SERVICE (USD BILLION) 2020-2030
TABLE 88 GERMANY PROJECT LOGISTICS MARKET BY SERVICE (THOUSAND UNITS) 2020-2030
TABLE 89 GERMANY PROJECT LOGISTICS MARKET BY VERTICALS (USD BILLION) 2020-2030
TABLE 90 GERMANY PROJECT LOGISTICS MARKET BY VERTICALS (THOUSAND UNITS) 2020-2030
TABLE 91 UK PROJECT LOGISTICS MARKET BY SERVICE (USD BILLION) 2020-2030
TABLE 92 UK PROJECT LOGISTICS MARKET BY SERVICE (THOUSAND UNITS) 2020-2030
TABLE 93 UK PROJECT LOGISTICS MARKET BY VERTICALS (USD BILLION) 2020-2030
TABLE 94 UK PROJECT LOGISTICS MARKET BY VERTICALS (THOUSAND UNITS) 2020-2030
TABLE 95 FRANCE PROJECT LOGISTICS MARKET BY SERVICE (USD BILLION) 2020-2030
TABLE 96 FRANCE PROJECT LOGISTICS MARKET BY SERVICE (THOUSAND UNITS) 2020-2030
TABLE 97 FRANCE PROJECT LOGISTICS MARKET BY VERTICALS (USD BILLION) 2020-2030
TABLE 98 FRANCE PROJECT LOGISTICS MARKET BY VERTICALS (THOUSAND UNITS) 2020-2030
TABLE 99 ITALY PROJECT LOGISTICS MARKET BY SERVICE (USD BILLION) 2020-2030
TABLE 100 ITALY PROJECT LOGISTICS MARKET BY SERVICE (THOUSAND UNITS) 2020-2030
TABLE 101 ITALY PROJECT LOGISTICS MARKET BY VERTICALS (USD BILLION) 2020-2030
TABLE 102 ITALY PROJECT LOGISTICS MARKET BY VERTICALS (THOUSAND UNITS) 2020-2030
TABLE 103 SPAIN PROJECT LOGISTICS MARKET BY SERVICE (USD BILLION) 2020-2030
TABLE 104 SPAIN PROJECT LOGISTICS MARKET BY SERVICE (THOUSAND UNITS) 2020-2030
TABLE 105 SPAIN PROJECT LOGISTICS MARKET BY VERTICALS (USD BILLION) 2020-2030
TABLE 106 SPAIN PROJECT LOGISTICS MARKET BY VERTICALS (THOUSAND UNITS) 2020-2030
TABLE 107 RUSSIA PROJECT LOGISTICS MARKET BY SERVICE (USD BILLION) 2020-2030
TABLE 108 RUSSIA PROJECT LOGISTICS MARKET BY SERVICE (THOUSAND UNITS) 2020-2030
TABLE 109 RUSSIA PROJECT LOGISTICS MARKET BY VERTICALS (USD BILLION) 2020-2030
TABLE 110 RUSSIA PROJECT LOGISTICS MARKET BY VERTICALS (THOUSAND UNITS) 2020-2030
TABLE 111 REST OF EUROPE PROJECT LOGISTICS MARKET BY SERVICE (USD BILLION) 2020-2030
TABLE 112 REST OF EUROPE PROJECT LOGISTICS MARKET BY SERVICE (THOUSAND UNITS) 2020-2030
TABLE 113 REST OF EUROPE PROJECT LOGISTICS MARKET BY VERTICALS (USD BILLION) 2020-2030
TABLE 114 REST OF EUROPE PROJECT LOGISTICS MARKET BY VERTICALS (THOUSAND UNITS) 2020-2030
TABLE 115 MIDDLE EAST AND AFRICA PROJECT LOGISTICS MARKET BY COUNTRY (USD BILLION) 2020-2030
TABLE 116 MIDDLE EAST AND AFRICA PROJECT LOGISTICS MARKET BY COUNTRY (THOUSAND UNITS) 2020-2030
TABLE 117 MIDDLE EAST AND AFRICA PROJECT LOGISTICS MARKET BY SERVICE (USD BILLION) 2020-2030
TABLE 118 MIDDLE EAST AND AFRICA PROJECT LOGISTICS MARKET BY SERVICE (THOUSAND UNITS) 2020-2030
TABLE 119 MIDDLE EAST AND AFRICA PROJECT LOGISTICS MARKET BY VERTICALS (USD BILLION) 2020-2030
TABLE 120 MIDDLE EAST AND AFRICA PROJECT LOGISTICS MARKET BY VERTICALS (THOUSAND UNITS) 2020-2030
TABLE 121 UAE PROJECT LOGISTICS MARKET BY SERVICE (USD BILLION) 2020-2030
TABLE 122 UAE PROJECT LOGISTICS MARKET BY SERVICE (THOUSAND UNITS) 2020-2030
TABLE 123 UAE PROJECT LOGISTICS MARKET BY VERTICALS (USD BILLION) 2020-2030
TABLE 124 UAE PROJECT LOGISTICS MARKET BY VERTICALS (THOUSAND UNITS) 2020-2030
TABLE 125 SAUDI ARABIA PROJECT LOGISTICS MARKET BY SERVICE (USD BILLION) 2020-2030
TABLE 126 SAUDI ARABIA PROJECT LOGISTICS MARKET BY SERVICE (THOUSAND UNITS) 2020-2030
TABLE 127 SAUDI ARABIA PROJECT LOGISTICS MARKET BY VERTICALS (USD BILLION) 2020-2030
TABLE 128 SAUDI ARABIA PROJECT LOGISTICS MARKET BY VERTICALS (THOUSAND UNITS) 2020-2030
TABLE 129 SOUTH AFRICA PROJECT LOGISTICS MARKET BY SERVICE (USD BILLION) 2020-2030
TABLE 130 SOUTH AFRICA PROJECT LOGISTICS MARKET BY SERVICE (THOUSAND UNITS) 2020-2030
TABLE 131 SOUTH AFRICA PROJECT LOGISTICS MARKET BY VERTICALS (USD BILLION) 2020-2030
TABLE 132 SOUTH AFRICA PROJECT LOGISTICS MARKET BY VERTICALS (THOUSAND UNITS) 2020-2030
TABLE 133 REST OF MIDDLE EAST AND AFRICA PROJECT LOGISTICS MARKET BY SERVICE (USD BILLION) 2020-2030
TABLE 134 REST OF MIDDLE EAST AND AFRICA PROJECT LOGISTICS MARKET BY SERVICE (THOUSAND UNITS) 2020-2030
TABLE 135 REST OF MIDDLE EAST AND AFRICA PROJECT LOGISTICS MARKET BY VERTICALS (USD BILLION) 2020-2030
TABLE 136 REST OF MIDDLE EAST AND AFRICA PROJECT LOGISTICS MARKET BY VERTICALS (THOUSAND UNITS) 2020-2030
LIST OF FIGURES
FIGURE 1 MARKET DYNAMICS
FIGURE 2 MARKET SEGMENTATION
FIGURE 3 REPORT TIMELINES: YEARS CONSIDERED
FIGURE 4 DATA TRIANGULATION
FIGURE 5 BOTTOM-UP APPROACH
FIGURE 6 TOP-DOWN APPROACH
FIGURE 7 RESEARCH FLOW
FIGURE 8 GLOBAL PROJECT LOGISTICS MARKET BY SERVICE USD BILLION, 2020-2030
FIGURE 9 GLOBAL PROJECT LOGISTICS MARKET BY VERTICALS, USD BILLION, 2020-2030
FIGURE 10 GLOBAL PROJECT LOGISTICS MARKET BY REGION, USD BILLION, 2020-2030
FIGURE 11 PORTER’S FIVE FORCES MODEL
FIGURE 12 GLOBAL PROJECT LOGISTICS MARKET BY SERVICE, USD BILLION 2022
FIGURE 13 GLOBAL PROJECT LOGISTICS MARKET BY VERTICALS, USD BILLION 2022
FIGURE 14 GLOBAL PROJECT LOGISTICS MARKET BY REGION, USD BILLION 2022
FIGURE 15 MARKET SHARE ANALYSIS
FIGURE 16 DHL GLOBAL FORWARDING: COMPANY SNAPSHOT
FIGURE 17 KUEHNE + NAGEL: COMPANY SNAPSHOT
FIGURE 18 DB SCHENKER: COMPANY SNAPSHOT
FIGURE 19 PANALPINA: COMPANY SNAPSHOT
FIGURE 20 CEVA LOGISTICS: COMPANY SNAPSHOT
FIGURE 21 EXPEDITORS INTERNATIONAL: COMPANY SNAPSHOT
FIGURE 22 AGILITY: COMPANY SNAPSHOT
FIGURE 23 BOLLORÉ LOGISTICS: COMPANY SNAPSHOT
FIGURE 24 GEODIS: COMPANY SNAPSHOT
FIGURE 25 UPS SUPPLY CHAIN SOLUTIONS: COMPANY SNAPSHOT
FIGURE 26 FEDEX SUPPLY CHAIN: COMPANY SNAPSHOT
FIGURE 27 C.H. ROBINSON: COMPANY SNAPSHOT
FIGURE 28 YUSEN LOGISTICS: COMPANY SNAPSHOT
FIGURE 29 DSV PANALPINA: COMPANY SNAPSHOT
FIGURE 30 PENSKE LOGISTICS: COMPANY SNAPSHOT
FIGURE 31 NIPPON EXPRESS: COMPANY SNAPSHOT
FIGURE 32 SINOTRANS: COMPANY SNAPSHOT
FIGURE 33 DAMCO: COMPANY SNAPSHOT
FIGURE 34 HELLMANN WORLDWIDE LOGISTICS: COMPANY SNAPSHOT
FIGURE 35 RHENUS GROUP: COMPANY SNAPSHOT
- MARKET DEFINITION
- MARKET SEGMENTATION
- RESEARCH TIMELINES
- ASSUMPTIONS AND LIMITATIONS
- RESEARCH METHODOLOGY
- DATA MINING
- SECONDARY RESEARCH
- PRIMARY RESEARCH
- SUBJECT-MATTER EXPERTS’ ADVICE
- QUALITY CHECKS
- FINAL REVIEW
- DATA TRIANGULATION
- BOTTOM-UP APPROACH
- TOP-DOWN APPROACH
- RESEARCH FLOW
- DATA SOURCES
- DATA MINING
- EXECUTIVE SUMMARY
- MARKET OVERVIEW
- PROJECT LOGISTICS MARKET OUTLOOK
- MARKET DRIVERS
- MARKET RESTRAINTS
- MARKET OPPORTUNITIES
- IMPACT OF COVID-19 ON PROJECT LOGISTICS MARKET
- PORTER’S FIVE FORCES MODEL
- THREAT FROM NEW ENTRANTS
- THREAT FROM SUBSTITUTES
- BARGAINING POWER OF SUPPLIERS
- BARGAINING POWER OF CUSTOMERS
- DEGREE OF COMPETITION
- INDUSTRY VALUE CHAIN ANALYSIS
- PROJECT LOGISTICS MARKET OUTLOOK
- GLOBAL PROJECT LOGISTICS MARKET BY VERTICALS, 2020-2030, (USD BILLION) (THOUSAND UNITS)
- OIL AND GAS
- CONSTRUCTION
- ENERGY AND POWER
- OTHER
- GLOBAL PROJECT LOGISTICS MARKET BY SERVICE, 2020-2030, (USD BILLION) (THOUSAND UNITS)
- TRANSPORTATION
- WAREHOUSING
- INVENTORY MANAGEMENT
- OTHERS
- GLOBAL PROJECT LOGISTICS MARKET BY REGION, 2020-2030, (USD BILLION) (THOUSAND UNITS)
- NORTH AMERICA
- US
- CANADA
- MEXICO
- SOUTH AMERICA
- BRAZIL
- ARGENTINA
- COLOMBIA
- REST OF SOUTH AMERICA
- EUROPE
- GERMANY
- UK
- FRANCE
- ITALY
- SPAIN
- RUSSIA
- REST OF EUROPE
- ASIA PACIFIC
- INDIA
- CHINA
- JAPAN
- SOUTH KOREA
- AUSTRALIA
- SOUTH-EAST ASIA
- REST OF ASIA PACIFIC
- MIDDLE EAST AND AFRICA
- UAE
- SAUDI ARABIA
- SOUTH AFRICA
- REST OF MIDDLE EAST AND AFRICA
- NORTH AMERICA
- COMPANY PROFILES*
(BUSINESS OVERVIEW, COMPANY SNAPSHOT, VERTICALS OFFERED, RECENT DEVELOPMENTS)
- DHL GLOBAL FORWARDING
- KUEHNE + NAGEL
- DB SCHENKER
- PANALPINA
- CEVA LOGISTICS
- EXPEDITORS INTERNATIONAL
- AGILITY
- BOLLORÉ LOGISTICS
- GEODIS
- UPS SUPPLY CHAIN SOLUTIONS
- FEDEX SUPPLY CHAIN
- H. ROBINSON
- YUSEN LOGISTICS
- DSV PANALPINA
- PENSKE LOGISTICS
- NIPPON EXPRESS
- SINOTRANS
- DAMCO
- HELLMANN WORLDWIDE LOGISTICS
- RHENUS GROUP
*THE COMPANY LIST IS INDICATIVE
LIST OF TABLES
TABLE 1 GLOBAL PROJECT LOGISTICS MARKET BY SERVICE (USD BILLION) 2020-2030
TABLE 2 GLOBAL PROJECT LOGISTICS MARKET BY SERVICE (THOUSAND UNITS) 2020-2030
TABLE 3 GLOBAL PROJECT LOGISTICS MARKET BY VERTICALS (USD BILLION) 2020-2030
TABLE 4 GLOBAL PROJECT LOGISTICS MARKET BY VERTICALS (THOUSAND UNITS) 2020-2030
TABLE 5 GLOBAL PROJECT LOGISTICS MARKET BY REGION (USD BILLION) 2020-2030
TABLE 6 GLOBAL PROJECT LOGISTICS MARKET BY REGION (THOUSAND UNITS) 2020-2030
TABLE 7 NORTH AMERICA PROJECT LOGISTICS MARKET BY COUNTRY (USD BILLION)
2020-2030
TABLE 8 NORTH AMERICA PROJECT LOGISTICS MARKET BY COUNTRY (THOUSAND UNITS)
2020-2030
TABLE 9 NORTH AMERICA PROJECT LOGISTICS MARKET BY SERVICE (USD BILLION) 2020-2030
TABLE 10 NORTH AMERICA PROJECT LOGISTICS MARKET BY SERVICE (THOUSAND UNITS) 2020-2030
TABLE 11 NORTH AMERICA PROJECT LOGISTICS MARKET BY VERTICALS (USD BILLION) 2020-2030
TABLE 12 NORTH AMERICA PROJECT LOGISTICS MARKET BY VERTICALS (THOUSAND UNITS) 2020-2030
TABLE 13 US PROJECT LOGISTICS MARKET BY SERVICE (USD BILLION) 2020-2030
TABLE 14 US PROJECT LOGISTICS MARKET BY SERVICE (THOUSAND UNITS) 2020-2030
TABLE 15 US PROJECT LOGISTICS MARKET BY VERTICALS (USD BILLION) 2020-2030
TABLE 16 US PROJECT LOGISTICS MARKET BY VERTICALS (THOUSAND UNITS) 2020-2030
TABLE 17 CANADA PROJECT LOGISTICS MARKET BY SERVICE (USD BILLION) 2020-2030
TABLE 18 CANADA PROJECT LOGISTICS MARKET BY SERVICE (THOUSAND UNITS) 2020-2030
TABLE 19 CANADA PROJECT LOGISTICS MARKET BY VERTICALS (USD BILLION) 2020-2030
TABLE 20 CANADA PROJECT LOGISTICS MARKET BY VERTICALS (THOUSAND UNITS) 2020-2030
TABLE 21 MEXICO PROJECT LOGISTICS MARKET BY SERVICE (USD BILLION) 2020-2030
TABLE 22 MEXICO PROJECT LOGISTICS MARKET BY SERVICE (THOUSAND UNITS) 2020-2030
TABLE 23 MEXICO PROJECT LOGISTICS MARKET BY VERTICALS (USD BILLION) 2020-2030
TABLE 24 MEXICO PROJECT LOGISTICS MARKET BY VERTICALS (THOUSAND UNITS) 2020-2030
TABLE 25 SOUTH AMERICA PROJECT LOGISTICS MARKET BY COUNTRY (USD BILLION) 2020-2030
TABLE 26 SOUTH AMERICA PROJECT LOGISTICS MARKET BY COUNTRY (THOUSAND UNITS) 2020-2030
TABLE 27 SOUTH AMERICA PROJECT LOGISTICS MARKET BY SERVICE (USD BILLION) 2020-2030
TABLE 28 SOUTH AMERICA PROJECT LOGISTICS MARKET BY SERVICE (THOUSAND UNITS) 2020-2030
TABLE 29 SOUTH AMERICA PROJECT LOGISTICSMARKET BY VERTICALS (USD BILLION) 2020-2030
TABLE 30 SOUTH AMERICA PROJECT LOGISTICS MARKET BY VERTICALS (THOUSAND UNITS) 2020-2030
TABLE 31 BRAZIL PROJECT LOGISTICS MARKET BY SERVICE (USD BILLION) 2020-2030
TABLE 32 BRAZIL PROJECT LOGISTICS MARKET BY SERVICE (THOUSAND UNITS) 2020-2030
TABLE 33 BRAZIL PROJECT LOGISTICS MARKET BY VERTICALS (USD BILLION) 2020-2030
TABLE 34 BRAZIL PROJECT LOGISTICS MARKET BY VERTICALS (THOUSAND UNITS) 2020-2030
TABLE 35 ARGENTINA PROJECT LOGISTICSMARKET BY SERVICE (USD BILLION) 2020-2030
TABLE 36 ARGENTINA PROJECT LOGISTICS MARKET BY SERVICE (THOUSAND UNITS) 2020-2030
TABLE 37 ARGENTINA PROJECT LOGISTICS MARKET BY VERTICALS (USD BILLION) 2020-2030
TABLE 38 ARGENTINA PROJECT LOGISTICS MARKET BY VERTICALS (THOUSAND UNITS) 2020-2030
TABLE 39 COLOMBIA PROJECT LOGISTICS MARKET BY SERVICE (USD BILLION) 2020-2030
TABLE 40 COLOMBIA PROJECT LOGISTICS MARKET BY SERVICE (THOUSAND UNITS) 2020-2030
TABLE 41 COLOMBIA PROJECT LOGISTICS MARKET BY VERTICALS (USD BILLION) 2020-2030
TABLE 42 COLOMBIA PROJECT LOGISTICS MARKET BY VERTICALS (THOUSAND UNITS) 2020-2030
TABLE 43 REST OF SOUTH AMERICA PROJECT LOGISTICS MARKET BY SERVICE (USD BILLION) 2020-2030
TABLE 44 REST OF SOUTH AMERICA PROJECT LOGISTICS MARKET BY SERVICE (THOUSAND UNITS) 2020-2030
TABLE 45 REST OF SOUTH AMERICA PROJECT LOGISTICS MARKET BY VERTICALS (USD BILLION) 2020-2030
TABLE 46 REST OF SOUTH AMERICA PROJECT LOGISTICS MARKET BY VERTICALS (THOUSAND UNITS) 2020-2030
TABLE 47 ASIA-PACIFIC PROJECT LOGISTICS MARKET BY COUNTRY (USD BILLION) 2020-2030
TABLE 48 ASIA-PACIFIC PROJECT LOGISTICS MARKET BY COUNTRY (THOUSAND UNITS) 2020-2030
TABLE 49 ASIA-PACIFIC PROJECT LOGISTICS MARKET BY SERVICE (USD BILLION) 2020-2030
TABLE 50 ASIA-PACIFIC PROJECT LOGISTICS MARKET BY SERVICE (THOUSAND UNITS) 2020-2030
TABLE 51 ASIA-PACIFIC PROJECT LOGISTICS MARKET BY VERTICALS (USD BILLION) 2020-2030
TABLE 52 ASIA-PACIFIC PROJECT LOGISTICS MARKET BY VERTICALS (THOUSAND UNITS) 2020-2030
TABLE 53 INDIA PROJECT LOGISTICS MARKET BY SERVICE (USD BILLION) 2020-2030
TABLE 54 INDIA PROJECT LOGISTICS MARKET BY SERVICE (THOUSAND UNITS) 2020-2030
TABLE 55 INDIA PROJECT LOGISTICS MARKET BY VERTICALS (USD BILLION) 2020-2030
TABLE 56 INDIA PROJECT LOGISTICS MARKET BY VERTICALS (THOUSAND UNITS) 2020-2030
TABLE 57 CHINA PROJECT LOGISTICS MARKET BY SERVICE (USD BILLION) 2020-2030
TABLE 58 CHINA PROJECT LOGISTICS MARKET BY SERVICE (THOUSAND UNITS) 2020-2030
TABLE 59 CHINA PROJECT LOGISTICS MARKET BY VERTICALS (USD BILLION) 2020-2030
TABLE 60 CHINA PROJECT LOGISTICS MARKET BY VERTICALS (THOUSAND UNITS) 2020-2030
TABLE 61 JAPAN PROJECT LOGISTICS MARKET BY SERVICE (USD BILLION) 2020-2030
TABLE 62 JAPAN PROJECT LOGISTICS MARKET BY SERVICE (THOUSAND UNITS) 2020-2030
TABLE 63 JAPAN PROJECT LOGISTICS MARKET BY VERTICALS (USD BILLION) 2020-2030
TABLE 64 JAPAN PROJECT LOGISTICS MARKET BY VERTICALS (THOUSAND UNITS) 2020-2030
TABLE 65 SOUTH KOREA PROJECT LOGISTICS MARKET BY SERVICE (USD BILLION) 2020-2030
TABLE 66 SOUTH KOREA PROJECT LOGISTICS MARKET BY SERVICE (THOUSAND UNITS) 2020-2030
TABLE 67 SOUTH KOREA PROJECT LOGISTICS MARKET BY VERTICALS (USD BILLION) 2020-2030
TABLE 68 SOUTH KOREA PROJECT LOGISTICS MARKET BY VERTICALS (THOUSAND UNITS) 2020-2030
TABLE 69 AUSTRALIA PROJECT LOGISTICS MARKET BY SERVICE (USD BILLION) 2020-2030
TABLE 70 AUSTRALIA PROJECT LOGISTICS MARKET BY SERVICE (THOUSAND UNITS) 2020-2030
TABLE 71 AUSTRALIA PROJECT LOGISTICS MARKET BY VERTICALS (USD BILLION) 2020-2030
TABLE 72 AUSTRALIA PROJECT LOGISTICS MARKET BY VERTICALS (THOUSAND UNITS) 2020-2030
TABLE 73 SOUTH-EAST ASIA PROJECT LOGISTICS MARKET BY SERVICE (USD BILLION) 2020-2030
TABLE 74 SOUTH-EAST ASIA PROJECT LOGISTICS MARKET BY SERVICE (THOUSAND UNITS) 2020-2030
TABLE 75 SOUTH-EAST ASIA PROJECT LOGISTICS MARKET BY VERTICALS (USD BILLION) 2020-2030
TABLE 76 SOUTH-EAST ASIA PROJECT LOGISTICS MARKET BY VERTICALS (THOUSAND UNITS) 2020-2030
TABLE 77 REST OF ASIA PACIFIC PROJECT LOGISTICS MARKET BY SERVICE (USD BILLION) 2020-2030
TABLE 78 REST OF ASIA PACIFIC PROJECT LOGISTICS MARKET BY SERVICE (THOUSAND UNITS) 2020-2030
TABLE 79 REST OF ASIA PACIFIC PROJECT LOGISTICS MARKET BY VERTICALS (USD BILLION) 2020-2030
TABLE 80 REST OF ASIA PACIFIC PROJECT LOGISTICS MARKET BY VERTICALS (THOUSAND UNITS) 2020-2030
TABLE 81 EUROPE PROJECT LOGISTICS MARKET BY COUNTRY (USD BILLION) 2020-2030
TABLE 82 EUROPE PROJECT LOGISTICS MARKET BY COUNTRY (THOUSAND UNITS) 2020-2030
TABLE 83 EUROPE PROJECT LOGISTICS MARKET BY SERVICE (USD BILLION) 2020-2030
TABLE 84 EUROPE PROJECT LOGISTICS MARKET BY SERVICE (THOUSAND UNITS) 2020-2030
TABLE 85 EUROPE PROJECT LOGISTICS MARKET BY VERTICALS (USD BILLION) 2020-2030
TABLE 86 EUROPE PROJECT LOGISTICS MARKET BY VERTICALS (THOUSAND UNITS) 2020-2030
TABLE 87 GERMANY PROJECT LOGISTICS MARKET BY SERVICE (USD BILLION) 2020-2030
TABLE 88 GERMANY PROJECT LOGISTICS MARKET BY SERVICE (THOUSAND UNITS) 2020-2030
TABLE 89 GERMANY PROJECT LOGISTICS MARKET BY VERTICALS (USD BILLION) 2020-2030
TABLE 90 GERMANY PROJECT LOGISTICS MARKET BY VERTICALS (THOUSAND UNITS) 2020-2030
TABLE 91 UK PROJECT LOGISTICS MARKET BY SERVICE (USD BILLION) 2020-2030
TABLE 92 UK PROJECT LOGISTICS MARKET BY SERVICE (THOUSAND UNITS) 2020-2030
TABLE 93 UK PROJECT LOGISTICS MARKET BY VERTICALS (USD BILLION) 2020-2030
TABLE 94 UK PROJECT LOGISTICS MARKET BY VERTICALS (THOUSAND UNITS) 2020-2030
TABLE 95 FRANCE PROJECT LOGISTICS MARKET BY SERVICE (USD BILLION) 2020-2030
TABLE 96 FRANCE PROJECT LOGISTICS MARKET BY SERVICE (THOUSAND UNITS) 2020-2030
TABLE 97 FRANCE PROJECT LOGISTICS MARKET BY VERTICALS (USD BILLION) 2020-2030
TABLE 98 FRANCE PROJECT LOGISTICS MARKET BY VERTICALS (THOUSAND UNITS) 2020-2030
TABLE 99 ITALY PROJECT LOGISTICS MARKET BY SERVICE (USD BILLION) 2020-2030
TABLE 100 ITALY PROJECT LOGISTICS MARKET BY SERVICE (THOUSAND UNITS) 2020-2030
TABLE 101 ITALY PROJECT LOGISTICS MARKET BY VERTICALS (USD BILLION) 2020-2030
TABLE 102 ITALY PROJECT LOGISTICS MARKET BY VERTICALS (THOUSAND UNITS) 2020-2030
TABLE 103 SPAIN PROJECT LOGISTICS MARKET BY SERVICE (USD BILLION) 2020-2030
TABLE 104 SPAIN PROJECT LOGISTICS MARKET BY SERVICE (THOUSAND UNITS) 2020-2030
TABLE 105 SPAIN PROJECT LOGISTICS MARKET BY VERTICALS (USD BILLION) 2020-2030
TABLE 106 SPAIN PROJECT LOGISTICS MARKET BY VERTICALS (THOUSAND UNITS) 2020-2030
TABLE 107 RUSSIA PROJECT LOGISTICS MARKET BY SERVICE (USD BILLION) 2020-2030
TABLE 108 RUSSIA PROJECT LOGISTICS MARKET BY SERVICE (THOUSAND UNITS) 2020-2030
TABLE 109 RUSSIA PROJECT LOGISTICS MARKET BY VERTICALS (USD BILLION) 2020-2030
TABLE 110 RUSSIA PROJECT LOGISTICS MARKET BY VERTICALS (THOUSAND UNITS) 2020-2030
TABLE 111 REST OF EUROPE PROJECT LOGISTICS MARKET BY SERVICE (USD BILLION) 2020-2030
TABLE 112 REST OF EUROPE PROJECT LOGISTICS MARKET BY SERVICE (THOUSAND UNITS) 2020-2030
TABLE 113 REST OF EUROPE PROJECT LOGISTICS MARKET BY VERTICALS (USD BILLION) 2020-2030
TABLE 114 REST OF EUROPE PROJECT LOGISTICS MARKET BY VERTICALS (THOUSAND UNITS) 2020-2030
TABLE 115 MIDDLE EAST AND AFRICA PROJECT LOGISTICS MARKET BY COUNTRY (USD BILLION) 2020-2030
TABLE 116 MIDDLE EAST AND AFRICA PROJECT LOGISTICS MARKET BY COUNTRY (THOUSAND UNITS) 2020-2030
TABLE 117 MIDDLE EAST AND AFRICA PROJECT LOGISTICS MARKET BY SERVICE (USD BILLION) 2020-2030
TABLE 118 MIDDLE EAST AND AFRICA PROJECT LOGISTICS MARKET BY SERVICE (THOUSAND UNITS) 2020-2030
TABLE 119 MIDDLE EAST AND AFRICA PROJECT LOGISTICS MARKET BY VERTICALS (USD BILLION) 2020-2030
TABLE 120 MIDDLE EAST AND AFRICA PROJECT LOGISTICS MARKET BY VERTICALS (THOUSAND UNITS) 2020-2030
TABLE 121 UAE PROJECT LOGISTICS MARKET BY SERVICE (USD BILLION) 2020-2030
TABLE 122 UAE PROJECT LOGISTICS MARKET BY SERVICE (THOUSAND UNITS) 2020-2030
TABLE 123 UAE PROJECT LOGISTICS MARKET BY VERTICALS (USD BILLION) 2020-2030
TABLE 124 UAE PROJECT LOGISTICS MARKET BY VERTICALS (THOUSAND UNITS) 2020-2030
TABLE 125 SAUDI ARABIA PROJECT LOGISTICS MARKET BY SERVICE (USD BILLION) 2020-2030
TABLE 126 SAUDI ARABIA PROJECT LOGISTICS MARKET BY SERVICE (THOUSAND UNITS) 2020-2030
TABLE 127 SAUDI ARABIA PROJECT LOGISTICS MARKET BY VERTICALS (USD BILLION) 2020-2030
TABLE 128 SAUDI ARABIA PROJECT LOGISTICS MARKET BY VERTICALS (THOUSAND UNITS) 2020-2030
TABLE 129 SOUTH AFRICA PROJECT LOGISTICS MARKET BY SERVICE (USD BILLION) 2020-2030
TABLE 130 SOUTH AFRICA PROJECT LOGISTICS MARKET BY SERVICE (THOUSAND UNITS) 2020-2030
TABLE 131 SOUTH AFRICA PROJECT LOGISTICS MARKET BY VERTICALS (USD BILLION) 2020-2030
TABLE 132 SOUTH AFRICA PROJECT LOGISTICS MARKET BY VERTICALS (THOUSAND UNITS) 2020-2030
TABLE 133 REST OF MIDDLE EAST AND AFRICA PROJECT LOGISTICS MARKET BY SERVICE (USD BILLION) 2020-2030
TABLE 134 REST OF MIDDLE EAST AND AFRICA PROJECT LOGISTICS MARKET BY SERVICE (THOUSAND UNITS) 2020-2030
TABLE 135 REST OF MIDDLE EAST AND AFRICA PROJECT LOGISTICS MARKET BY VERTICALS (USD BILLION) 2020-2030
TABLE 136 REST OF MIDDLE EAST AND AFRICA PROJECT LOGISTICS MARKET BY VERTICALS (THOUSAND UNITS) 2020-2030
LIST OF FIGURES
FIGURE 1 MARKET DYNAMICS
FIGURE 2 MARKET SEGMENTATION
FIGURE 3 REPORT TIMELINES: YEARS CONSIDERED
FIGURE 4 DATA TRIANGULATION
FIGURE 5 BOTTOM-UP APPROACH
FIGURE 6 TOP-DOWN APPROACH
FIGURE 7 RESEARCH FLOW
FIGURE 8 GLOBAL PROJECT LOGISTICS MARKET BY SERVICE USD BILLION, 2020-2030
FIGURE 9 GLOBAL PROJECT LOGISTICS MARKET BY VERTICALS, USD BILLION, 2020-2030
FIGURE 10 GLOBAL PROJECT LOGISTICS MARKET BY REGION, USD BILLION, 2020-2030
FIGURE 11 PORTER’S FIVE FORCES MODEL
FIGURE 12 GLOBAL PROJECT LOGISTICS MARKET BY SERVICE, USD BILLION 2022
FIGURE 13 GLOBAL PROJECT LOGISTICS MARKET BY VERTICALS, USD BILLION 2022
FIGURE 14 GLOBAL PROJECT LOGISTICS MARKET BY REGION, USD BILLION 2022
FIGURE 15 MARKET SHARE ANALYSIS
FIGURE 16 DHL GLOBAL FORWARDING: COMPANY SNAPSHOT
FIGURE 17 KUEHNE + NAGEL: COMPANY SNAPSHOT
FIGURE 18 DB SCHENKER: COMPANY SNAPSHOT
FIGURE 19 PANALPINA: COMPANY SNAPSHOT
FIGURE 20 CEVA LOGISTICS: COMPANY SNAPSHOT
FIGURE 21 EXPEDITORS INTERNATIONAL: COMPANY SNAPSHOT
FIGURE 22 AGILITY: COMPANY SNAPSHOT
FIGURE 23 BOLLORÉ LOGISTICS: COMPANY SNAPSHOT
FIGURE 24 GEODIS: COMPANY SNAPSHOT
FIGURE 25 UPS SUPPLY CHAIN SOLUTIONS: COMPANY SNAPSHOT
FIGURE 26 FEDEX SUPPLY CHAIN: COMPANY SNAPSHOT
FIGURE 27 C.H. ROBINSON: COMPANY SNAPSHOT
FIGURE 28 YUSEN LOGISTICS: COMPANY SNAPSHOT
FIGURE 29 DSV PANALPINA: COMPANY SNAPSHOT
FIGURE 30 PENSKE LOGISTICS: COMPANY SNAPSHOT
FIGURE 31 NIPPON EXPRESS: COMPANY SNAPSHOT
FIGURE 32 SINOTRANS: COMPANY SNAPSHOT
FIGURE 33 DAMCO: COMPANY SNAPSHOT
FIGURE 34 HELLMANN WORLDWIDE LOGISTICS: COMPANY SNAPSHOT
FIGURE 35 RHENUS GROUP: COMPANY SNAPSHOT
DOWNLOAD FREE SAMPLE REPORT
License Type
SPEAK WITH OUR ANALYST
Want to know more about the report or any specific requirement?
WANT TO CUSTOMIZE THE REPORT?
Our Clients Speak
We asked them to research ‘ Equipment market’ all over the world, and their whole arrangement was helpful to us. thehealthanalytics.com insightful analysis and reports contributed to our current analysis and in creating a future strategy. Besides, the te
Yosuke Mitsui
Senior Associate Construction Equipment Sales & Marketing
We asked them to research ‘Equipment market’ all over the world, and their whole arrangement was helpful to us. thehealthanalytics.com insightful analysis and reports contributed to our current analysis and in creating a future strategy. Besides, the te


