

Base Year Value ()
x.x %
x.x %
CAGR ()
x.x %
x.x %
Forecast Year Value ()
x.x %
x.x %
Historical Data Period
Largest Region
Forecast Period
제품 유형(휴대형, 핸드헬드, 벤치탑), 응용 분야(탁도, pH, 용존 산소, 전도도, TOC, 기타), 최종 사용자 산업(정수 처리 시설, 실험실, 산업, 양식업, 기타) 및 지역별 수질 계측기 시장, 2023년부터 2030년까지의 글로벌 추세 및 예측
Instant access to hundreds of data points and trends
- Market estimates from 2014-2029
- Competitive analysis, industry segmentation, financial benchmarks
- Incorporates SWOT, Porter's Five Forces and risk management frameworks
- PDF report or online database with Word, Excel and PowerPoint export options
- 100% money back guarantee
수질 계측기 시장 개요
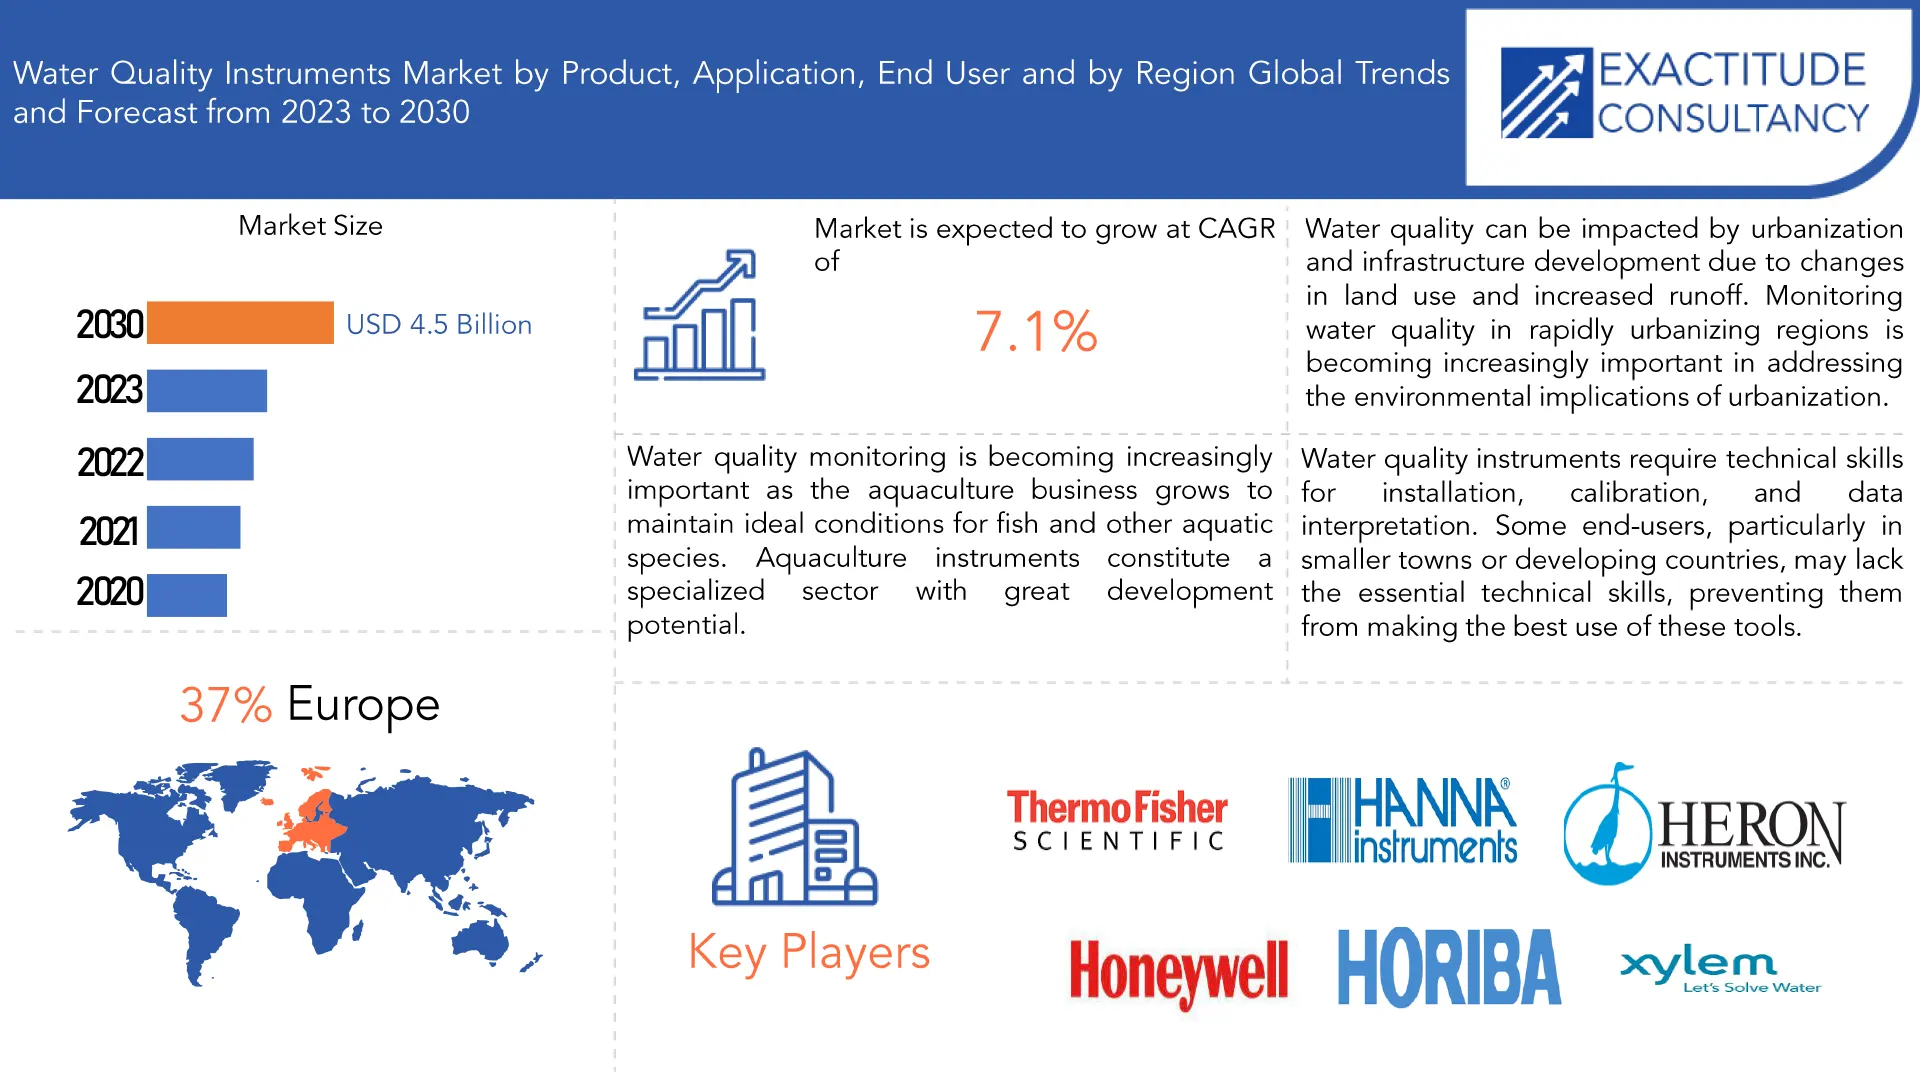
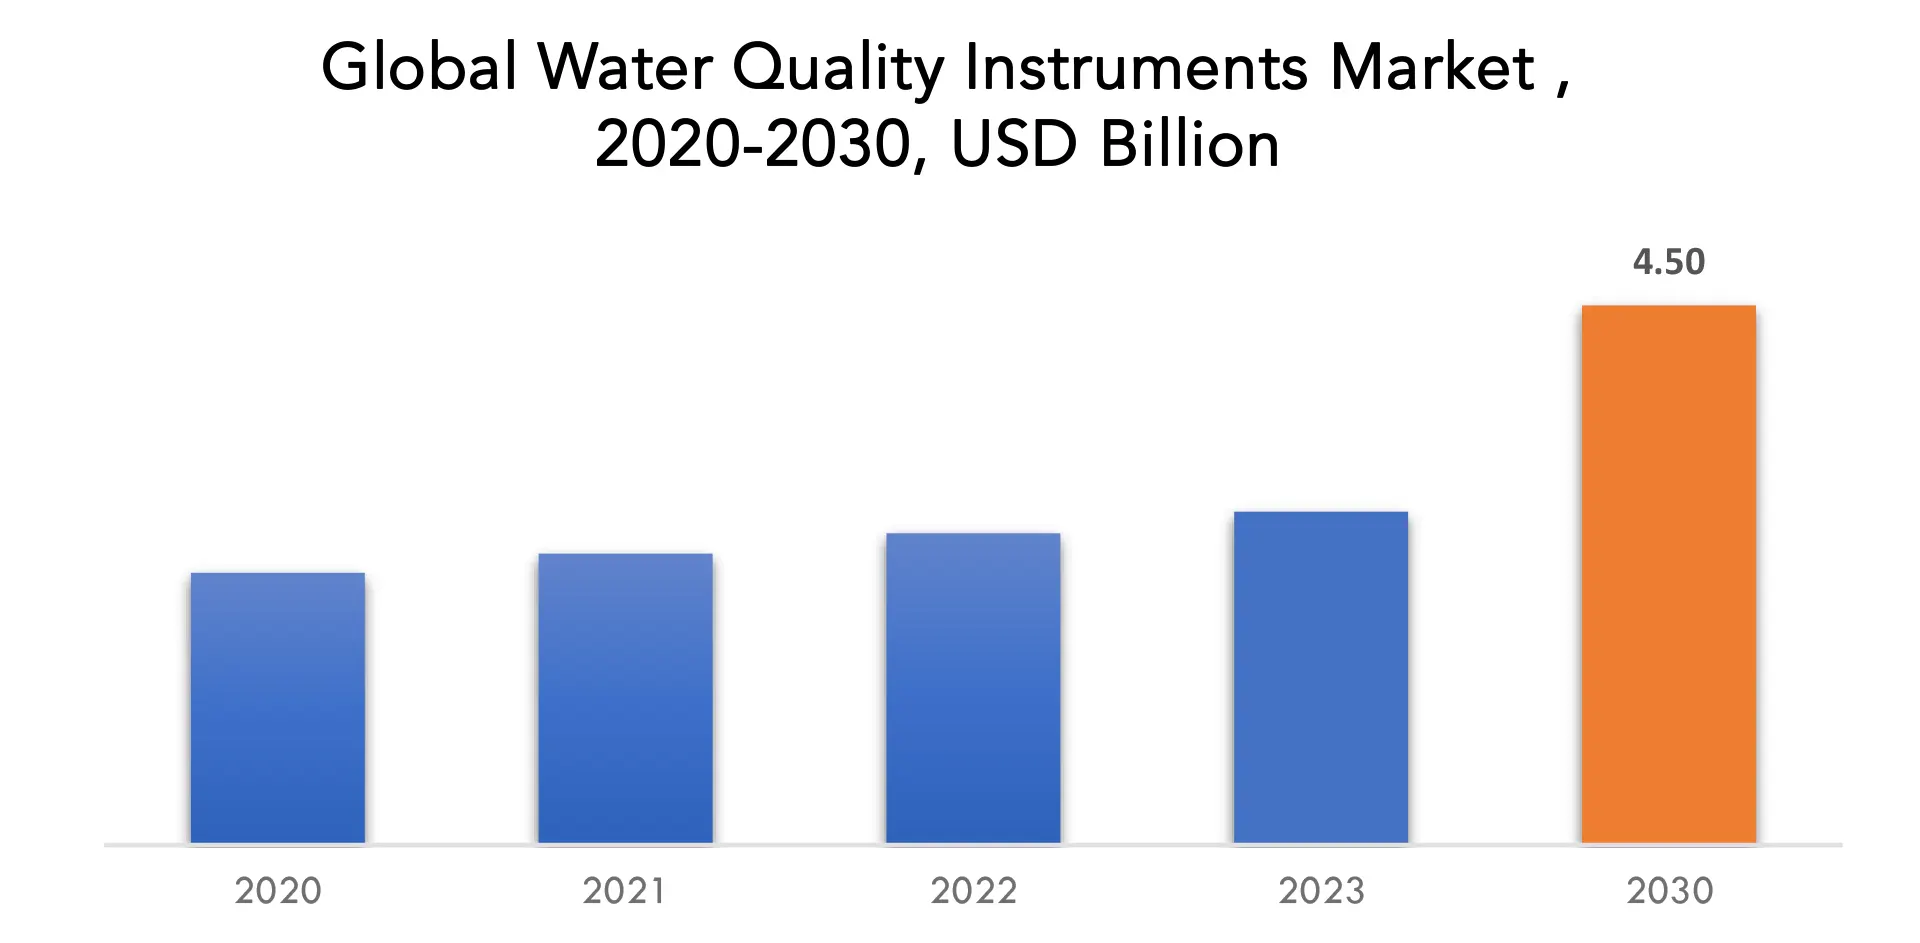
글로벌 수질 계측기 시장 규모는 2023년 27억 8천만 달러에서 2030년 45억 달러로 성장할 것으로 예상되며, 예측 기간 동안 7.10%의 CAGR을 보일 것입니다.
수질 계측기는 물의 여러 품질과 상태를 평가하고 모니터링하여 특정 품질 기준을 충족하는지 확인하는 장치입니다. 이러한 장치는 pH, 용존 산소, 탁도, 전도도, 온도 및 영양소와 오염 물질과 같은 다양한 오염 물질의 농도와 같은 매개변수를 정확하게 측정하여 환경 및 공중 보건에 중요한 역할을 합니다. 과학자, 환경 운동가 및 규제 기관은 이 장비에서 데이터를 수집하고 해석하여 수역의 건강을 평가하고 생태계와 인간 건강에 대한 잠재적 위험을 감지하고 수질을 보존하거나 개선하기 위한 적절한 단계를 실행할 수 있습니다. 수질 계측기는 전 세계의 다양한 기업, 농업 및 지역 사회에서 수자원을 보호하고 지속 가능한 수자원 관리 관행을 촉진하는 데 필수적인 도구입니다. 수질 계측기는 수자원의 건강을 분석하고 관리하기 때문에 필수적입니다. 이 장치는 pH, 용존 산소, 오염 물질 농도를 포함한 중요한 매개변수에 대한 정확하고 실시간 판독값을 제공하여 수질에 대한 철저한 지식을 제공합니다. 이 정보 [캡션 id="attachment_34755" align="aligncenter" width="1920"]
| 기인하다 | 세부 |
| 학습 기간 | 2020-2030 |
| 기준년도 | 2022 |
| 추정 연도 | 2023 |
| 예상 연도 | 2023-2030 |
| 역사적 기간 | 2019-2021 |
| 단위 | 가치(USD 10억) (천 단위) |
| 분할 | 제품, 응용 프로그램, 최종 사용자 및 지역별 |
| 제품별로 |
|
| 응용 프로그램으로 |
|
| 최종 사용자별 |
|
| 지역별로 |
|
Frequently Asked Questions
• What is the market size for the Water Quality Instruments market?
The global Water Quality Instruments market size is projected to grow from USD 2.78 billion in 2023 to USD 4.50 billion by 2030, exhibiting a CAGR of 7.10% during the forecast period.
• Which region is dominating in the Water Quality Instruments market?
Europe accounted for the largest market in the Water Quality Instruments market.
• Who are the major key players in the Water Quality Instruments market?
ABB,ATI UK, Endress+Hauser, Evoqua Water Technologies LLC, Focused Photonics, HACH, Hanna Instruments, Heron Instruments Inc, Honeywell International Inc, HORIBA Group, Jenco Instruments Inc, LaMotte Company, Mettler Toledo, Omega, Sea-Bird Scientific, SUEZ (GE),Thermo Fisher Scientific, Xylem, Yokogawa.
• What are the key trends in the Water Quality Instruments market?
Water quality is becoming increasingly important in the agricultural industry for crop health and productivity. In agriculture, water quality devices are being used to monitor irrigation water and analyze the influence of agricultural operations on water resources.
Water Quality Instruments market Segmentation Analysis
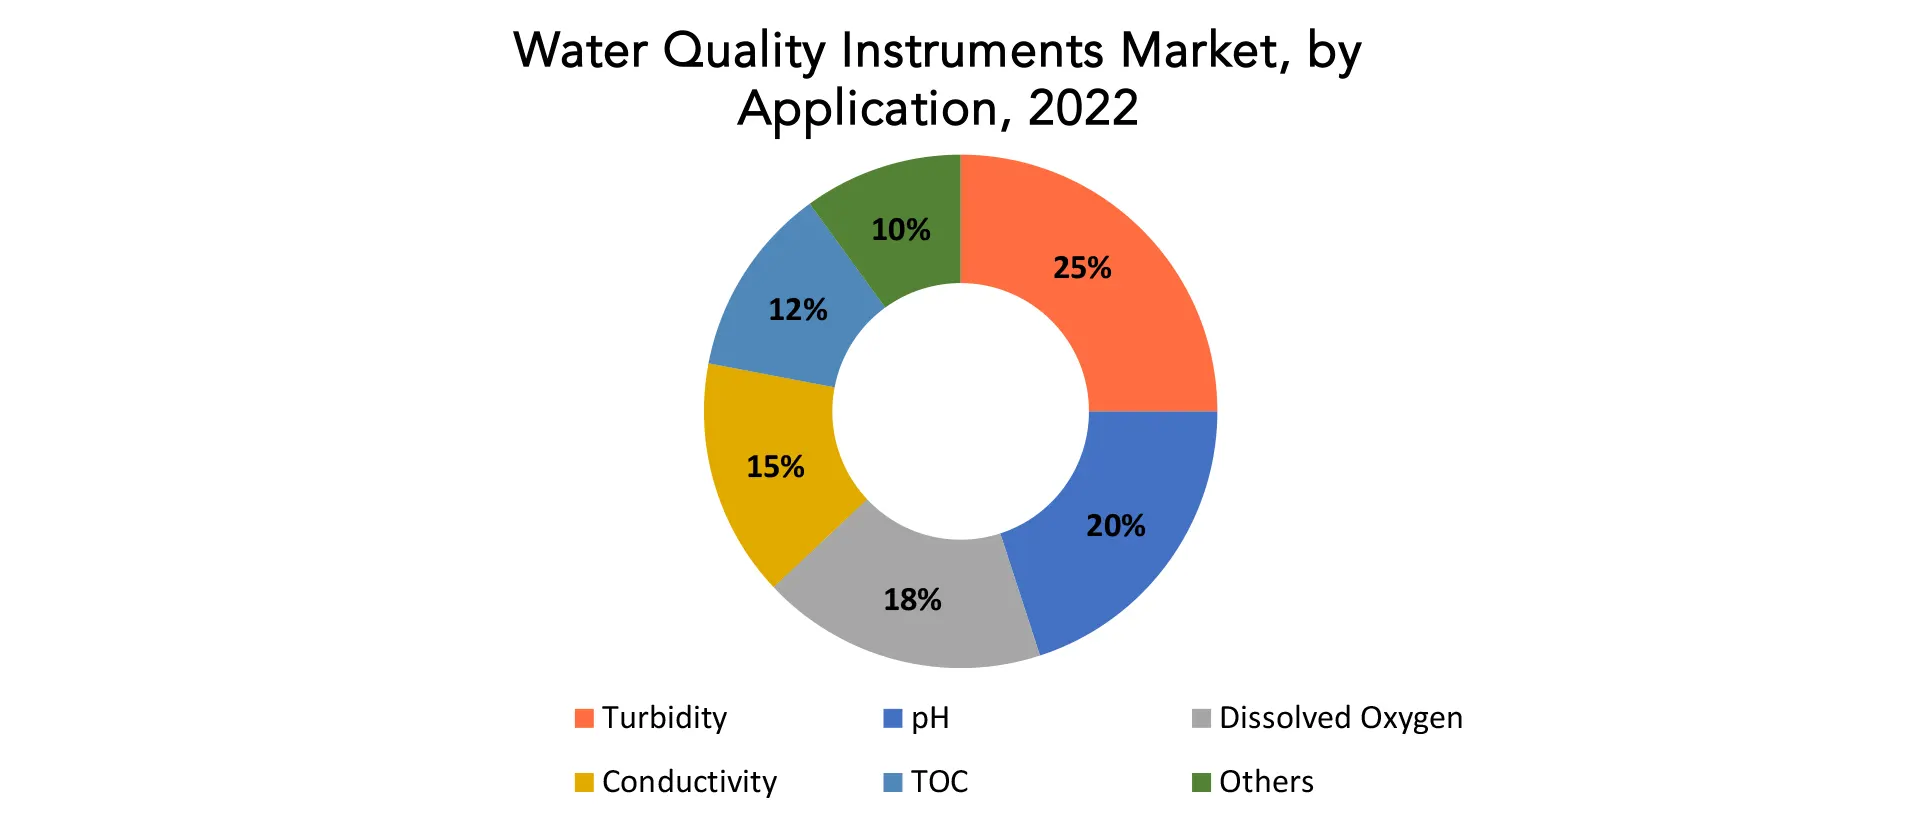
The global Water Quality Instruments market is bifurcated three segments, by product, application and region. By product, the market is bifurcated into portable, handheld, bench-top. By application, the market is bifurcated into turbidity, PH, dissolved oxygen, conductivity, toc, others and region. [caption id="attachment_34762" align="aligncenter" width="1920"]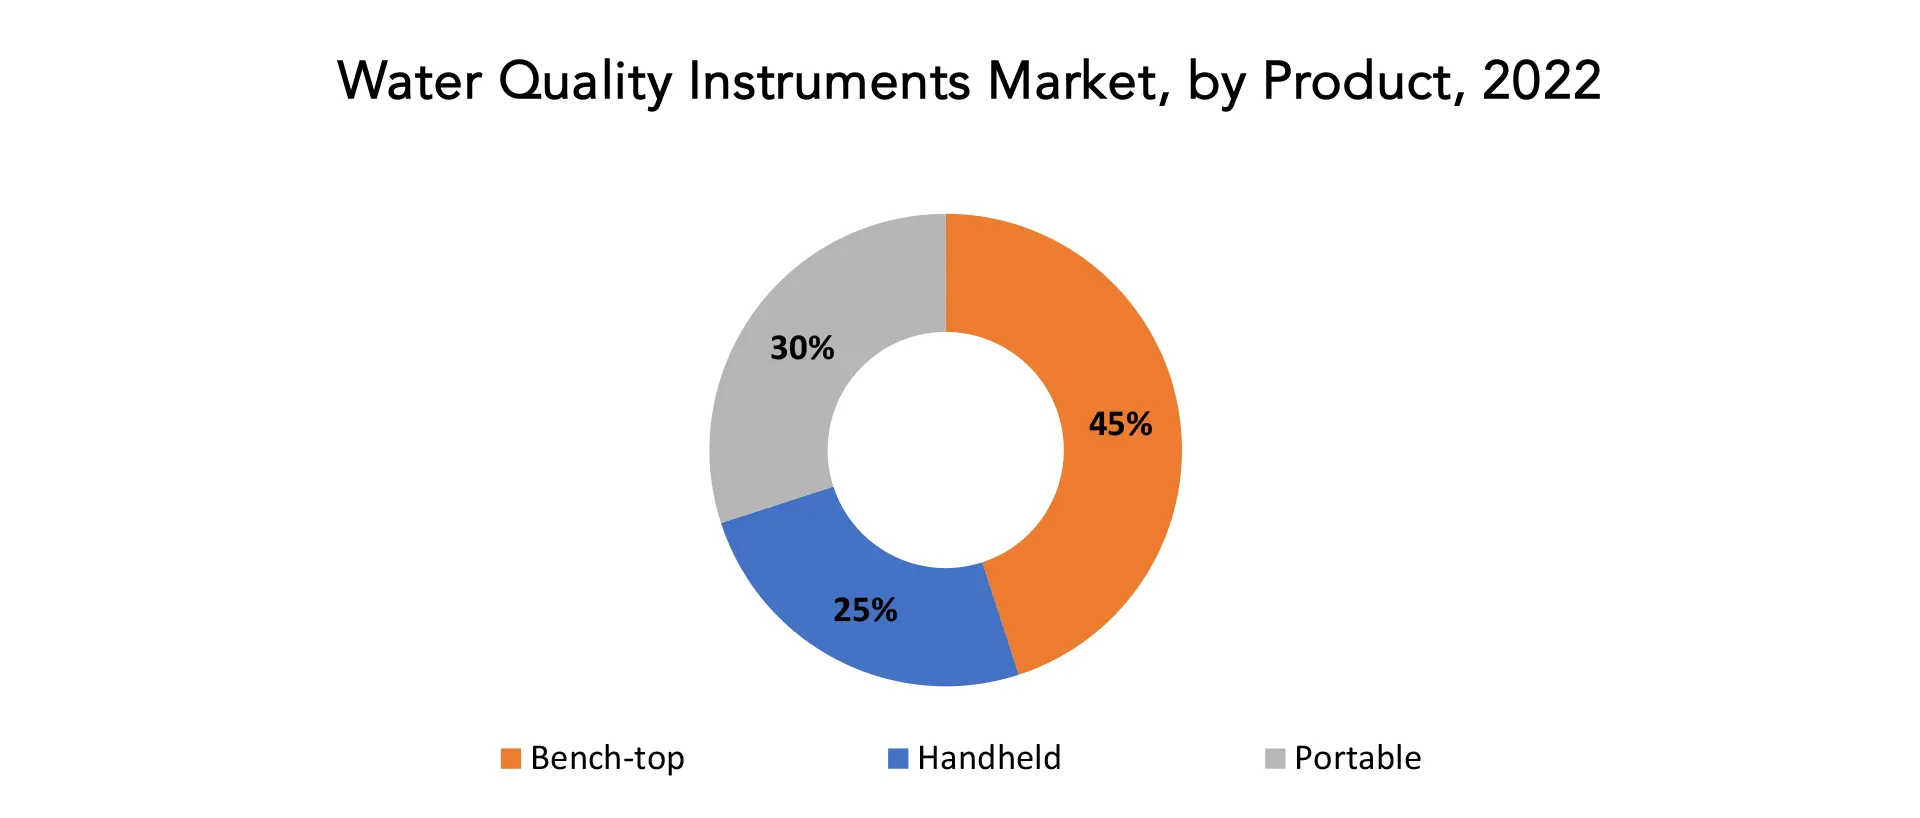
Water Quality Instruments Market Competitive Landscape
The competitive landscape of the Water Quality Instruments market was dynamic, with several prominent companies competing to provide innovative and advanced Water Quality Instruments solutions.- ABB
- ATI UK
- Endress+Hauser
- Evoqua Water Technologies LLC
- Focused Photonics
- HACH
- Hanna Instruments
- Heron Instruments Inc
- Honeywell International Inc
- HORIBA Group
- Jenco Instruments Inc
- LaMotte Company
- Mettler Toledo
- Omega
- Sea-Bird Scientific
- SUEZ (GE)
- Thermo Fisher Scientific
- Xylem
- Yokogawa
Water Quality Instruments Market Dynamics
Driver The increased worldwide awareness of water shortage has become a critical motivator in the widespread deployment of water quality devices. The rising global awareness of water shortage has been a driving force behind the widespread deployment of water quality devices. As civilizations become more aware of the limited nature of freshwater supplies and the mounting issues posed by climate change, a greater emphasis is placed on developing sustainable water management methods. Governments, companies, and communities are proactively addressing water shortages by employing modern water quality monitoring systems. Water quality resources are critical in this paradigm change, allowing for exact and continuous evaluation of the health and safety of water supplies. These sensors enable for the monitoring of critical parameters including as pH, dissolved oxygen, pollutants, and toxins, offering vital insights into the quality of water sources. As worries about water shortages grow, stakeholders are use these tools to get a thorough picture of water conditions, identify possible dangers, and develop efficient resource management plans. Governments throughout the world are establishing tough laws and standards to guarantee responsible water usage and to protect water quality. Industries increasingly understand the significance of implementing sustainable methods to reduce their effect on water supplies. Water quality instruments enable these companies to comply with regulatory standards, conduct efficient water treatment procedures, and make educated judgments to improve water conservation. Restraint The initial expenditures associated with purchasing and integrating improved water quality monitors might be high. The high initial costs of getting and using modern water quality sensors provide a significant obstacle, particularly for smaller towns, research institutes, and organizations with restricted funds. The substantial upfront expenditure includes a variety of components, such as the acquisition of advanced instruments, installation processes, and people training programs. This cost barrier makes widespread use of improved water quality sensors in numerous industries difficult. Smaller communities with limited financial resources frequently prioritize critical services over investing in modern water quality monitoring systems. As a result, these communities may continue to rely on conventional, less modern ways of assessing water quality, thus missing the benefits of real-time monitoring and more data that are accurate. Despite recognizing the potential benefits of cutting-edge water quality equipment, research institutes may find it difficult to devote funding for their procurement and application. This constraint may limit their capacity to perform extensive investigations and collect exact data, stifling scientific research in water quality management. Opportunities Water quality instruments in emerging markets where environmental awareness is growing. The growth of water quality instruments in emerging economies provides a significant opportunity, driven by rising environmental consciousness and changing water management methods. The demand for effective water quality monitoring systems is increasing as these markets experience rapid industrialization and urbanization. Water quality instrument companies have a strategic opportunity to expand their market position by focusing on these locations and solving the particular issues connected with their changing natural settings. Emerging markets frequently see increased environmental consciousness as people and governments appreciate the crucial need of maintaining water supplies for long-term prosperity. This increased knowledge is accompanied by a rising recognition of the negative implications of industrial activity, urban growth, and agricultural practices on water quality. As a result, there is a greater demand for improved water quality equipment that can offer precise, real-time data to enable informed decision-making and proactive environmental management. The rising industrialization of emerging markets, as seen by the installation of manufacturing facilities, energy generation, and infrastructural development, necessitates the establishment of comprehensive water quality monitoring systems. Companies may capitalize on this opportunity by providing customized solutions that meet the unique issues given by industrial discharges, pollutants, and possible contamination sources.Water Quality Instruments Market Trends
- Integration of smart technologies, such as IoT (Internet of Things) and sensor networks is becoming more common. Smart water quality monitoring systems provide real-time data collecting, remote sensing capabilities, and data analytics, boosting overall efficiency and responsiveness.
- The development of small and portable water quality devices is still a priority. These devices are intended for use in the field, allowing for faster and more flexible on-site tests without sacrificing accuracy.
- Sensor technology developments are enhancing the accuracy, sensitivity, and specificity of water quality measurements. Nanotechnology and sophisticated materials are being used to improve sensor capabilities, enabling for more precise contamination detection.
- Remote monitoring and telemetry capabilities are progressively being included into water quality devices. This enables real-time data transfer, allowing for faster reactions to changes in water quality and more effective environmental management.
- The incorporation of real-time data analytics into water quality sensors allows users to quickly draw valuable information. This trend encourages proactive decision-making by allowing authorities and companies to respond quickly to changes in water quality and possible problems.
- As worldwide environmental rules become more strict, there is an increased demand for water quality devices that can assure compliance. This is especially noticeable in businesses like wastewater treatment, where precise monitoring is required to satisfy regulatory standards.
- Agriculture understands the importance of water quality in crop health and output. Water quality devices are increasingly being used in agriculture to monitor irrigation water and measure the impact of agricultural operations on water resources.
- Multipara meter water quality sensors that can test many parameters at the same time are becoming increasingly common. These devices give a full understanding of water quality in a single device, giving efficiency and cost-effectiveness.
Water Quality Instruments Market Regional Analysis
The dominating region in the Water Quality Instrument Market is generally considered Europe. Europe is implementing some of the most rigorous environmental standards in the world, fueling demand for water quality monitoring tools. Europeans appreciate the value of clean water and are ready to pay for products and services that assist ensure its quality. Europe has a well-developed water infrastructure, which makes water quality monitoring technologies more easily adopted. Water quality devices are developed and manufactured by European firms, which are market leaders. This region has experienced significant economic expansion and urbanization, which is causing increased water pollution and a demand for water quality monitoring systems. [caption id="attachment_34768" align="aligncenter" width="1920"]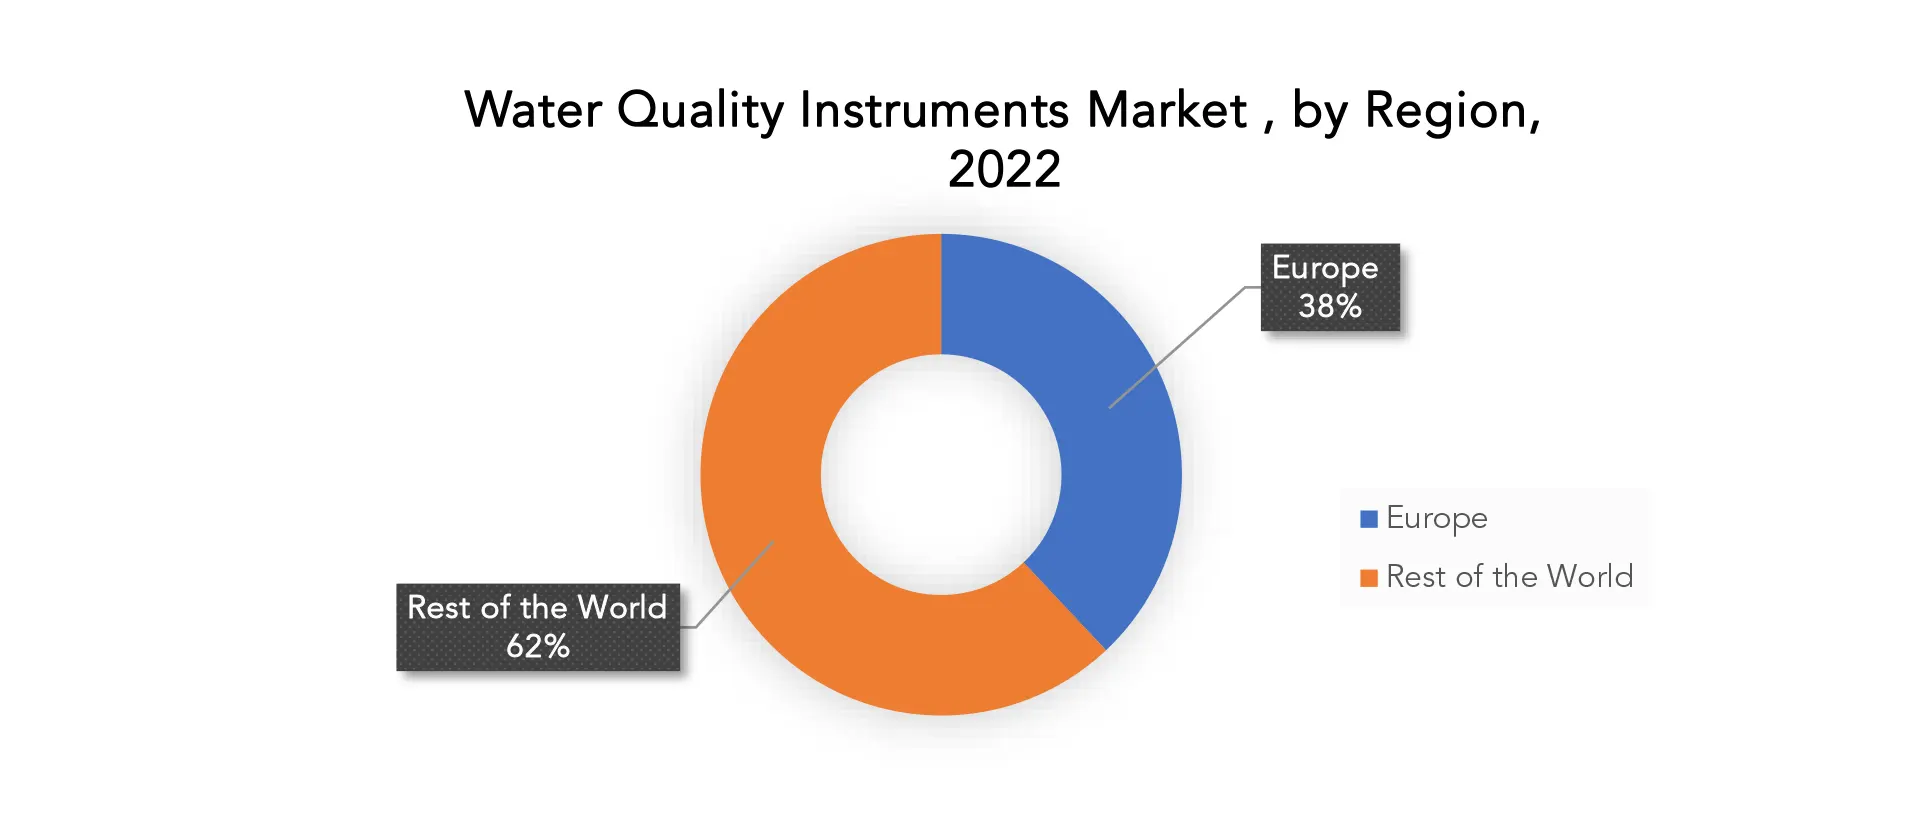
Target Audience for Water Quality Instruments Market
- Environmental Monitoring Agencies
- Water Treatment Plant
- Research Institutions
- Industries
- Consulting Firms
- Water Resource Management Authorities
- Wastewater Treatment Facilities
- Agricultural Sector
- Water Quality Instrument Manufacturers
Segments Covered in the Water Quality Instruments Market
Water Quality Instruments Market by Product- Portable
- Handheld
- Bench-top
- Turbidity
- pH
- Dissolved Oxygen
- Conductivity
- TOC
- Others
- Water Treatment Plants
- Laboratories
- Industrial
- Aquaculture
- Other
- North America
- Europe
- Asia Pacific
- South America
- Middle East and Africa
Key Question Answered
- What is the expected growth rate of the Water Quality Instruments market over the next 7 years?
- Who are the key market participants in Water Quality Instruments, and what are their market share?
- What are the end-user industries driving market demand and what is their outlook?
- What are the opportunities for growth in emerging markets such as Asia-Pacific, the Middle East, and Africa?
- How is the economic environment affecting the Water Quality Instruments market, including factors such as interest rates, inflation, and exchange rates?
- What is the expected impact of government policies and regulations on the Water Quality Instruments market?
- What is the current and forecasted size and growth rate of the global Water Quality Instruments market?
- What are the key drivers of growth in the Water Quality Instruments market?
- Who are the major players in the market and what is their market share?
- What are the distribution channels and supply chain dynamics in the Water Quality Instruments market?
- What are the technological advancements and innovations in the Water Quality Instruments market and their impact on product development and growth?
- What are the regulatory considerations and their impact on the market?
- What are the challenges faced by players in the Water Quality Instruments market and how are they addressing these challenges?
- What are the opportunities for growth and expansion in the Water Quality Instruments market?
- What are the product offerings and specifications of leading players in the market?
- 소개
- 시장 정의
- 시장 세분화
- 연구 일정
- 가정 및 제한
- 연구 방법론
- 데이터 마이닝
- 2차 연구
- 1차 연구
- 주제별 전문가의 조언
- 품질 검사
- 최종 검토
- 데이터 삼각 측량
- 바텀업 방식
- 탑다운 접근 방식
- 연구 흐름
- 데이터 유형
- 데이터 마이닝
- 요약
- 시장 개요
- 글로벌 수질 계측기 시장 전망
- 시장 동인
- 시장 제약
- 시장 기회
- COVID-19가 수질 계측기 시장에 미치는 영향
- 포터의 5가지 힘 모델
- 신규 진입자의 위협
- 대체품으로부터의 위협
- 공급업체의 협상력
- 고객의 협상력
- 경쟁의 정도
- 산업 가치 사슬 분석
- 글로벌 수질 계측기 시장 전망
- GLOBAL WATER QUALITY INSTRUMENTS MARKET BY PRODUCT, 2020-2030, (USD BILLION) (THOUSAND UNITS)
- PORTABLE
- HANDHELD
- BENCH-TOP
- GLOBAL WATER QUALITY INSTRUMENTS MARKET BY APPLICATION, 2020-2030, (USD BILLION) (THOUSAND UNITS)
- TURBIDITY
- PH
- DISSOLVED OXYGEN
- CONDUCTIVITY
- TOC
- OTHERS
- GLOBAL WATER QUALITY INSTRUMENTS MARKET BY END USER, 2020-2030, (USD BILLION) (THOUSAND UNITS)
- WATER TREATMENT PLANTS
- LABORATORIES
- INDUSTRIAL
- AQUACULTURE
- OTHER
- GLOBAL WATER QUALITY INSTRUMENTS MARKET BY REGION, 2020-2030, (USD BILLION) (THOUSAND UNITS)
- NORTH AMERICA
- US
- CANADA
- MEXICO
- SOUTH AMERICA
- BRAZIL
- ARGENTINA
- COLOMBIA
- REST OF SOUTH AMERICA
- EUROPE
- GERMANY
- UK
- FRANCE
- ITALY
- SPAIN
- RUSSIA
- REST OF EUROPE
- ASIA PACIFIC
- INDIA
- CHINA
- JAPAN
- SOUTH KOREA
- AUSTRALIA
- SOUTH-EAST ASIA
- REST OF ASIA PACIFIC
- MIDDLE EAST AND AFRICA
- UAE
- SAUDI ARABIA
- SOUTH AFRICA
- REST OF MIDDLE EAST AND AFRICA
- NORTH AMERICA
- COMPANY PROFILES*
(BUSINESS OVERVIEW, COMPANY SNAPSHOT, PRODUCT OFFERED, RECENT DEVELOPMENTS)
- ABB
- ATI UK
- ENDRESS+HAUSER
- EVOQUA WATER TECHNOLOGIES LLC
- FOCUSED PHOTONICS
- HACH
- HANNA INSTRUMENTS
- HERON INSTRUMENTS INC
- HONEYWELL INTERNATIONAL INC
- HORIBA GROUP
- JENCO INSTRUMENTS INC
- LAMOTTE COMPANY
- METTLER TOLEDO
- OMEGA
- SEA-BIRD SCIENTIFIC
- SUEZ (GE)
- THERMO FISHER SCIENTIFIC
- XYLEM
- YOKOGAWA
*THE COMPANY LIST IS INDICATIVE
LIST OF TABLES
TABLE 1 GLOBAL WATER QUALITY INSTRUMENTS MARKET BY PRODUCT (USD BILLION) 2020-2030
TABLE 2 GLOBAL WATER QUALITY INSTRUMENTS MARKET BY PRODUCT (THOUSAND UNITS) 2020-2030
TABLE 3 GLOBAL WATER QUALITY INSTRUMENTS MARKET BY APPLICATION (USD BILLION) 2020-2030
TABLE 4 GLOBAL WATER QUALITY INSTRUMENTS MARKET BY APPLICATION (THOUSAND UNITS) 2020-2030
TABLE 5 GLOBAL WATER QUALITY INSTRUMENTS MARKET BY END USER (USD BILLION) 2020-2030
TABLE 6 GLOBAL WATER QUALITY INSTRUMENTS MARKET BY END USER (THOUSAND UNITS) 2020-2030
TABLE 7 GLOBAL WATER QUALITY INSTRUMENTS MARKET BY REGION (USD BILLION) 2020-2030
TABLE 8 GLOBAL WATER QUALITY INSTRUMENTS MARKET BY REGION (THOUSAND UNITS) 2020-2030
TABLE 9 NORTH AMERICA WATER QUALITY INSTRUMENTS MARKET BY COUNTRY (USD BILLION) 2020-2030
TABLE 10 NORTH AMERICA WATER QUALITY INSTRUMENTS MARKET BY COUNTRY (THOUSAND UNITS) 2020-2030
TABLE 11 NORTH AMERICA WATER QUALITY INSTRUMENTS MARKET BY PRODUCT (USD BILLION) 2020-2030
TABLE 12 NORTH AMERICA WATER QUALITY INSTRUMENTS MARKET BY PRODUCT (THOUSAND UNITS) 2020-2030
TABLE 13 NORTH AMERICA WATER QUALITY INSTRUMENTS MARKET BY APPLICATION (USD BILLION) 2020-2030
TABLE 14 NORTH AMERICA WATER QUALITY INSTRUMENTS MARKET BY APPLICATION (THOUSAND UNITS) 2020-2030
TABLE 15 NORTH AMERICA WATER QUALITY INSTRUMENTS MARKET BY END USER (USD BILLION) 2020-2030
TABLE 16 NORTH AMERICA WATER QUALITY INSTRUMENTS MARKET BY END USER (THOUSAND UNITS) 2020-2030
TABLE 17 US WATER QUALITY INSTRUMENTS MARKET BY PRODUCT (USD BILLION) 2020-2030
TABLE 18 US WATER QUALITY INSTRUMENTS MARKET BY PRODUCT (THOUSAND UNITS) 2020-2030
TABLE 19 US WATER QUALITY INSTRUMENTS MARKET BY APPLICATION (USD BILLION) 2020-2030
TABLE 20 US WATER QUALITY INSTRUMENTS MARKET BY APPLICATION (THOUSAND UNITS) 2020-2030
TABLE 21 US WATER QUALITY INSTRUMENTS MARKET BY END USER (USD BILLION) 2020-2030
TABLE 22 US WATER QUALITY INSTRUMENTS MARKET BY END USER (THOUSAND UNITS) 2020-2030
TABLE 23 CANADA WATER QUALITY INSTRUMENTS MARKET BY PRODUCT (USD BILLION) 2020-2030
TABLE 24 CANADA WATER QUALITY INSTRUMENTS MARKET BY PRODUCT (THOUSAND UNITS) 2020-2030
TABLE 25 CANADA WATER QUALITY INSTRUMENTS MARKET BY APPLICATION (USD BILLION) 2020-2030
TABLE 26 CANADA WATER QUALITY INSTRUMENTS MARKET BY APPLICATION (THOUSAND UNITS) 2020-2030
TABLE 27 CANADA WATER QUALITY INSTRUMENTS MARKET BY END USER (USD BILLION) 2020-2030
TABLE 28 CANADA WATER QUALITY INSTRUMENTS MARKET BY END USER (THOUSAND UNITS) 2020-2030
TABLE 29 MEXICO WATER QUALITY INSTRUMENTS MARKET BY PRODUCT (USD BILLION) 2020-2030
TABLE 30 MEXICO WATER QUALITY INSTRUMENTS MARKET BY PRODUCT (THOUSAND UNITS) 2020-2030
TABLE 31 MEXICO WATER QUALITY INSTRUMENTS MARKET BY APPLICATION (USD BILLION) 2020-2030
TABLE 32 MEXICO WATER QUALITY INSTRUMENTS MARKET BY APPLICATION (THOUSAND UNITS) 2020-2030
TABLE 33 MEXICO WATER QUALITY INSTRUMENTS MARKET BY END USER (USD BILLION) 2020-2030
TABLE 34 MEXICO WATER QUALITY INSTRUMENTS MARKET BY END USER (THOUSAND UNITS) 2020-2030
TABLE 35 SOUTH AMERICA WATER QUALITY INSTRUMENTS MARKET BY COUNTRY (USD BILLION) 2020-2030
TABLE 36 SOUTH AMERICA WATER QUALITY INSTRUMENTS MARKET BY COUNTRY (THOUSAND UNITS) 2020-2030
TABLE 37 SOUTH AMERICA WATER QUALITY INSTRUMENTS MARKET BY PRODUCT (USD BILLION) 2020-2030
TABLE 38 SOUTH AMERICA WATER QUALITY INSTRUMENTS MARKET BY PRODUCT (THOUSAND UNITS) 2020-2030
TABLE 39 SOUTH AMERICA WATER QUALITY INSTRUMENTS MARKET BY APPLICATION (USD BILLION) 2020-2030
TABLE 40 SOUTH AMERICA WATER QUALITY INSTRUMENTS MARKET BY APPLICATION (THOUSAND UNITS) 2020-2030
TABLE 41 SOUTH AMERICA WATER QUALITY INSTRUMENTS MARKET BY END USER (USD BILLION) 2020-2030
TABLE 42 SOUTH AMERICA WATER QUALITY INSTRUMENTS MARKET BY END USER (THOUSAND UNITS) 2020-2030
TABLE 43 BRAZIL WATER QUALITY INSTRUMENTS MARKET BY PRODUCT (USD BILLION) 2020-2030
TABLE 44 BRAZIL WATER QUALITY INSTRUMENTS MARKET BY PRODUCT (THOUSAND UNITS) 2020-2030
TABLE 45 BRAZIL WATER QUALITY INSTRUMENTS MARKET BY APPLICATION (USD BILLION) 2020-2030
TABLE 46 BRAZIL WATER QUALITY INSTRUMENTS MARKET BY APPLICATION (THOUSAND UNITS) 2020-2030
TABLE 47 BRAZIL WATER QUALITY INSTRUMENTS MARKET BY END USER (USD BILLION) 2020-2030
TABLE 48 BRAZIL WATER QUALITY INSTRUMENTS MARKET BY END USER (THOUSAND UNITS) 2020-2030
TABLE 49 ARGENTINA WATER QUALITY INSTRUMENTS MARKET BY PRODUCT (USD BILLION) 2020-2030
TABLE 50 ARGENTINA WATER QUALITY INSTRUMENTS MARKET BY PRODUCT (THOUSAND UNITS) 2020-2030
TABLE 51 ARGENTINA WATER QUALITY INSTRUMENTS MARKET BY APPLICATION (USD BILLION) 2020-2030
TABLE 52 ARGENTINA WATER QUALITY INSTRUMENTS MARKET BY APPLICATION (THOUSAND UNITS) 2020-2030
TABLE 53 ARGENTINA WATER QUALITY INSTRUMENTS MARKET BY END USER (USD BILLION) 2020-2030
TABLE 54 ARGENTINA WATER QUALITY INSTRUMENTS MARKET BY END USER (THOUSAND UNITS) 2020-2030
TABLE 55 COLOMBIA WATER QUALITY INSTRUMENTS MARKET BY PRODUCT (USD BILLION) 2020-2030
TABLE 56 COLOMBIA WATER QUALITY INSTRUMENTS MARKET BY PRODUCT (THOUSAND UNITS) 2020-2030
TABLE 57 COLOMBIA WATER QUALITY INSTRUMENTS MARKET BY APPLICATION (USD BILLION) 2020-2030
TABLE 58 COLOMBIA WATER QUALITY INSTRUMENTS MARKET BY APPLICATION (THOUSAND UNITS) 2020-2030
TABLE 59 COLOMBIA WATER QUALITY INSTRUMENTS MARKET BY END USER (USD BILLION) 2020-2030
TABLE 60 COLOMBIA WATER QUALITY INSTRUMENTS MARKET BY END USER (THOUSAND UNITS) 2020-2030
TABLE 61 REST OF SOUTH AMERICA WATER QUALITY INSTRUMENTS MARKET BY PRODUCT (USD BILLION) 2020-2030
TABLE 62 REST OF SOUTH AMERICA WATER QUALITY INSTRUMENTS MARKET BY PRODUCT (THOUSAND UNITS) 2020-2030
TABLE 63 REST OF SOUTH AMERICA WATER QUALITY INSTRUMENTS MARKET BY APPLICATION (USD BILLION) 2020-2030
TABLE 64 REST OF SOUTH AMERICA WATER QUALITY INSTRUMENTS MARKET BY APPLICATION (THOUSAND UNITS) 2020-2030
TABLE 65 REST OF SOUTH AMERICA WATER QUALITY INSTRUMENTS MARKET BY END USER (USD BILLION) 2020-2030
TABLE 66 REST OF SOUTH AMERICA WATER QUALITY INSTRUMENTS MARKET BY END USER (THOUSAND UNITS) 2020-2030
TABLE 67 ASIA-PACIFIC WATER QUALITY INSTRUMENTS MARKET BY COUNTRY (USD BILLION) 2020-2030
TABLE 68 ASIA-PACIFIC WATER QUALITY INSTRUMENTS MARKET BY COUNTRY (THOUSAND UNITS) 2020-2030
TABLE 69 ASIA-PACIFIC WATER QUALITY INSTRUMENTS MARKET BY PRODUCT (USD BILLION) 2020-2030
TABLE 70 ASIA-PACIFIC WATER QUALITY INSTRUMENTS MARKET BY PRODUCT (THOUSAND UNITS) 2020-2030
TABLE 71 ASIA-PACIFIC WATER QUALITY INSTRUMENTS MARKET BY APPLICATION (USD BILLION) 2020-2030
TABLE 72 ASIA-PACIFIC WATER QUALITY INSTRUMENTS MARKET BY APPLICATION (THOUSAND UNITS) 2020-2030
TABLE 73 ASIA-PACIFIC WATER QUALITY INSTRUMENTS MARKET BY END USER (USD BILLION) 2020-2030
TABLE 74 ASIA-PACIFIC WATER QUALITY INSTRUMENTS MARKET BY END USER (THOUSAND UNITS) 2020-2030
TABLE 75 INDIA WATER QUALITY INSTRUMENTS MARKET BY PRODUCT (USD BILLION) 2020-2030
TABLE 76 INDIA WATER QUALITY INSTRUMENTS MARKET BY PRODUCT (THOUSAND UNITS) 2020-2030
TABLE 77 INDIA WATER QUALITY INSTRUMENTS MARKET BY APPLICATION (USD BILLION) 2020-2030
TABLE 78 INDIA WATER QUALITY INSTRUMENTS MARKET BY APPLICATION (THOUSAND UNITS) 2020-2030
TABLE 79 INDIA WATER QUALITY INSTRUMENTS MARKET BY END USER (USD BILLION) 2020-2030
TABLE 80 INDIA WATER QUALITY INSTRUMENTS MARKET BY END USER (THOUSAND UNITS) 2020-2030
TABLE 81 CHINA WATER QUALITY INSTRUMENTS MARKET BY PRODUCT (USD BILLION) 2020-2030
TABLE 82 CHINA WATER QUALITY INSTRUMENTS MARKET BY PRODUCT (THOUSAND UNITS) 2020-2030
TABLE 83 CHINA WATER QUALITY INSTRUMENTS MARKET BY APPLICATION (USD BILLION) 2020-2030
TABLE 84 CHINA WATER QUALITY INSTRUMENTS MARKET BY APPLICATION (THOUSAND UNITS) 2020-2030
TABLE 85 CHINA WATER QUALITY INSTRUMENTS MARKET BY END USER (USD BILLION) 2020-2030
TABLE 86 CHINA WATER QUALITY INSTRUMENTS MARKET BY END USER (THOUSAND UNITS) 2020-2030
TABLE 87 JAPAN WATER QUALITY INSTRUMENTS MARKET BY PRODUCT (USD BILLION) 2020-2030
TABLE 88 JAPAN WATER QUALITY INSTRUMENTS MARKET BY PRODUCT (THOUSAND UNITS) 2020-2030
TABLE 89 JAPAN WATER QUALITY INSTRUMENTS MARKET BY APPLICATION (USD BILLION) 2020-2030
TABLE 90 JAPAN WATER QUALITY INSTRUMENTS MARKET BY APPLICATION (THOUSAND UNITS) 2020-2030
TABLE 91 JAPAN WATER QUALITY INSTRUMENTS MARKET BY END USER (USD BILLION) 2020-2030
TABLE 92 JAPAN WATER QUALITY INSTRUMENTS MARKET BY END USER (THOUSAND UNITS) 2020-2030
TABLE 93 SOUTH KOREA WATER QUALITY INSTRUMENTS MARKET BY PRODUCT (USD BILLION) 2020-2030
TABLE 94 SOUTH KOREA WATER QUALITY INSTRUMENTS MARKET BY PRODUCT (THOUSAND UNITS) 2020-2030
TABLE 95 SOUTH KOREA WATER QUALITY INSTRUMENTS MARKET BY APPLICATION (USD BILLION) 2020-2030
TABLE 96 SOUTH KOREA WATER QUALITY INSTRUMENTS MARKET BY APPLICATION (THOUSAND UNITS) 2020-2030
TABLE 97 SOUTH KOREA WATER QUALITY INSTRUMENTS MARKET BY END USER (USD BILLION) 2020-2030
TABLE 98 SOUTH KOREA WATER QUALITY INSTRUMENTS MARKET BY END USER (THOUSAND UNITS) 2020-2030
TABLE 99 AUSTRALIA WATER QUALITY INSTRUMENTS MARKET BY PRODUCT (USD BILLION) 2020-2030
TABLE 100 AUSTRALIA WATER QUALITY INSTRUMENTS MARKET BY PRODUCT (THOUSAND UNITS) 2020-2030
TABLE 101 AUSTRALIA WATER QUALITY INSTRUMENTS MARKET BY APPLICATION (USD BILLION) 2020-2030
TABLE 102 AUSTRALIA WATER QUALITY INSTRUMENTS MARKET BY APPLICATION (THOUSAND UNITS) 2020-2030
TABLE 103 AUSTRALIA WATER QUALITY INSTRUMENTS MARKET BY END USER (USD BILLION) 2020-2030
TABLE 104 AUSTRALIA WATER QUALITY INSTRUMENTS MARKET BY END USER (THOUSAND UNITS) 2020-2030
TABLE 105 SOUTH-EAST ASIA WATER QUALITY INSTRUMENTS MARKET BY PRODUCT (USD BILLION) 2020-2030
TABLE 106 SOUTH-EAST ASIA WATER QUALITY INSTRUMENTS MARKET BY PRODUCT (THOUSAND UNITS) 2020-2030
TABLE 107 SOUTH-EAST ASIA WATER QUALITY INSTRUMENTS MARKET BY APPLICATION (USD BILLION) 2020-2030
TABLE 108 SOUTH-EAST ASIA WATER QUALITY INSTRUMENTS MARKET BY APPLICATION (THOUSAND UNITS) 2020-2030
TABLE 109 SOUTH-EAST ASIA WATER QUALITY INSTRUMENTS MARKET BY END USER (USD BILLION) 2020-2030
TABLE 110 SOUTH-EAST ASIA WATER QUALITY INSTRUMENTS MARKET BY END USER (THOUSAND UNITS) 2020-2030
TABLE 111 REST OF ASIA PACIFIC WATER QUALITY INSTRUMENTS MARKET BY PRODUCT (USD BILLION) 2020-2030
TABLE 112 REST OF ASIA PACIFIC WATER QUALITY INSTRUMENTS MARKET BY PRODUCT (THOUSAND UNITS) 2020-2030
TABLE 113 REST OF ASIA PACIFIC WATER QUALITY INSTRUMENTS MARKET BY APPLICATION (USD BILLION) 2020-2030
TABLE 114 REST OF ASIA PACIFIC WATER QUALITY INSTRUMENTS MARKET BY APPLICATION (THOUSAND UNITS) 2020-2030
TABLE 115 REST OF ASIA PACIFIC WATER QUALITY INSTRUMENTS MARKET BY END USER (USD BILLION) 2020-2030
TABLE 116 REST OF ASIA PACIFIC WATER QUALITY INSTRUMENTS MARKET BY END USER (THOUSAND UNITS) 2020-2030
TABLE 117 EUROPE WATER QUALITY INSTRUMENTS MARKET BY COUNTRY (USD BILLION) 2020-2030
TABLE 118 EUROPE WATER QUALITY INSTRUMENTS MARKET BY COUNTRY (THOUSAND UNITS) 2020-2030
TABLE 119 EUROPE WATER QUALITY INSTRUMENTS MARKET BY PRODUCT (USD BILLION) 2020-2030
TABLE 120 EUROPE WATER QUALITY INSTRUMENTS MARKET BY PRODUCT (THOUSAND UNITS) 2020-2030
TABLE 121 EUROPE WATER QUALITY INSTRUMENTS MARKET BY APPLICATION (USD BILLION) 2020-2030
TABLE 122 EUROPE WATER QUALITY INSTRUMENTS MARKET BY APPLICATION (THOUSAND UNITS) 2020-2030
TABLE 123 EUROPE WATER QUALITY INSTRUMENTS MARKET BY END USER (USD BILLION) 2020-2030
TABLE 124 EUROPE WATER QUALITY INSTRUMENTS MARKET BY END USER (THOUSAND UNITS) 2020-2030
TABLE 125 GERMANY WATER QUALITY INSTRUMENTS MARKET BY PRODUCT (USD BILLION) 2020-2030
TABLE 126 GERMANY WATER QUALITY INSTRUMENTS MARKET BY PRODUCT (THOUSAND UNITS) 2020-2030
TABLE 127 GERMANY WATER QUALITY INSTRUMENTS MARKET BY APPLICATION (USD BILLION) 2020-2030
TABLE 128 GERMANY WATER QUALITY INSTRUMENTS MARKET BY APPLICATION (THOUSAND UNITS) 2020-2030
TABLE 129 GERMANY WATER QUALITY INSTRUMENTS MARKET BY END USER (USD BILLION) 2020-2030
TABLE 130 GERMANY WATER QUALITY INSTRUMENTS MARKET BY END USER (THOUSAND UNITS) 2020-2030
TABLE 131 UK WATER QUALITY INSTRUMENTS MARKET BY PRODUCT (USD BILLION) 2020-2030
TABLE 132 UK WATER QUALITY INSTRUMENTS MARKET BY PRODUCT (THOUSAND UNITS) 2020-2030
TABLE 133 UK WATER QUALITY INSTRUMENTS MARKET BY APPLICATION (USD BILLION) 2020-2030
TABLE 134 UK WATER QUALITY INSTRUMENTS MARKET BY APPLICATION (THOUSAND UNITS) 2020-2030
TABLE 135 UK WATER QUALITY INSTRUMENTS MARKET BY END USER (USD BILLION) 2020-2030
TABLE 136 UK WATER QUALITY INSTRUMENTS MARKET BY END USER (THOUSAND UNITS) 2020-2030
TABLE 137 FRANCE WATER QUALITY INSTRUMENTS MARKET BY PRODUCT (USD BILLION) 2020-2030
TABLE 138 FRANCE WATER QUALITY INSTRUMENTS MARKET BY PRODUCT (THOUSAND UNITS) 2020-2030
TABLE 139 FRANCE WATER QUALITY INSTRUMENTS MARKET BY APPLICATION (USD BILLION) 2020-2030
TABLE 140 FRANCE WATER QUALITY INSTRUMENTS MARKET BY APPLICATION (THOUSAND UNITS) 2020-2030
TABLE 141 FRANCE WATER QUALITY INSTRUMENTS MARKET BY END USER (USD BILLION) 2020-2030
TABLE 142 FRANCE WATER QUALITY INSTRUMENTS MARKET BY END USER (THOUSAND UNITS) 2020-2030
TABLE 143 ITALY WATER QUALITY INSTRUMENTS MARKET BY PRODUCT (USD BILLION) 2020-2030
TABLE 144 ITALY WATER QUALITY INSTRUMENTS MARKET BY PRODUCT (THOUSAND UNITS) 2020-2030
TABLE 145 ITALY WATER QUALITY INSTRUMENTS MARKET BY APPLICATION (USD BILLION) 2020-2030
TABLE 146 ITALY WATER QUALITY INSTRUMENTS MARKET BY APPLICATION (THOUSAND UNITS) 2020-2030
TABLE 147 ITALY WATER QUALITY INSTRUMENTS MARKET BY END USER (USD BILLION) 2020-2030
TABLE 148 ITALY WATER QUALITY INSTRUMENTS MARKET BY END USER (THOUSAND UNITS) 2020-2030
TABLE 149 SPAIN WATER QUALITY INSTRUMENTS MARKET BY PRODUCT (USD BILLION) 2020-2030
TABLE 150 SPAIN WATER QUALITY INSTRUMENTS MARKET BY PRODUCT (THOUSAND UNITS) 2020-2030
TABLE 151 SPAIN WATER QUALITY INSTRUMENTS MARKET BY APPLICATION (USD BILLION) 2020-2030
TABLE 152 SPAIN WATER QUALITY INSTRUMENTS MARKET BY APPLICATION (THOUSAND UNITS) 2020-2030
TABLE 153 SPAIN WATER QUALITY INSTRUMENTS MARKET BY END USER (USD BILLION) 2020-2030
TABLE 154 SPAIN WATER QUALITY INSTRUMENTS MARKET BY END USER (THOUSAND UNITS) 2020-2030
TABLE 155 RUSSIA WATER QUALITY INSTRUMENTS MARKET BY PRODUCT (USD BILLION) 2020-2030
TABLE 156 RUSSIA WATER QUALITY INSTRUMENTS MARKET BY PRODUCT (THOUSAND UNITS) 2020-2030
TABLE 157 RUSSIA WATER QUALITY INSTRUMENTS MARKET BY APPLICATION (USD BILLION) 2020-2030
TABLE 158 RUSSIA WATER QUALITY INSTRUMENTS MARKET BY APPLICATION (THOUSAND UNITS) 2020-2030
TABLE 159 RUSSIA WATER QUALITY INSTRUMENTS MARKET BY END USER (USD BILLION) 2020-2030
TABLE 160 RUSSIA WATER QUALITY INSTRUMENTS MARKET BY END USER (THOUSAND UNITS) 2020-2030
TABLE 161 REST OF EUROPE WATER QUALITY INSTRUMENTS MARKET BY PRODUCT (USD BILLION) 2020-2030
TABLE 162 REST OF EUROPE WATER QUALITY INSTRUMENTS MARKET BY PRODUCT (THOUSAND UNITS) 2020-2030
TABLE 163 REST OF EUROPE WATER QUALITY INSTRUMENTS MARKET BY APPLICATION (USD BILLION) 2020-2030
TABLE 164 REST OF EUROPE WATER QUALITY INSTRUMENTS MARKET BY APPLICATION (THOUSAND UNITS) 2020-2030
TABLE 165 REST OF EUROPE WATER QUALITY INSTRUMENTS MARKET BY END USER (USD BILLION) 2020-2030
TABLE 166 REST OF EUROPE WATER QUALITY INSTRUMENTS MARKET BY END USER (THOUSAND UNITS) 2020-2030
TABLE 167 MIDDLE EAST AND AFRICA WATER QUALITY INSTRUMENTS MARKET BY COUNTRY (USD BILLION) 2020-2030
TABLE 168 MIDDLE EAST AND AFRICA WATER QUALITY INSTRUMENTS MARKET BY COUNTRY (THOUSAND UNITS) 2020-2030
TABLE 169 MIDDLE EAST AND AFRICA WATER QUALITY INSTRUMENTS MARKET BY PRODUCT (USD BILLION) 2020-2030
TABLE 170 MIDDLE EAST AND AFRICA WATER QUALITY INSTRUMENTS MARKET BY PRODUCT (THOUSAND UNITS) 2020-2030
TABLE 171 MIDDLE EAST AND AFRICA WATER QUALITY INSTRUMENTS MARKET BY APPLICATION (USD BILLION) 2020-2030
TABLE 172 MIDDLE EAST AND AFRICA WATER QUALITY INSTRUMENTS MARKET BY APPLICATION (THOUSAND UNITS) 2020-2030
TABLE 173 MIDDLE EAST AND AFRICA WATER QUALITY INSTRUMENTS MARKET BY END USER (USD BILLION) 2020-2030
TABLE 174 MIDDLE EAST AND AFRICA WATER QUALITY INSTRUMENTS MARKET BY END USER (THOUSAND UNITS) 2020-2030
TABLE 175 UAE WATER QUALITY INSTRUMENTS MARKET BY PRODUCT (USD BILLION) 2020-2030
TABLE 176 UAE WATER QUALITY INSTRUMENTS MARKET BY PRODUCT (THOUSAND UNITS) 2020-2030
TABLE 177 UAE WATER QUALITY INSTRUMENTS MARKET BY APPLICATION (USD BILLION) 2020-2030
TABLE 178 UAE WATER QUALITY INSTRUMENTS MARKET BY APPLICATION (THOUSAND UNITS) 2020-2030
TABLE 179 UAE WATER QUALITY INSTRUMENTS MARKET BY END USER (USD BILLION) 2020-2030
TABLE 180 UAE WATER QUALITY INSTRUMENTS MARKET BY END USER (THOUSAND UNITS) 2020-2030
TABLE 181 SAUDI ARABIA WATER QUALITY INSTRUMENTS MARKET BY PRODUCT (USD BILLION) 2020-2030
TABLE 182 SAUDI ARABIA WATER QUALITY INSTRUMENTS MARKET BY PRODUCT (THOUSAND UNITS) 2020-2030
TABLE 183 SAUDI ARABIA WATER QUALITY INSTRUMENTS MARKET BY APPLICATION (USD BILLION) 2020-2030
TABLE 184 SAUDI ARABIA WATER QUALITY INSTRUMENTS MARKET BY APPLICATION (THOUSAND UNITS) 2020-2030
TABLE 185 SAUDI ARABIA WATER QUALITY INSTRUMENTS MARKET BY END USER (USD BILLION) 2020-2030
TABLE 186 SAUDI ARABIA WATER QUALITY INSTRUMENTS MARKET BY END USER (THOUSAND UNITS) 2020-2030
TABLE 187 SOUTH AFRICA WATER QUALITY INSTRUMENTS MARKET BY PRODUCT (USD BILLION) 2020-2030
TABLE 188 SOUTH AFRICA WATER QUALITY INSTRUMENTS MARKET BY PRODUCT (THOUSAND UNITS) 2020-2030
TABLE 189 SOUTH AFRICA WATER QUALITY INSTRUMENTS MARKET BY APPLICATION (USD BILLION) 2020-2030
TABLE 190 SOUTH AFRICA WATER QUALITY INSTRUMENTS MARKET BY APPLICATION (THOUSAND UNITS) 2020-2030
TABLE 191 SOUTH AFRICA WATER QUALITY INSTRUMENTS MARKET BY END USER (USD BILLION) 2020-2030
TABLE 192 SOUTH AFRICA WATER QUALITY INSTRUMENTS MARKET BY END USER (THOUSAND UNITS) 2020-2030
TABLE 193 REST OF MIDDLE EAST AND AFRICA WATER QUALITY INSTRUMENTS MARKET BY PRODUCT (USD BILLION) 2020-2030
TABLE 194 REST OF MIDDLE EAST AND AFRICA WATER QUALITY INSTRUMENTS MARKET BY PRODUCT (THOUSAND UNITS) 2020-2030
TABLE 195 REST OF MIDDLE EAST AND AFRICA WATER QUALITY INSTRUMENTS MARKET BY APPLICATION (USD BILLION) 2020-2030
TABLE 196 REST OF MIDDLE EAST AND AFRICA WATER QUALITY INSTRUMENTS MARKET BY APPLICATION (THOUSAND UNITS) 2020-2030
TABLE 197 REST OF MIDDLE EAST AND AFRICA WATER QUALITY INSTRUMENTS MARKET BY END USER (USD BILLION) 2020-2030
TABLE 198 REST OF MIDDLE EAST AND AFRICA WATER QUALITY INSTRUMENTS MARKET BY END USER (THOUSAND UNITS) 2020-2030
LIST OF FIGURES
FIGURE 1 MARKET DYNAMICS
FIGURE 2 MARKET SEGMENTATION
FIGURE 3 REPORT TIMELINES: YEARS CONSIDERED
FIGURE 4 DATA TRIANGULATION
FIGURE 5 BOTTOM-UP APPROACH
FIGURE 6 TOP-DOWN APPROACH
FIGURE 7 RESEARCH FLOW
FIGURE 8 GLOBAL WATER QUALITY INSTRUMENTS MARKET BY PRODUCT (USD BILLION) 2020-2030
FIGURE 9 GLOBAL WATER QUALITY INSTRUMENTS MARKET BY APPLICATION (USD BILLION) 2020-2030
FIGURE 10 GLOBAL WATER QUALITY INSTRUMENTS MARKET BY END USER (USD BILLION) 2020-2030
FIGURE 11 GLOBAL WATER QUALITY INSTRUMENTS MARKET BY REGION (USD BILLION) 2020-2030
FIGURE 12 PORTER’S FIVE FORCES MODEL
FIGURE 13 GLOBAL WATER QUALITY INSTRUMENTS MARKET BY PRODUCT (USD BILLION) 2022
FIGURE 14 GLOBAL WATER QUALITY INSTRUMENTS MARKET BY APPLICATION (USD BILLION) 2022
FIGURE 15 GLOBAL WATER QUALITY INSTRUMENTS MARKET BY END USER (USD BILLION) 2022
FIGURE 16 GLOBAL WATER QUALITY INSTRUMENTS MARKET BY REGION (USD BILLION) 2022
FIGURE 17 MARKET SHARE ANALYSIS
FIGURE 18 ABB: COMPANY SNAPSHOT
FIGURE 19 ATI UK: COMPANY SNAPSHOT
FIGURE 20 ENDRESS+HAUSER: COMPANY SNAPSHOT
FIGURE 21 EVOQUA WATER TECHNOLOGIES LLC: COMPANY SNAPSHOT
FIGURE 22 FOCUSED PHOTONICS: COMPANY SNAPSHOT
FIGURE 23 HACH: COMPANY SNAPSHOT
FIGURE 24 HANNA INSTRUMENTS: COMPANY SNAPSHOT
FIGURE 25 HERON INSTRUMENTS INC: COMPANY SNAPSHOT
FIGURE 26 HONEYWELL INTERNATIONAL INC: COMPANY SNAPSHOT
FIGURE 27 HORIBA GROUP: COMPANY SNAPSHOT
FIGURE 28 JENCO INSTRUMENTS INC: COMPANY SNAPSHOT
FIGURE 29 LAMOTTE COMPANY: COMPANY SNAPSHOT
FIGURE 30 METTLER TOLEDO: COMPANY SNAPSHOT
FIGURE 31 OMEGA: COMPANY SNAPSHOT
FIGURE 32 SEA-BIRD SCIENTIFIC: COMPANY SNAPSHOT
FIGURE 33 SUEZ (GE): COMPANY SNAPSHOT
FIGURE 34 THERMO FISHER SCIENTIFIC: COMPANY SNAPSHOT
FIGURE 35 XYLEM: COMPANY SNAPSHOT
FIGURE 36 YOKOGAWA
DOWNLOAD FREE SAMPLE REPORT
License Type
SPEAK WITH OUR ANALYST
Want to know more about the report or any specific requirement?
WANT TO CUSTOMIZE THE REPORT?
Our Clients Speak
We asked them to research ‘ Equipment market’ all over the world, and their whole arrangement was helpful to us. thehealthanalytics.com insightful analysis and reports contributed to our current analysis and in creating a future strategy. Besides, the te
Yosuke Mitsui
Senior Associate Construction Equipment Sales & Marketing
We asked them to research ‘Equipment market’ all over the world, and their whole arrangement was helpful to us. thehealthanalytics.com insightful analysis and reports contributed to our current analysis and in creating a future strategy. Besides, the te


