

Base Year Value ()
x.x %
x.x %
CAGR ()
x.x %
x.x %
Forecast Year Value ()
x.x %
x.x %
Historical Data Period
Largest Region
Forecast Period
유형별(아조디카르보나마이드, 과산화수소, 아스코르브산, 아세톤 과산화물 및 이산화염소), 형태(분말 및 액체), 응용 분야(베이커리 제품, 밀가루 및 치즈) 및 지역(북미, 유럽, 아시아 태평양, 남미, 중동 및 아프리카), 2019년부터 2028년까지의 글로벌 트렌드 및 예측
Instant access to hundreds of data points and trends
- Market estimates from 2014-2029
- Competitive analysis, industry segmentation, financial benchmarks
- Incorporates SWOT, Porter's Five Forces and risk management frameworks
- PDF report or online database with Word, Excel and PowerPoint export options
- 100% money back guarantee
표백제 시장 개요
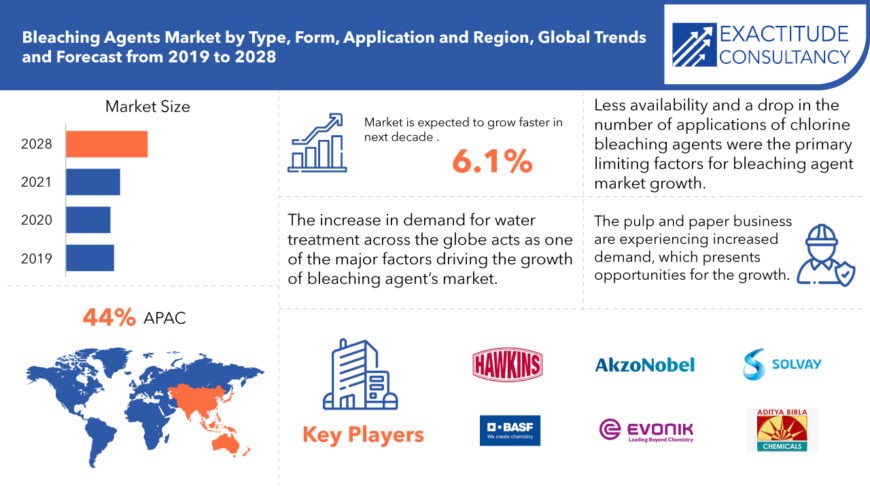
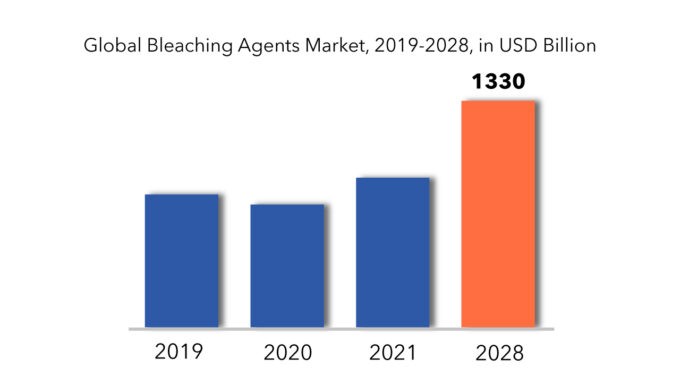
글로벌 표백제 시장은 2019년부터 2028년까지 연평균 성장률 6.1%로 성장할 것으로 예상됩니다. 2019년 7억 8천만 달러에서 2028년까지 13억 3천만 달러를 넘어설 것으로 예상됩니다.
표백제는 직물 에서 색상을 제거하는 데 사용되는 화합물이지만 , 기술의 발전으로 식품 성분의 탈색에 광범위하게 적용되었습니다. 일반적으로 표백 반응은 색상을 제거하는 것을 목표로 하는 산화 또는 환원 과정을 통해 발생합니다.
표백제의 주요 역할 중 하나는 종이, 직물, 폐수, 식품 및 음료 , 개인 관리 용품과 같은 다양한 기질에서 색상을 밝게 하거나 제거하는 것입니다. 처음에는 염소 및 염소 기반 화합물이 표백제로 우세했지만, 이제는 환경적 위험을 완화하기 위해 과산화수소 가 직물 표백에서 이를 대체했습니다.
수많은 국가가 EU 에코라벨 및 산림 관리 협의회(FSC) 인증과 같은 이니셔티브에서 예시되는 규정 및 표준을 제정하여 원소 염소 무함유(ECF) 표백 방법을 옹호하고 있습니다. 이러한 추세는 친환경 표백제 개발을 촉진하여 효과적이고 환경적으로 안전한 얼룩 제거제에 대한 시장 연구 노력을 촉진할 것으로 예상됩니다.
[캡션 id="attachment_4071" 정렬="정렬센터" 너비="870"]
과산화수소는 고수율 펄프 표백을 달성하기 위해 일반적으로 사용되는 화학 물질로 두드러집니다. 그럼에도 불구하고 염소와 그 유도체는 특히 재활용 종이의 경우 펄프 표백에 계속 사용됩니다. 플라스틱 사용에 대한 엄격한 규정으로 인해 최종 사용자는 종이 제조 및 재활용 공정 에 고성능 표백제를 찾게 되었습니다 .
국제자연보전연맹(IUCN)은 매년 약 1,400만 톤의 플라스틱이 바다에 존재하여 해양 생물이 섭취하거나 얽히게 된다고 보고합니다. 환경 친화적이고 지속 가능한 종이 제품에 대한 인식이 높아짐에 따라 유기적 공급원에서 추출한 표백제에 대한 수요가 증가할 것으로 예상됩니다. 게다가 인쇄용지, 티슈, 종이 타월과 같은 고품질 종이 제품에 대한 수요가 증가함에 따라 가까운 미래에 표백제 시장의 매출 성장이 촉진될 것으로 예상됩니다.
[캡션 id="attachment_4073" 정렬="alignleft" 너비="680"]
Bleaching Agent Market Segment Analysis
The global bleach market is divided into several segments, including type, form, application and region. The market is divided into two types, reduced bleach and oxidized bleach.
Based on type, the market is divided into several types, including hydrogen peroxide, ascorbic acid, azodicarbonamide, chlorine dioxide, and others. In terms of market volume and value, the hydrogen peroxide segment has the largest bleaching agent market share. It is particularly useful in the food industry for the production of peroxide agents. The flour segment accounts for the majority of the bleaching agent market share in terms of application. The market is segmented based on application into bakery type, dairy, convenience food, and many more.
Based on form, the powder segment accounted for a larger share of the global market. When bleaching agents, such as ascorbic acid, hydrogen peroxide, and potassium bromates, are stored at room temperature, the powdered form has a longer shelf life and is usually stable for many years. Furthermore, technological advancements have increased the use of powdered bleaching agents because dosing is easier than with liquid bleaching agents. AkzoNobel N.V. (Netherlands) and Aditya Birla Chemicals (India) are two of the market's major suppliers of powdered bleaching agents.
Based on application, among the various applications for bleaching agents, pulp and paper are likely to be the most common. The pulp and paper industry are expected to generate an additional opportunity. Commercial bleaching agents such as chlorine and sodium borohydride are used in the bleaching of pulp and paper. In the pulp and paper industry, chlorine is primarily used as a bleaching agent. However, due to the use of chlorine in the industry in recent years, there has been a growing emphasis on safety concerns.
Bleaching Agent Market Players
The bleaching agent market key players BASF (US), Aditya Birla Chemicals (Grasim) (India), Evonik Industries (Germany), Hawkins. Inc (US), Siemer Milling Company (US), Gujarat Alkalies and Chemicals (India), PeroxyChem (US), Solvay (Belgium), Supraveni Chemicals (India), Spectrum Chemicals Manufacturing Corporation (India), Engrain (US), and AkzoNobel (Netherlands).
To increase their market position, these businesses have implemented a variety of growth tactics. These companies are using expansion, new product development, mergers and acquisitions, and collaboration as important growth strategies to improve their product portfolio and geographical presence in order to meet the rising demand for bleaching agents from emerging economies.
Acquisitions
- Hawkins, Inc. Completes 6th Acquisition In 18 Months With Addition Of NAPCO Chemical Company, Inc.
- Hawkins, Inc. (Nasdaq: HWKN), announced today it has completed its purchase of NAPCO Chemical Company, Inc. and its affiliates (“NAPCO Chemical”). NAPCO Chemical manufactures and distributes water treatment chemicals from three locations in Texas. Hawkins now has 37 water treatment sites serving 26 states.
- NOVEMBER 8, 2018-Evonik to acquire PeroxyChem for $625 million
- Evonik Industries says that it has signed an agreement with One Equity Partners to acquire PeroxyChem (Philadelphia, Pennsylvania) for $625 million. PeroxyChem is a manufacturer of hydrogen peroxide (H2O2) and peracetic acid (PAA). The company employs approximately 600 people, with eight production sites located mainly in North America, but also including Germany, Spain, and Thailand.
Who Should Buy? Or Key Stakeholders
- Bleaching agent manufacturers.
- Raw material suppliers
- Trade associations and industry bodies
- Institutional & retail players.
- Investment research firms
Key Takeaways
- The global Bleaching Agent Market is expected to grow at 6.1% CAGR
- Based on type, the hydrogen peroxide segment has the largest bleaching agent market share.
- Based on form, the powder segment accounted for a larger share of the global market.
- Based on application, the pulp and paper industry are expected to generate an additional opportunity.
- Asia Pacific is expected to have the largest share of the global bleaching agent market.
- Growing demand for eco-friendly bleaching agents due to increasing environmental concerns and regulations.
Bleaching Agent Market Regional Analysis
The bleaching agent market by region includes North America, Asia-Pacific (APAC), Europe, South America, and Middle East & Africa (MEA).
- North America: includes the US, Canada, Mexico
- Asia Pacific: includes China, Japan, South Korea, India, Australia, ASEAN and Rest of APAC
- Europe: includes UK, Germany, France, Italy, Spain, Russia, and Rest of Europe
- South America: includes Brazil, Argentina and Rest of South America
- Middle East & Africa: includes Turkey, UAE, Saudi Arabia, South Africa, and Rest of MEA
Asia Pacific is expected to have the largest share of the global bleaching agent market. The bleaching agent market in Asia Pacific is expected to grow due to growth in various industries such as household cleaner manufacturers, pulp and paper industry, textile, and so on. Meanwhile, Europe and North America are expected to grow in the coming years. The governments of various countries are also working to implement various regulations governing the use of bleaching agents in the manufacture of various products.
[caption id="attachment_4077" align="alignleft" width="680"]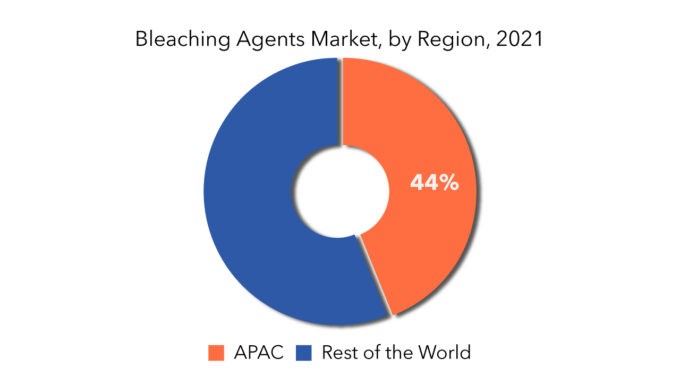
Key Market Segments: Bleaching Agents Market
Bleaching Agents Market by Product Type, 2019-2028, (In USD Million)- Azodicarbonamide
- Hydrogen Peroxide
- Ascorbic Acid
- Acetone Peroxide
- Chlorine Dioxide
- Others
- Powder
- Liquid
- Bakery Products
- Flour
- Cheese
- Others
- North America
- Europe
- Asia Pacific
- South America
- Middle East and Africa
Key Question Answered
- What is the current size of the bleaching agent market?
- What are the key factors influencing the growth of bleaching agents?
- What are the major applications for bleaching agent?
- Who are the major key players in the bleaching agent market?
- Which region will provide more business opportunities for bleaching agent in future?
- Which segment holds the maximum share of the bleaching agent market?
- 소개
- 시장 정의
- 시장 세분화
- 연구 타임라인
- 가정 및 제한 사항
- 연구 방법론
- 데이터 마이닝
- 2차 연구
- 1차 연구
- 주제별 전문가의 조언
- 품질 검사
- 최종 검토
- 데이터 삼각 측량
- 하향식 접근 방식
- 탑다운 접근 방식
- 연구 흐름
- 데이터 소스
- 데이터 마이닝
- 요약
- 시장 개요
- 글로벌 표백제 시장 전망
- 시장 동인
- 시장 제약
- 시장 기회
- Covid-19가 표백제 시장에 미치는 영향
- 포터의 5가지 힘 모델
- 신규 진입업체의 위협
- 대체품의 위협
- 공급업체의 협상력
- 고객의 협상력
- 경쟁의 정도
- 산업 가치 사슬 분석
- 글로벌 표백제 시장 전망
- 유형별 글로벌 표백제 시장
- 아조디카본아미드
- 과산화수소
- 아스코르브산
- 아세톤 과산화물
- 이산화염소
- 기타
- 형태별 글로벌 표백제 시장
- 가루
- 액체
- 응용 분야별 글로벌 표백제 시장
- 베이커리 제품
- 밀가루
- 치즈
- 기타
- 지역별 글로벌 표백제 시장
- 북아메리카
- 우리를
- 캐나다
- 멕시코
- 남아메리카
- 브라질
- 아르헨티나
- 콜롬비아
- 남미의 나머지 지역
- 유럽
- 독일
- 영국
- 프랑스
- 이탈리아
- 스페인
- 러시아 제국
- 유럽의 나머지 지역
- 아시아 태평양
- 인도
- 중국
- 일본
- 대한민국
- 호주
- 동남아시아
- 아시아 태평양의 나머지 지역
- 중동 및 아프리카
- 아랍에미리트
- 사우디 아라비아
- 남아프리카 공화국
- 중동 및 아프리카의 나머지 지역
- 북아메리카
- 회사 프로필* (사업 개요, 회사 스냅샷, 제공되는 자료, 최근 개발 사항)
- 바스프
- 아디티아 비를라 케미컬(Grasim)
- 에보닉
- 솔베이
- 아크조노벨
- 호킨스 주식회사
- 시머 밀링
- 퍼옥시켐
- 수프라베니 케미컬
- 스펙트럼 케미컬
- 스며들게 하다
- Gujarat Alkalies and Chemicals Emami Group *회사 목록은 표시용입니다.
표 목록
TABLE 1 GLOBAL BLEACHING AGENTS MARKET BY TYPE (USD MILLIONS) 2019-2028
TABLE 2 GLOBAL BLEACHING AGENTS MARKET BY TYPE (KILOTONS) 2019-2028
TABLE 3 GLOBAL BLEACHING AGENTS MARKET BY FORM (USD MILLIONS) 2019-2028
TABLE 4 GLOBAL BLEACHING AGENTS MARKET BY FORM (KILOTONS) 2019-2028
TABLE 5 GLOBAL BLEACHING AGENTS MARKET BY APPLICATION (USD MILLIONS) 2019-2028
TABLE 6 GLOBAL BLEACHING AGENTS MARKET BY APPLICATION (KILOTONS) 2019-2028
TABLE 7 GLOBAL BLEACHING AGENTS MARKET BY REGION (USD MILLIONS) 2019-2028
TABLE 8 GLOBAL BLEACHING AGENTS MARKET BY REGION (KILOTONS) 2019-2028
TABLE 9 US BLEACHING AGENTS MARKET BY TYPE (USD MILLIONS) 2019-2028
TABLE 10 US BLEACHING AGENTS MARKET BY TYPE (KILOTONS) 2019-2028
TABLE 11 US BLEACHING AGENTS MARKET BY FORM (USD MILLIONS) 2019-2028
TABLE 12 US BLEACHING AGENTS MARKET BY FORM (KILOTONS) 2019-2028
TABLE 13 US BLEACHING AGENTS MARKET BY APPLICATION (USD MILLIONS) 2019-2028
TABLE 14 US BLEACHING AGENTS MARKET BY APPLICATION (KILOTONS) 2019-2028
TABLE 15 CANADA BLEACHING AGENTS MARKET BY TYPE (USD MILLIONS) 2019-2028
TABLE 16 CANADA BLEACHING AGENTS MARKET BY TYPE (KILOTONS) 2019-2028
TABLE 17 CANADA BLEACHING AGENTS MARKET BY FORM (USD MILLIONS) 2019-2028
TABLE 18 CANADA BLEACHING AGENTS MARKET BY FORM (KILOTONS) 2019-2028
TABLE 19 CANADA BLEACHING AGENTS MARKET BY APPLICATION (USD MILLIONS) 2019-2028
TABLE 20 CANADA BLEACHING AGENTS MARKET BY APPLICATION (KILOTONS) 2019-2028
TABLE 21 MEXICO BLEACHING AGENTS MARKET BY TYPE (USD MILLIONS) 2019-2028
TABLE 22 MEXICO BLEACHING AGENTS MARKET BY TYPE (KILOTONS) 2019-2028
TABLE 23 MEXICO BLEACHING AGENTS MARKET BY FORM (USD MILLIONS) 2019-2028
TABLE 24 MEXICO BLEACHING AGENTS MARKET BY FORM (KILOTONS) 2019-2028
TABLE 25 MEXICO BLEACHING AGENTS MARKET BY APPLICATION (USD MILLIONS) 2019-2028
TABLE 26 MEXICO BLEACHING AGENTS MARKET BY APPLICATION (KILOTONS) 2019-2028
TABLE 27 BRAZIL BLEACHING AGENTS MARKET BY TYPE (USD MILLIONS) 2019-2028
TABLE 28 BRAZIL BLEACHING AGENTS MARKET BY TYPE (KILOTONS) 2019-2028
TABLE 29 BRAZIL BLEACHING AGENTS MARKET BY FORM (USD MILLIONS) 2019-2028
TABLE 30 BRAZIL BLEACHING AGENTS MARKET BY FORM (KILOTONS) 2019-2028
TABLE 31 BRAZIL BLEACHING AGENTS MARKET BY APPLICATION (USD MILLIONS) 2019-2028
TABLE 32 BRAZIL BLEACHING AGENTS MARKET BY APPLICATION (KILOTONS) 2019-2028
TABLE 33 ARGENTINA BLEACHING AGENTS MARKET BY TYPE (USD MILLIONS) 2019-2028
TABLE 34 ARGENTINA BLEACHING AGENTS MARKET BY TYPE (KILOTONS) 2019-2028
TABLE 35 ARGENTINA BLEACHING AGENTS MARKET BY FORM (USD MILLIONS) 2019-2028
TABLE 36 ARGENTINA BLEACHING AGENTS MARKET BY FORM (KILOTONS) 2019-2028
TABLE 37 ARGENTINA BLEACHING AGENTS MARKET BY APPLICATION (USD MILLIONS) 2019-2028
TABLE 38 ARGENTINA BLEACHING AGENTS MARKET BY APPLICATION (KILOTONS) 2019-2028
TABLE 39 COLOMBIA BLEACHING AGENTS MARKET BY TYPE (USD MILLIONS) 2019-2028
TABLE 40 COLOMBIA BLEACHING AGENTS MARKET BY TYPE (KILOTONS) 2019-2028
TABLE 41 COLOMBIA BLEACHING AGENTS MARKET BY FORM (USD MILLIONS) 2019-2028
TABLE 42 COLOMBIA BLEACHING AGENTS MARKET BY FORM (KILOTONS) 2019-2028
TABLE 43 COLOMBIA BLEACHING AGENTS MARKET BY APPLICATION (USD MILLIONS) 2019-2028
TABLE 44 COLOMBIA BLEACHING AGENTS MARKET BY APPLICATION (KILOTONS) 2019-2028
TABLE 45 REST OF SOUTH AMERICA BLEACHING AGENTS MARKET BY TYPE (USD MILLIONS) 2019-2028
TABLE 46 REST OF SOUTH AMERICA BLEACHING AGENTS MARKET BY TYPE (KILOTONS) 2019-2028
TABLE 47 REST OF SOUTH AMERICA BLEACHING AGENTS MARKET BY FORM (USD MILLIONS) 2019-2028
TABLE 48 REST OF SOUTH AMERICA BLEACHING AGENTS MARKET BY FORM (KILOTONS) 2019-2028
TABLE 49 REST OF SOUTH AMERICA BLEACHING AGENTS MARKET BY APPLICATION (USD MILLIONS) 2019-2028
TABLE 50 REST OF SOUTH AMERICA BLEACHING AGENTS MARKET BY APPLICATION (KILOTONS) 2019-2028
TABLE 51 INDIA BLEACHING AGENTS MARKET BY TYPE (USD MILLIONS) 2019-2028
TABLE 52 INDIA BLEACHING AGENTS MARKET BY TYPE (KILOTONS) 2019-2028
TABLE 53 INDIA BLEACHING AGENTS MARKET BY FORM (USD MILLIONS) 2019-2028
TABLE 54 INDIA BLEACHING AGENTS MARKET BY FORM (KILOTONS) 2019-2028
TABLE 55 INDIA BLEACHING AGENTS MARKET BY APPLICATION (USD MILLIONS) 2019-2028
TABLE 56 INDIA BLEACHING AGENTS MARKET BY APPLICATION (KILOTONS) 2019-2028
TABLE 57 CHINA BLEACHING AGENTS MARKET BY TYPE (USD MILLIONS) 2019-2028
TABLE 58 CHINA BLEACHING AGENTS MARKET BY TYPE (KILOTONS) 2019-2028
TABLE 59 CHINA BLEACHING AGENTS MARKET BY FORM (USD MILLIONS) 2019-2028
TABLE 60 CHINA BLEACHING AGENTS MARKET BY FORM (KILOTONS) 2019-2028
TABLE 61 CHINA BLEACHING AGENTS MARKET BY APPLICATION (USD MILLIONS) 2019-2028
TABLE 62 CHINA BLEACHING AGENTS MARKET BY APPLICATION (KILOTONS) 2019-2028
TABLE 63 JAPAN BLEACHING AGENTS MARKET BY TYPE (USD MILLIONS) 2019-2028
TABLE 64 JAPAN BLEACHING AGENTS MARKET BY TYPE (KILOTONS) 2019-2028
TABLE 65 JAPAN BLEACHING AGENTS MARKET BY FORM (USD MILLIONS) 2019-2028
TABLE 66 JAPAN BLEACHING AGENTS MARKET BY FORM (KILOTONS) 2019-2028
TABLE 67 JAPAN BLEACHING AGENTS MARKET BY APPLICATION (USD MILLIONS) 2019-2028
TABLE 68 JAPAN BLEACHING AGENTS MARKET BY APPLICATION (KILOTONS) 2019-2028
TABLE 69 SOUTH KOREA BLEACHING AGENTS MARKET BY TYPE (USD MILLIONS) 2019-2028
TABLE 70 SOUTH KOREA BLEACHING AGENTS MARKET BY TYPE (KILOTONS) 2019-2028
TABLE 71 SOUTH KOREA BLEACHING AGENTS MARKET BY FORM (USD MILLIONS) 2019-2028
TABLE 72 SOUTH KOREA BLEACHING AGENTS MARKET BY FORM (KILOTONS) 2019-2028
TABLE 73 SOUTH KOREA BLEACHING AGENTS MARKET BY APPLICATION (USD MILLIONS) 2019-2028
TABLE 74 SOUTH KOREA BLEACHING AGENTS MARKET BY APPLICATION (KILOTONS) 2019-2028
TABLE 75 AUSTRALIA BLEACHING AGENTS MARKET BY TYPE (USD MILLIONS) 2019-2028
TABLE 76 AUSTRALIA BLEACHING AGENTS MARKET BY TYPE (KILOTONS) 2019-2028
TABLE 77 AUSTRALIA BLEACHING AGENTS MARKET BY FORM (USD MILLIONS) 2019-2028
TABLE 78 AUSTRALIA BLEACHING AGENTS MARKET BY FORM (KILOTONS) 2019-2028
TABLE 79 AUSTRALIA BLEACHING AGENTS MARKET BY APPLICATION (USD MILLIONS) 2019-2028
TABLE 80 AUSTRALIA BLEACHING AGENTS MARKET BY APPLICATION (KILOTONS) 2019-2028
TABLE 81 SOUTH-EAST ASIA BLEACHING AGENTS MARKET BY TYPE (USD MILLIONS) 2019-2028
TABLE 82 SOUTH-EAST ASIA BLEACHING AGENTS MARKET BY TYPE (KILOTONS) 2019-2028
TABLE 83 SOUTH-EAST ASIA BLEACHING AGENTS MARKET BY FORM (USD MILLIONS) 2019-2028
TABLE 84 SOUTH-EAST ASIA BLEACHING AGENTS MARKET BY FORM (KILOTONS) 2019-2028
TABLE 85 SOUTH-EAST ASIA BLEACHING AGENTS MARKET BY APPLICATION (USD MILLIONS) 2019-2028
TABLE 86 SOUTH-EAST ASIA BLEACHING AGENTS MARKET BY APPLICATION (KILOTONS) 2019-2028
TABLE 87 REST OF ASIA PACIFIC BLEACHING AGENTS MARKET BY TYPE (USD MILLIONS) 2019-2028
TABLE 88 REST OF ASIA PACIFIC BLEACHING AGENTS MARKET BY TYPE (KILOTONS) 2019-2028
TABLE 89 REST OF ASIA PACIFIC BLEACHING AGENTS MARKET BY FORM (USD MILLIONS) 2019-2028
TABLE 90 REST OF ASIA PACIFIC BLEACHING AGENTS MARKET BY FORM (KILOTONS) 2019-2028
TABLE 91 REST OF ASIA PACIFIC BLEACHING AGENTS MARKET BY APPLICATION (USD MILLIONS) 2019-2028
TABLE 92 REST OF ASIA PACIFIC BLEACHING AGENTS MARKET BY APPLICATION (KILOTONS) 2019-2028
TABLE 93 GERMANY BLEACHING AGENTS MARKET BY TYPE (USD MILLIONS) 2019-2028
TABLE 94 GERMANY BLEACHING AGENTS MARKET BY TYPE (KILOTONS) 2019-2028
TABLE 95 GERMANY BLEACHING AGENTS MARKET BY FORM (USD MILLIONS) 2019-2028
TABLE 96 GERMANY BLEACHING AGENTS MARKET BY FORM (KILOTONS) 2019-2028
TABLE 97 GERMANY BLEACHING AGENTS MARKET BY APPLICATION (USD MILLIONS) 2019-2028
TABLE 98 GERMANY BLEACHING AGENTS MARKET BY APPLICATION (KILOTONS) 2019-2028
TABLE 99 UK BLEACHING AGENTS MARKET BY TYPE (USD MILLIONS) 2019-2028
TABLE 100 UK BLEACHING AGENTS MARKET BY TYPE (KILOTONS) 2019-2028
TABLE 101 UK BLEACHING AGENTS MARKET BY FORM (USD MILLIONS) 2019-2028
TABLE 102 UK BLEACHING AGENTS MARKET BY FORM (KILOTONS) 2019-2028
TABLE 103 UK BLEACHING AGENTS MARKET BY APPLICATION (USD MILLIONS) 2019-2028
TABLE 104 UK BLEACHING AGENTS MARKET BY APPLICATION (KILOTONS) 2019-2028
TABLE 105 FRANCE BLEACHING AGENTS MARKET BY TYPE (USD MILLIONS) 2019-2028
TABLE 106 FRANCE BLEACHING AGENTS MARKET BY TYPE (KILOTONS) 2019-2028
TABLE 107 FRANCE BLEACHING AGENTS MARKET BY FORM (USD MILLIONS) 2019-2028
TABLE 108 FRANCE BLEACHING AGENTS MARKET BY FORM (KILOTONS) 2019-2028
TABLE 109 FRANCE BLEACHING AGENTS MARKET BY APPLICATION (USD MILLIONS) 2019-2028
TABLE 110 FRANCE BLEACHING AGENTS MARKET BY APPLICATION (KILOTONS) 2019-2028
TABLE 111 ITALY BLEACHING AGENTS MARKET BY TYPE (USD MILLIONS) 2019-2028
TABLE 112 ITALY BLEACHING AGENTS MARKET BY TYPE (KILOTONS) 2019-2028
TABLE 113 ITALY BLEACHING AGENTS MARKET BY FORM (USD MILLIONS) 2019-2028
TABLE 114 ITALY BLEACHING AGENTS MARKET BY FORM (KILOTONS) 2019-2028
TABLE 115 ITALY BLEACHING AGENTS MARKET BY APPLICATION (USD MILLIONS) 2019-2028
TABLE 116 ITALY BLEACHING AGENTS MARKET BY APPLICATION (KILOTONS) 2019-2028
TABLE 117 SPAIN BLEACHING AGENTS MARKET BY TYPE (USD MILLIONS) 2019-2028
TABLE 118 SPAIN BLEACHING AGENTS MARKET BY TYPE (KILOTONS) 2019-2028
TABLE 119 SPAIN BLEACHING AGENTS MARKET BY FORM (USD MILLIONS) 2019-2028
TABLE 120 SPAIN BLEACHING AGENTS MARKET BY FORM (KILOTONS) 2019-2028
TABLE 121 SPAIN BLEACHING AGENTS MARKET BY APPLICATION (USD MILLIONS) 2019-2028
TABLE 122 SPAIN BLEACHING AGENTS MARKET BY APPLICATION (KILOTONS) 2019-2028
TABLE 123 RUSSIA BLEACHING AGENTS MARKET BY TYPE (USD MILLIONS) 2019-2028
TABLE 124 RUSSIA BLEACHING AGENTS MARKET BY TYPE (KILOTONS) 2019-2028
TABLE 125 RUSSIA BLEACHING AGENTS MARKET BY FORM (USD MILLIONS) 2019-2028
TABLE 126 RUSSIA BLEACHING AGENTS MARKET BY FORM (KILOTONS) 2019-2028
TABLE 127 RUSSIA BLEACHING AGENTS MARKET BY APPLICATION (USD MILLIONS) 2019-2028
TABLE 128 RUSSIA BLEACHING AGENTS MARKET BY APPLICATION (KILOTONS) 2019-2028
TABLE 129 REST OF EUROPE BLEACHING AGENTS MARKET BY TYPE (USD MILLIONS) 2019-2028
TABLE 130 REST OF EUROPE BLEACHING AGENTS MARKET BY TYPE (KILOTONS) 2019-2028
TABLE 131 REST OF EUROPE BLEACHING AGENTS MARKET BY FORM (USD MILLIONS) 2019-2028
TABLE 132 REST OF EUROPE BLEACHING AGENTS MARKET BY FORM (KILOTONS) 2019-2028
TABLE 133 REST OF EUROPE BLEACHING AGENTS MARKET BY APPLICATION (USD MILLIONS) 2019-2028
TABLE 134 REST OF EUROPE BLEACHING AGENTS MARKET BY APPLICATION (KILOTONS) 2019-2028
TABLE 135 UAE BLEACHING AGENTS MARKET BY TYPE (USD MILLIONS) 2019-2028
TABLE 136 UAE BLEACHING AGENTS MARKET BY TYPE (KILOTONS) 2019-2028
TABLE 137 UAE BLEACHING AGENTS MARKET BY FORM (USD MILLIONS) 2019-2028
TABLE 138 UAE BLEACHING AGENTS MARKET BY FORM (KILOTONS) 2019-2028
TABLE 139 UAE BLEACHING AGENTS MARKET BY APPLICATION (USD MILLIONS) 2019-2028
TABLE 140 UAE BLEACHING AGENTS MARKET BY APPLICATION (KILOTONS) 2019-2028
TABLE 141 SAUDI ARABIA BLEACHING AGENTS MARKET BY TYPE (USD MILLIONS) 2019-2028
TABLE 142 SAUDI ARABIA BLEACHING AGENTS MARKET BY TYPE (KILOTONS) 2019-2028
TABLE 143 SAUDI ARABIA BLEACHING AGENTS MARKET BY FORM (USD MILLIONS) 2019-2028
TABLE 144 SAUDI ARABIA BLEACHING AGENTS MARKET BY FORM (KILOTONS) 2019-2028
TABLE 145 SAUDI ARABIA BLEACHING AGENTS MARKET BY APPLICATION (USD MILLIONS) 2019-2028
TABLE 146 SAUDI ARABIA BLEACHING AGENTS MARKET BY APPLICATION (KILOTONS) 2019-2028
TABLE 147 SOUTH AFRICA BLEACHING AGENTS MARKET BY TYPE (USD MILLIONS) 2019-2028
TABLE 148 SOUTH AFRICA BLEACHING AGENTS MARKET BY TYPE (KILOTONS) 2019-2028
TABLE 149 SOUTH AFRICA BLEACHING AGENTS MARKET BY FORM (USD MILLIONS) 2019-2028
TABLE 150 SOUTH AFRICA BLEACHING AGENTS MARKET BY FORM (KILOTONS) 2019-2028
TABLE 151 SOUTH AFRICA BLEACHING AGENTS MARKET BY APPLICATION (USD MILLIONS) 2019-2028
TABLE 152 SOUTH AFRICA BLEACHING AGENTS MARKET BY APPLICATION (KILOTONS) 2019-2028
TABLE 153 REST OF MIDDLE EAST AND AFRICA BLEACHING AGENTS MARKET BY TYPE (USD MILLIONS) 2019-2028
TABLE 154 REST OF MIDDLE EAST AND AFRICA BLEACHING AGENTS MARKET BY TYPE (KILOTONS) 2019-2028
TABLE 155 REST OF MIDDLE EAST AND AFRICA BLEACHING AGENTS MARKET BY FORM (USD MILLIONS) 2019-2028
TABLE 156 REST OF MIDDLE EAST AND AFRICA BLEACHING AGENTS MARKET BY FORM (KILOTONS) 2019-2028
TABLE 157 REST OF MIDDLE EAST AND AFRICA BLEACHING AGENTS MARKET BY APPLICATION (USD MILLIONS) 2019-2028
TABLE 158 REST OF MIDDLE EAST AND AFRICA BLEACHING AGENTS MARKET BY APPLICATION (KILOTONS) 2019-2028
LIST OF FIGURES
FIGURE 1 MARKET DYNAMICS
FIGURE 2 MARKET SEGMENTATION
FIGURE 3 REPORT TIMELINES: YEARS CONSIDERED
FIGURE 4 DATA TRIANGULATION
FIGURE 5 BOTTOM-UP APPROACH
FIGURE 6 TOP-DOWN APPROACH
FIGURE 7 RESEARCH FLOW
FIGURE 8 GLOBAL BLEACHING AGENTS MARKET BY TYPE, USD MILLION, 2019-2028
FIGURE 9 GLOBAL BLEACHING AGENTS MARKET BY FORM, USD MILLION, 2019-2028
FIGURE 10 GLOBAL BLEACHING AGENTS MARKET BY APPLICATION, USD MILLION, 2019-2028
FIGURE 11 GLOBAL BLEACHING AGENTS MARKET BY REGION, USD MILLION, 2019-2028
FIGURE 12 PORTER’S FIVE FORCES MODEL
FIGURE 13 NORTH AMERICA BLEACHING AGENTS MARKET SNAPSHOT
FIGURE 14 EUROPE BLEACHING AGENTS MARKET SNAPSHOT
FIGURE 15 ASIA PACIFIC BLEACHING AGENTS MARKET SNAPSHOT
FIGURE 16 SOUTH AMERICA BLEACHING AGENTS MARKET SNAPSHOT
FIGURE 17 MIDDLE EAST & AFRICA BLEACHING AGENTS MARKET SNAPSHOT
FIGURE 18 BASF: COMPANY SNAPSHOT
FIGURE 19 ADITYA BIRLA CHEMICALS (GRASIM): COMPANY SNAPSHOT
FIGURE 20 EVONIK: COMPANY SNAPSHOT
FIGURE 21 SOLVAY: COMPANY SNAPSHOT
FIGURE 22 AKZONOBEL: COMPANY SNAPSHOT
FIGURE 23 HAWKINS, INC.: COMPANY SNAPSHOT
FIGURE 24 SIEMER MILLING: COMPANY SNAPSHOT
FIGURE 25 PEROXYCHEM: COMPANY SNAPSHOT
FIGURE 26 SUPRAVENI CHEMICALS: COMPANY SNAPSHOT
FIGURE 27 SPECTRUM CHEMICALS: COMPANY SNAPSHOT
FIGURE 28 ENGRAIN: COMPANY SNAPSHOT
FIGURE 29 GUJARAT ALKALIES AND CHEMICALS EMAMI GROUP: COMPANY SNAPSHOT
DOWNLOAD FREE SAMPLE REPORT
License Type
SPEAK WITH OUR ANALYST
Want to know more about the report or any specific requirement?
WANT TO CUSTOMIZE THE REPORT?
Our Clients Speak
We asked them to research ‘ Equipment market’ all over the world, and their whole arrangement was helpful to us. thehealthanalytics.com insightful analysis and reports contributed to our current analysis and in creating a future strategy. Besides, the te
Yosuke Mitsui
Senior Associate Construction Equipment Sales & Marketing
We asked them to research ‘Equipment market’ all over the world, and their whole arrangement was helpful to us. thehealthanalytics.com insightful analysis and reports contributed to our current analysis and in creating a future strategy. Besides, the te


