

Base Year Value ()
x.x %
x.x %
CAGR ()
x.x %
x.x %
Forecast Year Value ()
x.x %
x.x %
Historical Data Period
Largest Region
Forecast Period
제품 유형(선체 장착형, 선미 장착형, 소노부이), 응용 분야(상업 및 방위) 및 최종 사용자(라인 장착 및 개조) 및 지역(북미, 유럽, 아시아 태평양, 남미, 중동 및 아프리카)별 SONAR 시스템 시장, 글로벌 기회 분석 및 산업 전망 2022-2029
Instant access to hundreds of data points and trends
- Market estimates from 2014-2029
- Competitive analysis, industry segmentation, financial benchmarks
- Incorporates SWOT, Porter's Five Forces and risk management frameworks
- PDF report or online database with Word, Excel and PowerPoint export options
- 100% money back guarantee
SONAR 시스템 시장 개요
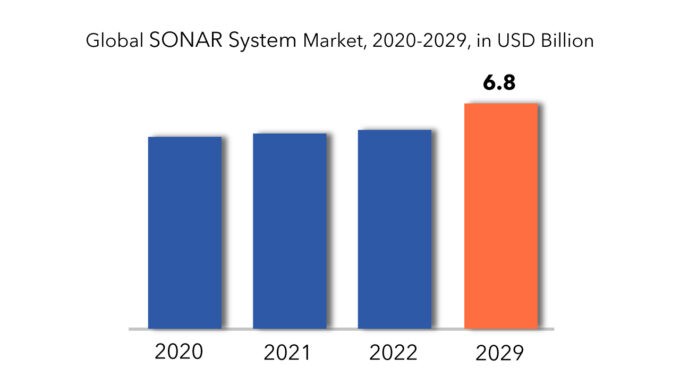
SONAR 시스템 시장 규모는 2020년에 57억 9천만 달러로 추산되며, 2029년까지 68억 달러에 도달할 것으로 예상되며, 2022년부터 2029년까지 연평균 성장률은 1.8%입니다 .
SONAR(Sound Navigation and Ranging) 시스템은 음파 펄스를 방출하고 그에 따른 에코를 분석하여 잠긴 물체를 탐지하고 위치를 파악하는 데 사용되는 기술 장치입니다. 박쥐가 사용하는 에코로케이션 메커니즘과 유사하게, SONAR 시스템은 음파 펄스를 수중 매질로 투사한 후, 잠긴 개체에서 반사되어 시스템으로 돌아옵니다. 에코 신호의 속성과 함께 음파 방출과 수신 사이의 시간 간격을 세심히 조사하여 SONAR 시스템은 수중 개체의 거리, 방향, 크기, 형태를 포함하되 이에 국한되지 않는 관련 지표를 확인합니다.
군함의 분포에서 관찰되는 일관된 확장은 SONAR 시스템 시장을 촉진할 것으로 예상됩니다. 군함은 정밀성의 정점을 달성하기 위해 매우 정교한 SONAR 시스템의 하위 집합에 의존합니다. 군함의 영역 내에서 SONAR 시스템은 지뢰 탐지, 해저 지형 분석, 대잠수함전, 다이버 탐지 및 항구 보안을 포함한 다양한 목적을 제공합니다. 특정 종류의 선박은 특정 운영 요구 사항에 맞게 조정된 다양한 SONAR 구성을 활용합니다. 예를 들어, 잠수함은 적의 해역에서 은밀한 기동을 위해 수동 SONAR를 사용하는 반면, 호위함 및 코르벳과 같은 선박은 적 탐지를 위해 다중 정적 SONAR를 선택합니다. 이러한 군함의 분포 급증은 가까운 미래에 SONAR 시스템 시장의 성장 궤적에 좋은 조짐을 보입니다.
[캡션 id="attachment_9316" 정렬="정렬센터" 너비="870"]
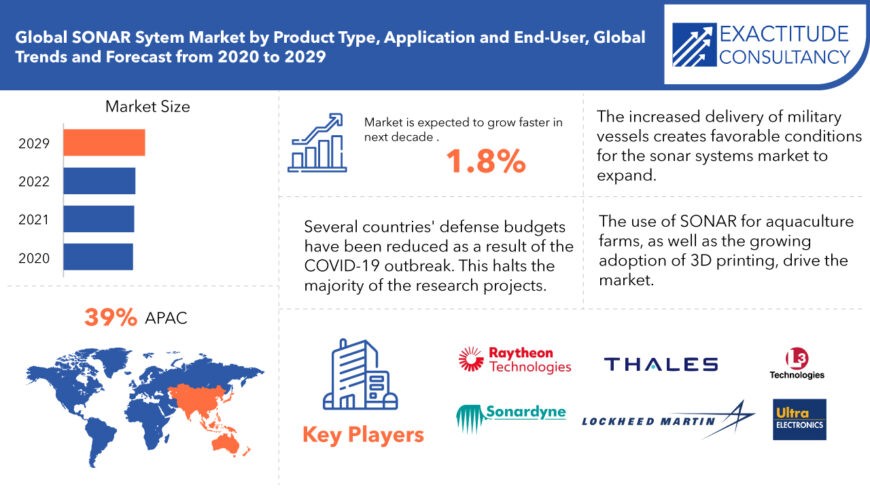
또한, 물고기 감시에 사용되는 SONAR 시스템은 딥 신경망 아키텍처를 통합합니다 . 어류 자원을 증강하기 위한 양식 시설에서 어류 모니터링 에 대한 수요가 급증함에 따라 이러한 모니터링 기술에 대한 요구 사항이 확대될 준비가 되었습니다. 수중 광학 카메라로 보완된 고충실도 이미징 SONAR 장치로 구성된 딥 신경망 SONAR 시스템은 주간 감시를 용이하게 하고 양식 관행의 개선에 기여하여 시장 확장을 촉진합니다.
[캡션 id="attachment_9317" 정렬="정렬센터" 너비="680"]
SONAR System Market Segment Analysis
Based on product type, the market is segmented into hull-mounted, stern-mounted and sonobuoy. The hull-mounted segment consists of forward-looking sonar, echo sounders, and omni-directional sonar. The hull-mounted is the dominant segment in SONAR system market. The increased demand for forward-looking sonar in defense vessels is attributed to the growth. Such systems are used to improve the efficiency of naval ships through vessel traffic management services. The Sonobuoy segment will experience rapid growth as the navy's ability to combat submarine attack threats improves. The stern-mounted segment is expected to grow significantly as demand for towed array sonar systems for surveillance and reconnaissance activities rises.
By application, the market is divided into commercial and defense. The commercial segment is expected to grow the fastest during the forecast period. This expansion can be attributed to rising demand for oil and gas survey applications such as hydrographic surveys, fish chirp sonars, and improving overall ship delivery and retrofitting operations. The increase in defense sector can be attributed to the increased use of sonars for mine detection, countermeasure operations, and port security.
The market is divided into two segments based on end-user: line fit and retrofit. During the forecast period, the line-fit segment is expected to grow the fastest. The driver is the increased demand for naval vessels outfitted with advanced sonar systems. The expansion of retrofit segment can be attributed to an increase in the upgrade of connected systems for conventional naval ships.
SONAR System Market Players
The key market players in SONAR system include Thales Group (France), Atlas Elektronik GmbH (Germany), Raytheon Company (US), Lockheed Martin (US), L-3 Technologies Inc. (US) and Ultra Electronics (UK). Major players in the hydrographic sonar market include Kongsberg Gruppen ASA (Norway), Teledyne Technologies Inc. (US), and Sonardyne (UK). Navigation and fisheries sonars are provided by Furuno Electric Co., Ltd. (Japan), Japan Radio Company (Japan), Navico (Norway), and FLIR Systems (US).
New strategies such as product launches, enhancements, partnerships, collaborations, and strategic acquisitions were adopted by market players to strengthen their product portfolios and maintain a competitive position in the market.
Who Should Buy? Or Key Stakeholders
- Defense
- Hydrographic Charting
- Offshore Oil and Gas Industries
- Port and Harbor Management
- Coastal Engineering Companies
- Others
Key Takeaways
- The SONAR system market is estimated to grow at a CAGR of 1.8%
- Based on product type, the hull-mounted is the dominant segment in SONAR system market.
- Based on application, the commercial segment is expected to grow the fastest during the forecast period.
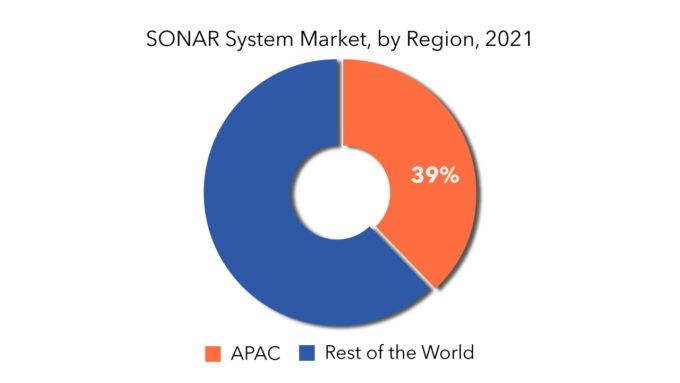
- Asia Pacific dominated the regional market share.
- The major trend in the SONAR system market is the integration of advanced signal processing algorithms for enhanced detection and classification capabilities.
SONAR System Market Regional Analysis
Geographically, the SONAR SYSTEM market is segmented into North America, South America, Europe, Asia Pacific and Middle East & Africa (MEA). Asia Pacific is expected to dominate the SONAR system market due to numerous factors such as a large consumer base and industrialization & urbanization.
- Asia Pacific: includes China, Japan, South Korea, India, Australia, and Rest of APAC
- Europe: includes UK, Germany, France, Italy, Spain, and Rest of Europe
- North America: includes the US, Canada, Mexico
- South America: Brazil and Rest of South America
- Middle East & Africa: includes Saudi Arabia, South Africa, and Rest of MEA
[caption id="attachment_9318" align="alignnone" width="680"]
SONAR System Market | Exactitude Consultancy [/caption]
Key Market Segments: Global Sonar System Market
SONAR System Market by Product Type, 2022-2029 (In USD Million, Thousand Units)- Hull-Mounted
- Stern-Mounted
- Sonobouy
- Commercial
- Defense
- Line Fit
- Retrofit
- Asia Pacific
- Europe
- North America
- South America
- Middle East And Africa
Key Question Answered
- What is the current scenario of the global SONAR system market?
- What are the emerging technologies for the development of SONAR system market?
- What are the historical size and the present size of the market segments and their future potential?
- What are the major catalysts for the market and their impact during the short, medium, and long terms?
- What are the evolving opportunities for the players in the market?
- Which are the key regions from the investment perspective?
- What are the key strategies being adopted by the major players to up their market shares?
- 소개
- 시장 정의
- 시장 세분화
- 연구 타임라인
- 가정 및 제한 사항
- 연구 방법론
- 데이터 마이닝
- 2차 연구
- 1차 연구
- 주제별 전문가의 조언
- 품질 검사
- 최종 검토
- 데이터 삼각 측량
- 하향식 접근 방식
- 탑다운 접근 방식
- 연구 흐름
- 데이터 소스
- 데이터 마이닝
- 요약
- 시장 개요
- 글로벌 소나 시스템 시장 전망
- 시장 동인
- 시장 제약
- 시장 기회
- 코로나19가 소나 시스템 시장에 미치는 영향
- 포터의 5가지 힘 모델
- 신규 진입업체의 위협
- 대체품의 위협
- 공급업체의 협상력
- 고객의 협상력
- 경쟁의 정도
- 산업 가치 사슬 분석
- 글로벌 소나 시스템 시장 전망
- 제품 유형별 글로벌 소나 시스템 시장
- 선체 장착형
- 선미 장착
- 소노부이
- 응용 프로그램별 글로벌 소나 시스템 시장
- 광고
- 방어
- 최종 사용자별 글로벌 소나 시스템 시장
- 라인핏
- 개조
- 지역별 글로벌 소나 시스템 시장
- 북아메리카
- 우리를
- 캐나다
- 멕시코
- 남아메리카
- 브라질
- 남미의 나머지 지역
- 유럽
- 독일
- 영국
- 프랑스
- 이탈리아
- 스페인
- 유럽의 나머지 지역
- 아시아 태평양
- 인도
- 중국
- 일본
- 대한민국
- 호주
- 아시아 태평양의 나머지 지역
- 중동 및 아프리카
- 사우디 아라비아
- 남아프리카 공화국
- 중동 및 아프리카의 나머지 지역
- 북아메리카
- 회사 프로필* (사업 개요, 회사 스냅샷, 제공되는 제품, 최근 개발 사항)
- 탈레스 그룹
- 아틀라스 일렉트로닉 GmbH
- 레이시온 회사
- 록히드 마틴
- L-3테크놀로지 주식회사
- 울트라 일렉트로닉스
- 콩스버그 그루펜 ASA
- 텔레다인 테크놀로지스 주식회사
- 소나르다인
- 후루노 전기 주식회사
- 일본 라디오 회사
- 나비코
- 플리어 시스템
*회사 목록은 표시용입니다.
표 목록
TABLE 1 GLOBAL SONAR SYSTEM MARKET BY APPLICATION (USD MILLIONS) 2020-2029
TABLE 2 GLOBAL SONAR SYSTEM MARKET BY APPLICATION (THOUSAND UNITS) 2020-2029
TABLE 3 GLOBAL SONAR SYSTEM MARKET BY PRODUCT TYPE (USD MILLIONS) 2020-2029
TABLE 4 GLOBAL SONAR SYSTEM MARKET BY PRODUCT TYPE (THOUSAND UNITS) 2020-2029
TABLE 5 GLOBAL SONAR SYSTEM MARKET BY END USER (USD MILLIONS) 2020-2029
TABLE 6 GLOBAL SONAR SYSTEM MARKET BY END USER (THOUSAND UNITS) 2020-2029
TABLE 7 US SONAR SYSTEM MARKET BY APPLICATION (USD MILLIONS) 2020-2029
TABLE 8 US SONAR SYSTEM MARKET BY APPLICATION (THOUSAND UNITS) 2020-2029
TABLE 9 US SONAR SYSTEM MARKET BY PRODUCT TYPE (USD MILLIONS) 2020-2029
TABLE 10 US SONAR SYSTEM MARKET BY PRODUCT TYPE (THOUSAND UNITS) 2020-2029
TABLE 11 US SONAR SYSTEM MARKET BY END USER (USD MILLIONS) 2020-2029
TABLE 12 US SONAR SYSTEM MARKET BY END USER (THOUSAND UNITS) 2020-2029
TABLE 13 CANADA SONAR SYSTEM MARKET BY APPLICATION (USD MILLIONS) 2020-2029
TABLE 14 CANADA SONAR SYSTEM MARKET BY APPLICATION (THOUSAND UNITS) 2020-2029
TABLE 15 CANADA SONAR SYSTEM MARKET BY PRODUCT TYPE (USD MILLIONS) 2020-2029
TABLE 16 CANADA SONAR SYSTEM MARKET BY PRODUCT TYPE (THOUSAND UNITS) 2020-2029
TABLE 17 CANADA SONAR SYSTEM MARKET BY END USER (USD MILLIONS) 2020-2029
TABLE 18 CANADA SONAR SYSTEM MARKET BY END USER (THOUSAND UNITS) 2020-2029
TABLE 19 MEXICO SONAR SYSTEM MARKET BY APPLICATION (USD MILLIONS) 2020-2029
TABLE 20 MEXICO SONAR SYSTEM MARKET BY APPLICATION (THOUSAND UNITS) 2020-2029
TABLE 21 MEXICO SONAR SYSTEM MARKET BY PRODUCT TYPE (USD MILLIONS) 2020-2029
TABLE 22 MEXICO SONAR SYSTEM MARKET BY PRODUCT TYPE (THOUSAND UNITS) 2020-2029
TABLE 23 MEXICO SONAR SYSTEM MARKET BY END USER (USD MILLIONS) 2020-2029
TABLE 24 MEXICO SONAR SYSTEM MARKET BY END USER (THOUSAND UNITS) 2020-2029
TABLE 25 BRAZIL SONAR SYSTEM MARKET BY APPLICATION (USD MILLIONS) 2020-2029
TABLE 26 BRAZIL SONAR SYSTEM MARKET BY APPLICATION (THOUSAND UNITS) 2020-2029
TABLE 27 BRAZIL SONAR SYSTEM MARKET BY PRODUCT TYPE (USD MILLIONS) 2020-2029
TABLE 28 BRAZIL SONAR SYSTEM MARKET BY PRODUCT TYPE (THOUSAND UNITS) 2020-2029
TABLE 29 BRAZIL SONAR SYSTEM MARKET BY END USER (USD MILLIONS) 2020-2029
TABLE 30 BRAZIL SONAR SYSTEM MARKET BY END USER (THOUSAND UNITS) 2020-2029
TABLE 31 ARGENTINA SONAR SYSTEM MARKET BY APPLICATION (USD MILLIONS) 2020-2029
TABLE 32 ARGENTINA SONAR SYSTEM MARKET BY APPLICATION (THOUSAND UNITS) 2020-2029
TABLE 33 ARGENTINA SONAR SYSTEM MARKET BY PRODUCT TYPE (USD MILLIONS) 2020-2029
TABLE 34 ARGENTINA SONAR SYSTEM MARKET BY PRODUCT TYPE (THOUSAND UNITS) 2020-2029
TABLE 35 ARGENTINA SONAR SYSTEM MARKET BY END USER (USD MILLIONS) 2020-2029
TABLE 36 ARGENTINA SONAR SYSTEM MARKET BY END USER (THOUSAND UNITS) 2020-2029
TABLE 37 COLOMBIA SONAR SYSTEM MARKET BY APPLICATION (USD MILLIONS) 2020-2029
TABLE 38 COLOMBIA SONAR SYSTEM MARKET BY APPLICATION (THOUSAND UNITS) 2020-2029
TABLE 39 COLOMBIA SONAR SYSTEM MARKET BY PRODUCT TYPE (USD MILLIONS) 2020-2029
TABLE 40 COLOMBIA SONAR SYSTEM MARKET BY PRODUCT TYPE (THOUSAND UNITS) 2020-2029
TABLE 41 COLOMBIA SONAR SYSTEM MARKET BY END USER (USD MILLIONS) 2020-2029
TABLE 42 COLOMBIA SONAR SYSTEM MARKET BY END USER (THOUSAND UNITS) 2020-2029
TABLE 43 REST OF SOUTH AMERICA SONAR SYSTEM MARKET BY APPLICATION (USD MILLIONS) 2020-2029
TABLE 44 REST OF SOUTH AMERICA SONAR SYSTEM MARKET BY APPLICATION (THOUSAND UNITS) 2020-2029
TABLE 45 REST OF SOUTH AMERICA SONAR SYSTEM MARKET BY PRODUCT TYPE (USD MILLIONS) 2020-2029
TABLE 46 REST OF SOUTH AMERICA SONAR SYSTEM MARKET BY PRODUCT TYPE (THOUSAND UNITS) 2020-2029
TABLE 47 REST OF SOUTH AMERICA SONAR SYSTEM MARKET BY END USER (USD MILLIONS) 2020-2029
TABLE 48 REST OF SOUTH AMERICA SONAR SYSTEM MARKET BY END USER (THOUSAND UNITS) 2020-2029
TABLE 49 INDIA SONAR SYSTEM MARKET BY APPLICATION (USD MILLIONS) 2020-2029
TABLE 50 INDIA SONAR SYSTEM MARKET BY APPLICATION (THOUSAND UNITS) 2020-2029
TABLE 51 INDIA SONAR SYSTEM MARKET BY PRODUCT TYPE (USD MILLIONS) 2020-2029
TABLE 52 INDIA SONAR SYSTEM MARKET BY PRODUCT TYPE (THOUSAND UNITS) 2020-2029
TABLE 53 INDIA SONAR SYSTEM MARKET BY END USER (USD MILLIONS) 2020-2029
TABLE 54 INDIA SONAR SYSTEM MARKET BY END USER (THOUSAND UNITS) 2020-2029
TABLE 55 CHINA SONAR SYSTEM MARKET BY APPLICATION (USD MILLIONS) 2020-2029
TABLE 56 CHINA SONAR SYSTEM MARKET BY APPLICATION (THOUSAND UNITS) 2020-2029
TABLE 57 CHINA SONAR SYSTEM MARKET BY PRODUCT TYPE (USD MILLIONS) 2020-2029
TABLE 58 CHINA SONAR SYSTEM MARKET BY PRODUCT TYPE (THOUSAND UNITS) 2020-2029
TABLE 59 CHINA SONAR SYSTEM MARKET BY END USER (USD MILLIONS) 2020-2029
TABLE 60 CHINA SONAR SYSTEM MARKET BY END USER (THOUSAND UNITS) 2020-2029
TABLE 61 JAPAN SONAR SYSTEM MARKET BY APPLICATION (USD MILLIONS) 2020-2029
TABLE 62 JAPAN SONAR SYSTEM MARKET BY APPLICATION (THOUSAND UNITS) 2020-2029
TABLE 63 JAPAN SONAR SYSTEM MARKET BY PRODUCT TYPE (USD MILLIONS) 2020-2029
TABLE 64 JAPAN SONAR SYSTEM MARKET BY PRODUCT TYPE (THOUSAND UNITS) 2020-2029
TABLE 65 JAPAN SONAR SYSTEM MARKET BY END USER (USD MILLIONS) 2020-2029
TABLE 66 JAPAN SONAR SYSTEM MARKET BY END USER (THOUSAND UNITS) 2020-2029
TABLE 67 SOUTH KOREA SONAR SYSTEM MARKET BY APPLICATION (USD MILLIONS) 2020-2029
TABLE 68 SOUTH KOREA SONAR SYSTEM MARKET BY APPLICATION (THOUSAND UNITS) 2020-2029
TABLE 69 SOUTH KOREA SONAR SYSTEM MARKET BY PRODUCT TYPE (USD MILLIONS) 2020-2029
TABLE 70 SOUTH KOREA SONAR SYSTEM MARKET BY PRODUCT TYPE (THOUSAND UNITS) 2020-2029
TABLE 71 SOUTH KOREA SONAR SYSTEM MARKET BY END USER (USD MILLIONS) 2020-2029
TABLE 72 SOUTH KOREA SONAR SYSTEM MARKET BY END USER (THOUSAND UNITS) 2020-2029
TABLE 73 AUSTRALIA SONAR SYSTEM MARKET BY APPLICATION (USD MILLIONS) 2020-2029
TABLE 74 AUSTRALIA SONAR SYSTEM MARKET BY APPLICATION (THOUSAND UNITS) 2020-2029
TABLE 75 AUSTRALIA SONAR SYSTEM MARKET BY PRODUCT TYPE (USD MILLIONS) 2020-2029
TABLE 76 AUSTRALIA SONAR SYSTEM MARKET BY PRODUCT TYPE (THOUSAND UNITS) 2020-2029
TABLE 77 AUSTRALIA SONAR SYSTEM MARKET BY END USER (USD MILLIONS) 2020-2029
TABLE 78 AUSTRALIA SONAR SYSTEM MARKET BY END USER (THOUSAND UNITS) 2020-2029
TABLE 79 SOUTH-EAST ASIA SONAR SYSTEM MARKET BY APPLICATION (USD MILLIONS) 2020-2029
TABLE 80 SOUTH-EAST ASIA SONAR SYSTEM MARKET BY APPLICATION (THOUSAND UNITS) 2020-2029
TABLE 81 SOUTH-EAST ASIA SONAR SYSTEM MARKET BY PRODUCT TYPE (USD MILLIONS) 2020-2029
TABLE 82 SOUTH-EAST ASIA SONAR SYSTEM MARKET BY PRODUCT TYPE (THOUSAND UNITS) 2020-2029
TABLE 83 SOUTH-EAST ASIA SONAR SYSTEM MARKET BY END USER (USD MILLIONS) 2020-2029
TABLE 84 SOUTH-EAST ASIA SONAR SYSTEM MARKET BY END USER (THOUSAND UNITS) 2020-2029
TABLE 85 REST OF ASIA PACIFIC SONAR SYSTEM MARKET BY APPLICATION (USD MILLIONS) 2020-2029
TABLE 86 REST OF ASIA PACIFIC SONAR SYSTEM MARKET BY APPLICATION (THOUSAND UNITS) 2020-2029
TABLE 87 REST OF ASIA PACIFIC SONAR SYSTEM MARKET BY PRODUCT TYPE (USD MILLIONS) 2020-2029
TABLE 88 REST OF ASIA PACIFIC SONAR SYSTEM MARKET BY PRODUCT TYPE (THOUSAND UNITS) 2020-2029
TABLE 89 REST OF ASIA PACIFIC SONAR SYSTEM MARKET BY END USER (USD MILLIONS) 2020-2029
TABLE 90 REST OF ASIA PACIFIC SONAR SYSTEM MARKET BY END USER (THOUSAND UNITS) 2020-2029
TABLE 91 GERMANY SONAR SYSTEM MARKET BY APPLICATION (USD MILLIONS) 2020-2029
TABLE 92 GERMANY SONAR SYSTEM MARKET BY APPLICATION (THOUSAND UNITS) 2020-2029
TABLE 93 GERMANY SONAR SYSTEM MARKET BY PRODUCT TYPE (USD MILLIONS) 2020-2029
TABLE 94 GERMANY SONAR SYSTEM MARKET BY PRODUCT TYPE (THOUSAND UNITS) 2020-2029
TABLE 95 GERMANY SONAR SYSTEM MARKET BY END USER (USD MILLIONS) 2020-2029
TABLE 96 GERMANY SONAR SYSTEM MARKET BY END USER (THOUSAND UNITS) 2020-2029
TABLE 97 UK SONAR SYSTEM MARKET BY APPLICATION (USD MILLIONS) 2020-2029
TABLE 98 UK SONAR SYSTEM MARKET BY APPLICATION (THOUSAND UNITS) 2020-2029
TABLE 99 UK SONAR SYSTEM MARKET BY PRODUCT TYPE (USD MILLIONS) 2020-2029
TABLE 100 UK SONAR SYSTEM MARKET BY PRODUCT TYPE (THOUSAND UNITS) 2020-2029
TABLE 101 UK SONAR SYSTEM MARKET BY END USER (USD MILLIONS) 2020-2029
TABLE 102 UK SONAR SYSTEM MARKET BY END USER (THOUSAND UNITS) 2020-2029
TABLE 103 FRANCE SONAR SYSTEM MARKET BY APPLICATION (USD MILLIONS) 2020-2029
TABLE 104 FRANCE SONAR SYSTEM MARKET BY APPLICATION (THOUSAND UNITS) 2020-2029
TABLE 105 FRANCE SONAR SYSTEM MARKET BY PRODUCT TYPE (USD MILLIONS) 2020-2029
TABLE 106 FRANCE SONAR SYSTEM MARKET BY PRODUCT TYPE (THOUSAND UNITS) 2020-2029
TABLE 107 FRANCE SONAR SYSTEM MARKET BY END USER (USD MILLIONS) 2020-2029
TABLE 108 FRANCE SONAR SYSTEM MARKET BY END USER (THOUSAND UNITS) 2020-2029
TABLE 109 ITALY SONAR SYSTEM MARKET BY APPLICATION (USD MILLIONS) 2020-2029
TABLE 110 ITALY SONAR SYSTEM MARKET BY APPLICATION (THOUSAND UNITS) 2020-2029
TABLE 111 ITALY SONAR SYSTEM MARKET BY PRODUCT TYPE (USD MILLIONS) 2020-2029
TABLE 112 ITALY SONAR SYSTEM MARKET BY PRODUCT TYPE (THOUSAND UNITS) 2020-2029
TABLE 113 ITALY SONAR SYSTEM MARKET BY END USER (USD MILLIONS) 2020-2029
TABLE 114 ITALY SONAR SYSTEM MARKET BY END USER (THOUSAND UNITS) 2020-2029
TABLE 115 SPAIN SONAR SYSTEM MARKET BY APPLICATION (USD MILLIONS) 2020-2029
TABLE 116 SPAIN SONAR SYSTEM MARKET BY APPLICATION (THOUSAND UNITS) 2020-2029
TABLE 117 SPAIN SONAR SYSTEM MARKET BY PRODUCT TYPE (USD MILLIONS) 2020-2029
TABLE 118 SPAIN SONAR SYSTEM MARKET BY PRODUCT TYPE (THOUSAND UNITS) 2020-2029
TABLE 119 SPAIN SONAR SYSTEM MARKET BY END USER (USD MILLIONS) 2020-2029
TABLE 120 SPAIN SONAR SYSTEM MARKET BY END USER (THOUSAND UNITS) 2020-2029
TABLE 121 RUSSIA SONAR SYSTEM MARKET BY APPLICATION (USD MILLIONS) 2020-2029
TABLE 122 RUSSIA SONAR SYSTEM MARKET BY APPLICATION (THOUSAND UNITS) 2020-2029
TABLE 123 RUSSIA SONAR SYSTEM MARKET BY PRODUCT TYPE (USD MILLIONS) 2020-2029
TABLE 124 RUSSIA SONAR SYSTEM MARKET BY PRODUCT TYPE (THOUSAND UNITS) 2020-2029
TABLE 125 RUSSIA SONAR SYSTEM MARKET BY END USER (USD MILLIONS) 2020-2029
TABLE 126 RUSSIA SONAR SYSTEM MARKET BY END USER (THOUSAND UNITS) 2020-2029
TABLE 127 REST OF EUROPE SONAR SYSTEM MARKET BY APPLICATION (USD MILLIONS) 2020-2029
TABLE 128 REST OF EUROPE SONAR SYSTEM MARKET BY APPLICATION (THOUSAND UNITS) 2020-2029
TABLE 129 REST OF EUROPE SONAR SYSTEM MARKET BY PRODUCT TYPE (USD MILLIONS) 2020-2029
TABLE 130 REST OF EUROPE SONAR SYSTEM MARKET BY PRODUCT TYPE (THOUSAND UNITS) 2020-2029
TABLE 131 REST OF EUROPE SONAR SYSTEM MARKET BY END USER (USD MILLIONS) 2020-2029
TABLE 132 REST OF EUROPE SONAR SYSTEM MARKET BY END USER (THOUSAND UNITS) 2020-2029
TABLE 133 UAE SONAR SYSTEM MARKET BY APPLICATION (USD MILLIONS) 2020-2029
TABLE 134 UAE SONAR SYSTEM MARKET BY APPLICATION (THOUSAND UNITS) 2020-2029
TABLE 135 UAE SONAR SYSTEM MARKET BY PRODUCT TYPE (USD MILLIONS) 2020-2029
TABLE 136 UAE SONAR SYSTEM MARKET BY PRODUCT TYPE (THOUSAND UNITS) 2020-2029
TABLE 137 UAE SONAR SYSTEM MARKET BY END USER (USD MILLIONS) 2020-2029
TABLE 138 UAE SONAR SYSTEM MARKET BY END USER (THOUSAND UNITS) 2020-2029
TABLE 139 SAUDI ARABIA SONAR SYSTEM MARKET BY APPLICATION (USD MILLIONS) 2020-2029
TABLE 140 SAUDI ARABIA SONAR SYSTEM MARKET BY APPLICATION (THOUSAND UNITS) 2020-2029
TABLE 141 SAUDI ARABIA SONAR SYSTEM MARKET BY PRODUCT TYPE (USD MILLIONS) 2020-2029
TABLE 142 SAUDI ARABIA SONAR SYSTEM MARKET BY PRODUCT TYPE (THOUSAND UNITS) 2020-2029
TABLE 143 SAUDI ARABIA SONAR SYSTEM MARKET BY END USER (USD MILLIONS) 2020-2029
TABLE 144 SAUDI ARABIA SONAR SYSTEM MARKET BY END USER (THOUSAND UNITS) 2020-2029
TABLE 145 SOUTH AFRICA SONAR SYSTEM MARKET BY APPLICATION (USD MILLIONS) 2020-2029
TABLE 146 SOUTH AFRICA SONAR SYSTEM MARKET BY APPLICATION (THOUSAND UNITS) 2020-2029
TABLE 147 SOUTH AFRICA SONAR SYSTEM MARKET BY PRODUCT TYPE (USD MILLIONS) 2020-2029
TABLE 148 SOUTH AFRICA SONAR SYSTEM MARKET BY PRODUCT TYPE (THOUSAND UNITS) 2020-2029
TABLE 149 SOUTH AFRICA SONAR SYSTEM MARKET BY END USER (USD MILLIONS) 2020-2029
TABLE 150 SOUTH AFRICA SONAR SYSTEM MARKET BY END USER (THOUSAND UNITS) 2020-2029
TABLE 151 REST OF MIDDLE EAST AND AFRICA SONAR SYSTEM MARKET BY APPLICATION (USD MILLIONS) 2020-2029
TABLE 152 REST OF MIDDLE EAST AND AFRICA SONAR SYSTEM MARKET BY APPLICATION (THOUSAND UNITS) 2020-2029
TABLE 153 REST OF MIDDLE EAST AND AFRICA SONAR SYSTEM MARKET BY PRODUCT TYPE (USD MILLIONS) 2020-2029
TABLE 154 REST OF MIDDLE EAST AND AFRICA SONAR SYSTEM MARKET BY PRODUCT TYPE (THOUSAND UNITS) 2020-2029
TABLE 155 REST OF MIDDLE EAST AND AFRICA SONAR SYSTEM MARKET BY END USER (USD MILLIONS) 2020-2029
TABLE 156 REST OF MIDDLE EAST AND AFRICA SONAR SYSTEM MARKET BY END USER (THOUSAND UNITS) 2020-2029
LIST OF FIGURES
FIGURE 1 MARKET DYNAMICS
FIGURE 2 MARKET SEGMENTATION
FIGURE 3 REPORT TIMELINES: YEARS CONSIDERED
FIGURE 4 DATA TRIANGULATION
FIGURE 5 BOTTOM-UP APPROACH
FIGURE 6 TOP-DOWN APPROACH
FIGURE 7 RESEARCH FLOW
FIGURE 8 GLOBAL SONAR SYSTEM MARKET BY PRODUCT TYPE, USD MILLION, 2020-2029
FIGURE 9 GLOBAL SONAR SYSTEM MARKET BY APPLICATION, USD MILLION, 2020-2029
FIGURE 10 GLOBAL SONAR SYSTEM MARKET BY END USER, USD MILLION, 2020-2029
FIGURE 11 GLOBAL SONAR SYSTEM MARKET BY REGION, USD MILLION, 2020-2029
FIGURE 12 PORTER’S FIVE FORCES MODEL
FIGURE 13 MARKET SHARE ANALYSIS
FIGURE 14 THALES GROUP: COMPANY SNAPSHOT
FIGURE 15 ATLAS ELECTRONIK GMBH: COMPANY SNAPSHOT
FIGURE 16 RAYTHEON COMPANY: COMPANY SNAPSHOT
FIGURE 17 LOCKHEED MARTIN: COMPANY SNAPSHOT
FIGURE 18 L-3 TECHNOLOGIES INC.: COMPANY SNAPSHOT
FIGURE 19 ULTRA ELECTRONICS: COMPANY SNAPSHOT
FIGURE 20 KONGSBERG GRUPPEN ASA: COMPANY SNAPSHOT
FIGURE 21 TELEDYNE TECHNOLOGIES INC.: COMPANY SNAPSHOT
FIGURE 22 SONARDYNE: COMPANY SNAPSHOT
FIGURE 23 FURUNO ELECTRIC CO. LTD.: COMPANY SNAPSHOT
FIGURE 24 JAPAN RADIO COMPANY: COMPANY SNAPSHOT
FIGURE 25 NAVICO: COMPANY SNAPSHOT
FIGURE 26 FLIR SYSTEMS: COMPANY SNAPSHOT
DOWNLOAD FREE SAMPLE REPORT
License Type
SPEAK WITH OUR ANALYST
Want to know more about the report or any specific requirement?
WANT TO CUSTOMIZE THE REPORT?
Our Clients Speak
We asked them to research ‘ Equipment market’ all over the world, and their whole arrangement was helpful to us. thehealthanalytics.com insightful analysis and reports contributed to our current analysis and in creating a future strategy. Besides, the te
Yosuke Mitsui
Senior Associate Construction Equipment Sales & Marketing
We asked them to research ‘Equipment market’ all over the world, and their whole arrangement was helpful to us. thehealthanalytics.com insightful analysis and reports contributed to our current analysis and in creating a future strategy. Besides, the te


