

Base Year Value ()
x.x %
x.x %
CAGR ()
x.x %
x.x %
Forecast Year Value ()
x.x %
x.x %
Historical Data Period
Largest Region
Forecast Period
제품별 농업 섬유 시장(그늘막, 멀치막, 우박방지막, 조류보호막, 어망) 섬유 소재(나일론, 폴리에틸렌, 폴리프로필렌, 폴리에스터, 천연섬유, 생분해성 합성섬유) 응용 분야(농업, 원예 및 화훼, 양식업) 및 지역별(북미, 유럽, 아시아 태평양, 남미, 중동 및 아프리카) 2022년부터 2029년까지의 글로벌 트렌드 및 예측
Instant access to hundreds of data points and trends
- Market estimates from 2014-2029
- Competitive analysis, industry segmentation, financial benchmarks
- Incorporates SWOT, Porter's Five Forces and risk management frameworks
- PDF report or online database with Word, Excel and PowerPoint export options
- 100% money back guarantee
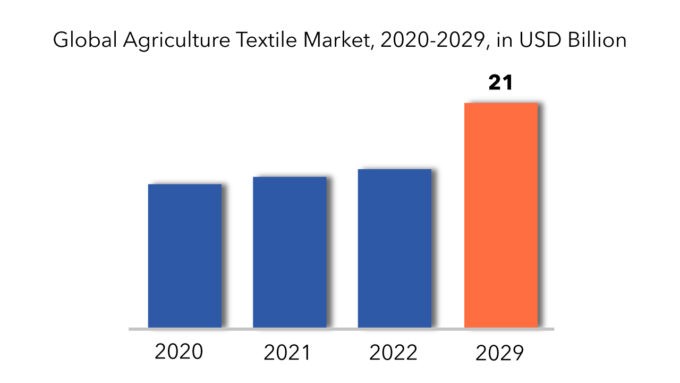
농업 섬유 시장 개요
글로벌 농업용 섬유 시장은 2020년 10억 달러에서 2029년 209억 9천만 달러로 성장할 것으로 예상되며, 2022년에서 2029년까지 연평균 성장률은 5.1%입니다.
농업 분야에서 사용되는 섬유 소재인 농업용 섬유는 세계 인구가 증가함에 따라 작물에 상당한 스트레스를 주기 때문에 점점 더 의존도가 높아지고 있습니다. 이로 인해 주로 가격 대비 성능, 운송 및 보관의 용이성, 내구성이 뛰어나 천연 섬유보다 인조 섬유 제품을 선호하게 되었습니다.
온실 적용을 위한 모세관 매트 , 그물 제품, 그늘 천 직물, 작물 덮개, 수확 직물, 수확 그물, 조경 직물 및 작물 보호 재료를 포함하여 다양한 유형의 농업용 섬유 제품이 활용됩니다. 이러한 섬유는 작물에 규제된 환경을 제공하고, 악천후 및 빈번한 기후 변화로부터 보호하며, 식물 성장 조건을 최적화하는 데 중요한 역할을 합니다. 이러한 섬유의 주목할 만한 특성에는 높은 인장 강도, 태양 복사로부터 보호, 생분해성, 내마모성, 보수 능력 및 미생물에 대한 내성이 있습니다.
[캡션 id="attachment_5680" 정렬="정렬센터" 너비="870"]
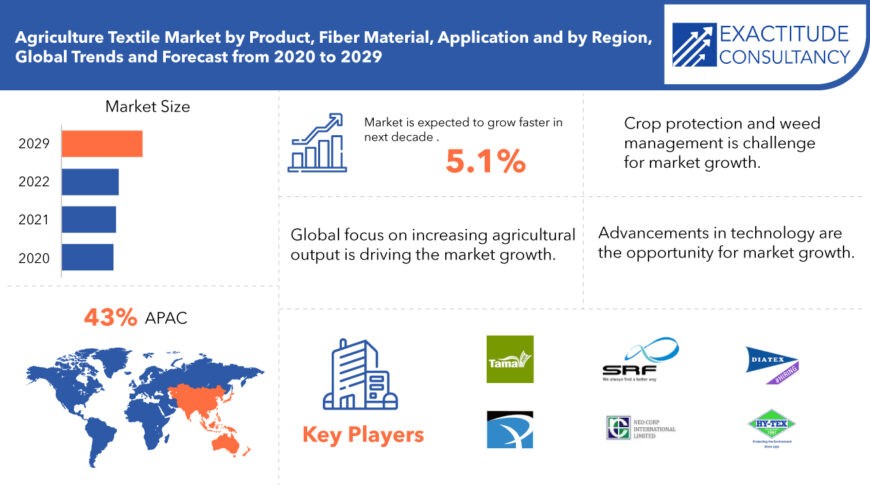
정원과 조경 관개에도 사용되는 첨단 소재, 온실 기술, 작물 덮개 산업의 혁신이 급증하면서 농업용 섬유 산업의 성장이 촉진될 것으로 예상됩니다. 효율적인 식물 관수를 위해 설계된 미세 기공이 있는 수화 튜브, 효과적인 날씨, 햇빛, 우박 보호를 위해 첨가제와 안료로 처리한 폴리프로필렌 그늘 그물과 같은 혁신이 두드러지고 있습니다. 이러한 직물에 적용된 첨단 뜨개질 기술은 식물 요구 사항에 따라 맞춤형 그늘 수준을 허용합니다. 또한 첨단 그물은 수확 시간을 단축하고, 관리 용이성을 향상시키고, 유지 관리 비용을 줄이고, 관개 비용을 낮추는 데 사용됩니다. 작물 수확량을 늘리기 위해 농부와 생산자 모두가 이러한 기술을 채택하는 것은 농업용 섬유 시장 확장을 위한 중요한 원동력이 됩니다.
[캡션 id="attachment_5682" 정렬="정렬센터" 너비="680"]
Agriculture Textile Market Segment Analysis
The agriculture textile market is divided into three categories based on product: shade nets, mulch nets, anti-hail nets bird protection nets, fishing nets. Fishing net dominate the agriculture textile market due to the increased need for fish and other seafood around the world, these nets are in high demand. Furthermore, developing countries such as India, Indonesia, and others are heavily reliant on the fishing industry and related sectors. Furthermore, the widespread usage of fish and its by-products in a variety of industries, including skin-care and medical items, is expected to boost segment growth. Because these nets are utilized for shading and fencing, the shade-nets category is expected to grow at a considerable CAGR of 4.8 percent. Shade-nets are widely used for safety and protection; therefore, a growing number of building and construction activities contributes considerably to the need for them. Mulch-mats, anti-hail nets, and bird protection nets are among the other items available.
The market is divided into nylon, polyethylene, polypropylene, polyester, natural fiber, biodegradable synthetic fibers based on fiber material. Polyethylene fiber material segment dominate the agriculture textile market. Polyethylene is a thermoplastic polymer with a variable crystalline structure that has a wide range of applications depending on the kind. It is one of the most widely used polymers on the planet, with tens of millions of tons produced each year. PE is one of the most extensively used agrotextile materials, however it is slightly more expensive than polypropylene. Polyethylene is a form of non-woven agrotextile that can be used both indoors and out. PE is frequently used to make row coverings and monofilament meshes.
The market is divided into agriculture, horticulture and floriculture, aquaculture based on application. Aquaculture is dominating the application segment of the agriculture textile market. Due to the widespread usage of fish and its by-products in nutritional supplements, oils, and skincare and beauty items, aquafarming activities have increased. Furthermore, aquafarming has grown greatly in recent decades as a result of its commercialization. Technological developments and supportive government regulations, such as NOAA's and the US Department of Commerce's national aquaculture policies, have aided the segment's expansion.
Agriculture Textile Market Players
The major players operating in the global agriculture textile industry include Beaulieu Technical Textiles, Belton Industries, Inc., Meyabond Industry & Trading (Beijing) Co. Ltd., Capatex Ltd., Neo Corp International Ltd., Diatex, Hy-Tex (U.K.) Ltd., Zhongshan Hongjun Nonwovens Co. Ltd., SRF Ltd., Tama Plastic Industry, Hebei Aining Import and Export Co. Ltd.,. The presence of established industry players and is characterized by mergers and acquisitions, joint ventures, capacity expansions, substantial distribution, and branding decisions to improve market share and regional presence. Also, they are involved in continuous R&D activities to develop new products as well as are focused on expanding the product portfolio. This is expected to intensify competition and pose a potential threat to the new players entering the market.
Who Should Buy? Or Key Stakeholders
- Research and development
- Manufacturing
- End Use industries
- Agriculture sector
- Horticulture and Floriculture sector
- Aquaculture sector
- Other
Key Takeaways:
- The global agriculture textile market is to grow at a CAGR of 5.1%
- Based on product, fishing net dominate the agriculture textile market.
- Based on fiber material, polyethylene fiber material segment dominates the agriculture textile market.
- Based on application, aquaculture is dominating the application segment of the agriculture textile market.
- Asia Pacific is expected to hold the largest share of the global agriculture textile market.
- The major trend in the Agriculture Textile Market is the increasing adoption of innovative textile solutions for crop protection, soil conservation, and agricultural productivity enhancement.
Agriculture Textile Market Regional Analysis
Geographically, the agriculture textile market is segmented into North America, South America, Europe, APAC and MEA.
- North America: includes the US, Canada, Mexico
- Europe: includes UK, Germany, France, Italy, Spain, Russia, and Rest of Europe
- Asia Pacific: includes China, Japan, South Korea, India, Australia, ASEAN and Rest of APAC
- South America: includes Brazil, Argentina and Rest of South America
- Middle East & Africa: includes Turkey, UAE, Saudi Arabia, South Africa, and Rest of MEA
Asia Pacific is expected to hold the largest share of the global agriculture textile market. Owing to China's and India's heavy reliance on agriculture and related industries Furthermore, the market in the region will be driven by increased food demand as a result of the region's growing population. North America's market is predicted to develop at a significant rate over the forecast period, owing to an increase in product demand for high-quality agro products. Over the projection period, a bright outlook for agriculture and aquaculture is expected to boost the regional market. Growing awareness of the importance of a balanced diet in Europe is predicted to increase demand for dietary supplements, resulting in increased fish consumption. This will increase product demand and, as a result, regional market growth. Over the projected period, the Middle East and Africa, as well as Central and South America, are expected to see significant CAGR.
[caption id="attachment_5684" align="alignleft" width="680"]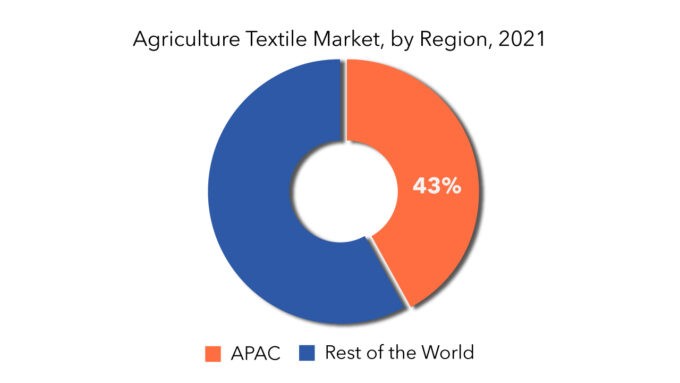
Key Market Segments: Agriculture Textile Market
Agriculture Textile Market by Product, 2020-2029, (USD Million) (Kilotons)- Shade Nets
- Mulch Nets
- Anti-Hail Nets Bird Protection Nets
- Fishing Nets
- Nylon, Polyethylene
- Polypropylene
- Polyester
- Natural Fiber
- Biodegradable Synthetic Fibers
- Agriculture
- Horticulture And Floriculture
- Aquaculture
- North America
- Europe
- Asia Pacific
- South America
- Middle East And Africa
Key Question Answered
- What is the current scenario of the global agriculture textile market?
- What are the emerging technologies for the development of agriculture textile devices?
- What are the historical size and the present size of the market segments and their future potential?
- What are the major catalysts for the market and their impact during the short, medium, and long terms?
- What are the evolving opportunities for the players in the market?
- Which are the key regions from the investment perspective?
- What are the key strategies being adopted by the major players to up their market shares?
- 소개
- 시장 정의
- 시장 세분화
- 연구 타임라인
- 가정 및 제한 사항
- 연구 방법론
- 데이터 마이닝
- 2차 연구
- 1차 연구
- 주제별 전문가의 조언
- 품질 검사
- 최종 검토
- 데이터 삼각 측량
- 하향식 접근 방식
- 탑다운 접근 방식
- 연구 흐름
- 데이터 소스
- 데이터 마이닝
- 요약
- 시장 개요
- 글로벌 농업 섬유 시장 전망
- 시장 동인
- 시장 제약
- 시장 기회
- 코로나19가 농업 섬유 시장에 미치는 영향
- 포터의 5가지 힘 모델
- 신규 진입업체의 위협
- 대체품의 위협
- 공급업체의 협상력
- 고객의 협상력
- 경쟁의 정도
- 산업 가치 사슬 분석
- 글로벌 농업 섬유 시장 전망
- 제품별 글로벌 농업 섬유 시장(백만 달러)(킬로톤)
- 그늘 그물
- 멀치 그물
- 우박 방지 그물
- 조류 보호망
- 어망
- 섬유 소재별 글로벌 농업 섬유 시장(백만 달러) (킬로톤)
- 나일론, 폴리에틸렌
- 폴리프로필렌
- 폴리에스터
- 천연섬유
- 생분해성 합성섬유
- 응용 분야별 글로벌 농업 섬유 시장(백만 달러)(킬로톤)
- 농업
- 원예 및 화훼 재배
- 양식업
- 지역별 글로벌 농업 섬유 시장
- 북아메리카
- 우리를
- 캐나다
- 멕시코
- 남아메리카
- 브라질
- 아르헨티나
- 콜롬비아
- 남미의 나머지 지역
- 유럽
- 독일
- 영국
- 프랑스
- 이탈리아
- 스페인
- 러시아 제국
- 유럽의 나머지 지역
- 아시아 태평양
- 인도
- 중국
- 일본
- 대한민국
- 호주
- 동남아시아
- 아시아 태평양의 나머지 지역
- 중동 및 아프리카
- 아랍에미리트
- 사우디 아라비아
- 남아프리카 공화국
- 중동 및 아프리카의 나머지 지역
- 북아메리카
- 회사 프로필* (사업 개요, 회사 스냅샷, 제공되는 제품, 최근 개발 사항)
- 뷰리유 테크니컬 텍스타일
- 벨튼 인더스트리 주식회사
- 메이본드 산업 및 무역(베이징) 유한회사
- 캐파텍스 유한회사
- 네오코프 인터내셔널 유한회사
- Diatex, Hy-Tex(UK) Ltd
- 중산홍준부직포유한회사
- SRF 유한회사
- 타마 플라스틱 산업
- 타마 플라스틱 산업
*회사 목록은 표시용입니다.
표 목록
TABLE 1 GLOBAL AGRICULTURE TEXTILE MARKET BY PRODUCT (USD MILLIONS) 2020-2029
TABLE 2 GLOBAL AGRICULTURE TEXTILE MARKET BY PRODUCT (KILOTONS) 2020-2029
TABLE 3 GLOBAL AGRICULTURE TEXTILE MARKET BY FIBER MATERIAL (USD MILLIONS) 2020-2029
TABLE 4 GLOBAL AGRICULTURE TEXTILE MARKET BY FIBER MATERIAL (KILOTONS) 2020-2029
TABLE 5 GLOBAL AGRICULTURE TEXTILE MARKET BY APPLICATIPON (USD MILLIONS) 2020-2029
TABLE 6 GLOBAL AGRICULTURE TEXTILE MARKET BY APPLICATIPON (KILOTONS) 2020-2029
TABLE 7 GLOBAL AGRICULTURE TEXTILE MARKET BY REGION (USD MILLIONS) 2020-2029
TABLE 8 GLOBAL AGRICULTURE TEXTILE MARKET BY REGION (KILOTONS) 2020-2029
TABLE 9 US AGRICULTURE TEXTILE MARKET BY PRODUCT (USD MILLIONS) 2020-2029
TABLE 10 US AGRICULTURE TEXTILE MARKET BY PRODUCT (KILOTONS) 2020-2029
TABLE 11 US AGRICULTURE TEXTILE MARKET BY FIBER MATERIAL (USD MILLIONS) 2020-2029
TABLE 12 US AGRICULTURE TEXTILE MARKET BY FIBER MATERIAL (KILOTONS) 2020-2029
TABLE 13 US AGRICULTURE TEXTILE MARKET BY APPLICATIPON (USD MILLIONS) 2020-2029
TABLE 14 US AGRICULTURE TEXTILE MARKET BY APPLICATIPON (KILOTONS) 2020-2029
TABLE 15 CANADA AGRICULTURE TEXTILE MARKET BY PRODUCT (USD MILLIONS) 2020-2029
TABLE 16 CANADA AGRICULTURE TEXTILE MARKET BY PRODUCT (KILOTONS) 2020-2029
TABLE 17 CANADA AGRICULTURE TEXTILE MARKET BY FIBER MATERIAL (USD MILLIONS) 2020-2029
TABLE 18 CANADA AGRICULTURE TEXTILE MARKET BY FIBER MATERIAL (KILOTONS) 2020-2029
TABLE 19 CANADA AGRICULTURE TEXTILE MARKET BY APPLICATIPON (USD MILLIONS) 2020-2029
TABLE 20 CANADA AGRICULTURE TEXTILE MARKET BY APPLICATIPON (KILOTONS) 2020-2029
TABLE 21 MEXICO AGRICULTURE TEXTILE MARKET BY PRODUCT (USD MILLIONS) 2020-2029
TABLE 22 MEXICO AGRICULTURE TEXTILE MARKET BY PRODUCT (KILOTONS) 2020-2029
TABLE 23 MEXICO AGRICULTURE TEXTILE MARKET BY FIBER MATERIAL (USD MILLIONS) 2020-2029
TABLE 24 MEXICO AGRICULTURE TEXTILE MARKET BY FIBER MATERIAL (KILOTONS) 2020-2029
TABLE 25 MEXICO AGRICULTURE TEXTILE MARKET BY APPLICATIPON (USD MILLIONS) 2020-2029
TABLE 26 MEXICO AGRICULTURE TEXTILE MARKET BY APPLICATIPON (KILOTONS) 2020-2029
TABLE 27 BRAZIL AGRICULTURE TEXTILE MARKET BY PRODUCT (USD MILLIONS) 2020-2029
TABLE 28 BRAZIL AGRICULTURE TEXTILE MARKET BY PRODUCT (KILOTONS) 2020-2029
TABLE 29 BRAZIL AGRICULTURE TEXTILE MARKET BY FIBER MATERIAL (USD MILLIONS) 2020-2029
TABLE 30 BRAZIL AGRICULTURE TEXTILE MARKET BY FIBER MATERIAL (KILOTONS) 2020-2029
TABLE 31 BRAZIL AGRICULTURE TEXTILE MARKET BY APPLICATIPON (USD MILLIONS) 2020-2029
TABLE 32 BRAZIL AGRICULTURE TEXTILE MARKET BY APPLICATIPON (KILOTONS) 2020-2029
TABLE 33 ARGENTINA AGRICULTURE TEXTILE MARKET BY PRODUCT (USD MILLIONS) 2020-2029
TABLE 34 ARGENTINA AGRICULTURE TEXTILE MARKET BY PRODUCT (KILOTONS) 2020-2029
TABLE 35 ARGENTINA AGRICULTURE TEXTILE MARKET BY FIBER MATERIAL (USD MILLIONS) 2020-2029
TABLE 36 ARGENTINA AGRICULTURE TEXTILE MARKET BY FIBER MATERIAL (KILOTONS) 2020-2029
TABLE 37 ARGENTINA AGRICULTURE TEXTILE MARKET BY APPLICATIPON (USD MILLIONS) 2020-2029
TABLE 38 ARGENTINA AGRICULTURE TEXTILE MARKET BY APPLICATIPON (KILOTONS) 2020-2029
TABLE 39 COLOMBIA AGRICULTURE TEXTILE MARKET BY PRODUCT (USD MILLIONS) 2020-2029
TABLE 40 COLOMBIA AGRICULTURE TEXTILE MARKET BY PRODUCT (KILOTONS) 2020-2029
TABLE 41 COLOMBIA AGRICULTURE TEXTILE MARKET BY FIBER MATERIAL (USD MILLIONS) 2020-2029
TABLE 42 COLOMBIA AGRICULTURE TEXTILE MARKET BY FIBER MATERIAL (KILOTONS) 2020-2029
TABLE 43 COLOMBIA AGRICULTURE TEXTILE MARKET BY APPLICATIPON (USD MILLIONS) 2020-2029
TABLE 44 COLOMBIA AGRICULTURE TEXTILE MARKET BY APPLICATIPON (KILOTONS) 2020-2029
TABLE 45 REST OF SOUTH AMERICA AGRICULTURE TEXTILE MARKET BY PRODUCT (USD MILLIONS) 2020-2029
TABLE 46 REST OF SOUTH AMERICA AGRICULTURE TEXTILE MARKET BY PRODUCT (KILOTONS) 2020-2029
TABLE 47 REST OF SOUTH AMERICA AGRICULTURE TEXTILE MARKET BY FIBER MATERIAL (USD MILLIONS) 2020-2029
TABLE 48 REST OF SOUTH AMERICA AGRICULTURE TEXTILE MARKET BY FIBER MATERIAL (KILOTONS) 2020-2029
TABLE 49 REST OF SOUTH AMERICA AGRICULTURE TEXTILE MARKET BY APPLICATIPON (USD MILLIONS) 2020-2029
TABLE 50 REST OF SOUTH AMERICA AGRICULTURE TEXTILE MARKET BY APPLICATIPON (KILOTONS) 2020-2029
TABLE 51 INDIA AGRICULTURE TEXTILE MARKET BY PRODUCT (USD MILLIONS) 2020-2029
TABLE 52 INDIA AGRICULTURE TEXTILE MARKET BY PRODUCT (KILOTONS) 2020-2029
TABLE 53 INDIA AGRICULTURE TEXTILE MARKET BY FIBER MATERIAL (USD MILLIONS) 2020-2029
TABLE 54 INDIA AGRICULTURE TEXTILE MARKET BY FIBER MATERIAL (KILOTONS) 2020-2029
TABLE 55 INDIA AGRICULTURE TEXTILE MARKET BY APPLICATIPON (USD MILLIONS) 2020-2029
TABLE 56 INDIA AGRICULTURE TEXTILE MARKET BY APPLICATIPON (KILOTONS) 2020-2029
TABLE 57 CHINA AGRICULTURE TEXTILE MARKET BY PRODUCT (USD MILLIONS) 2020-2029
TABLE 58 CHINA AGRICULTURE TEXTILE MARKET BY PRODUCT (KILOTONS) 2020-2029
TABLE 59 CHINA AGRICULTURE TEXTILE MARKET BY FIBER MATERIAL (USD MILLIONS) 2020-2029
TABLE 60 CHINA AGRICULTURE TEXTILE MARKET BY FIBER MATERIAL (KILOTONS) 2020-2029
TABLE 61 CHINA AGRICULTURE TEXTILE MARKET BY APPLICATIPON (USD MILLIONS) 2020-2029
TABLE 62 CHINA AGRICULTURE TEXTILE MARKET BY APPLICATIPON (KILOTONS) 2020-2029
TABLE 63 JAPAN AGRICULTURE TEXTILE MARKET BY PRODUCT (USD MILLIONS) 2020-2029
TABLE 64 JAPAN AGRICULTURE TEXTILE MARKET BY PRODUCT (KILOTONS) 2020-2029
TABLE 65 JAPAN AGRICULTURE TEXTILE MARKET BY FIBER MATERIAL (USD MILLIONS) 2020-2029
TABLE 66 JAPAN AGRICULTURE TEXTILE MARKET BY FIBER MATERIAL (KILOTONS) 2020-2029
TABLE 67 JAPAN AGRICULTURE TEXTILE MARKET BY APPLICATIPON (USD MILLIONS) 2020-2029
TABLE 68 JAPAN AGRICULTURE TEXTILE MARKET BY APPLICATIPON (KILOTONS) 2020-2029
TABLE 69 SOUTH KOREA AGRICULTURE TEXTILE MARKET BY PRODUCT (USD MILLIONS) 2020-2029
TABLE 70 SOUTH KOREA AGRICULTURE TEXTILE MARKET BY PRODUCT (KILOTONS) 2020-2029
TABLE 71 SOUTH KOREA AGRICULTURE TEXTILE MARKET BY FIBER MATERIAL (USD MILLIONS) 2020-2029
TABLE 72 SOUTH KOREA AGRICULTURE TEXTILE MARKET BY FIBER MATERIAL (KILOTONS) 2020-2029
TABLE 73 SOUTH KOREA AGRICULTURE TEXTILE MARKET BY APPLICATIPON (USD MILLIONS) 2020-2029
TABLE 74 SOUTH KOREA AGRICULTURE TEXTILE MARKET BY APPLICATIPON (KILOTONS) 2020-2029
TABLE 75 AUSTRALIA AGRICULTURE TEXTILE MARKET BY PRODUCT (USD MILLIONS) 2020-2029
TABLE 76 AUSTRALIA AGRICULTURE TEXTILE MARKET BY PRODUCT (KILOTONS) 2020-2029
TABLE 77 AUSTRALIA AGRICULTURE TEXTILE MARKET BY FIBER MATERIAL (USD MILLIONS) 2020-2029
TABLE 78 AUSTRALIA AGRICULTURE TEXTILE MARKET BY FIBER MATERIAL (KILOTONS) 2020-2029
TABLE 79 AUSTRALIA AGRICULTURE TEXTILE MARKET BY APPLICATIPON (USD MILLIONS) 2020-2029
TABLE 80 AUSTRALIA AGRICULTURE TEXTILE MARKET BY APPLICATIPON (KILOTONS) 2020-2029
TABLE 81 SOUTH-EAST ASIA AGRICULTURE TEXTILE MARKET BY PRODUCT (USD MILLIONS) 2020-2029
TABLE 82 SOUTH-EAST ASIA AGRICULTURE TEXTILE MARKET BY PRODUCT (KILOTONS) 2020-2029
TABLE 83 SOUTH-EAST ASIA AGRICULTURE TEXTILE MARKET BY FIBER MATERIAL (USD MILLIONS) 2020-2029
TABLE 84 SOUTH-EAST ASIA AGRICULTURE TEXTILE MARKET BY FIBER MATERIAL (KILOTONS) 2020-2029
TABLE 85 SOUTH-EAST ASIA AGRICULTURE TEXTILE MARKET BY APPLICATIPON (USD MILLIONS) 2020-2029
TABLE 86 SOUTH-EAST ASIA AGRICULTURE TEXTILE MARKET BY APPLICATIPON (KILOTONS) 2020-2029
TABLE 87 REST OF ASIA PACIFIC AGRICULTURE TEXTILE MARKET BY PRODUCT (USD MILLIONS) 2020-2029
TABLE 88 REST OF ASIA PACIFIC AGRICULTURE TEXTILE MARKET BY PRODUCT (KILOTONS) 2020-2029
TABLE 89 REST OF ASIA PACIFIC AGRICULTURE TEXTILE MARKET BY FIBER MATERIAL (USD MILLIONS) 2020-2029
TABLE 90 REST OF ASIA PACIFIC AGRICULTURE TEXTILE MARKET BY FIBER MATERIAL (KILOTONS) 2020-2029
TABLE 91 REST OF ASIA PACIFIC AGRICULTURE TEXTILE MARKET BY APPLICATIPON (USD MILLIONS) 2020-2029
TABLE 92 REST OF ASIA PACIFIC AGRICULTURE TEXTILE MARKET BY APPLICATIPON (KILOTONS) 2020-2029
TABLE 93 GERMANY AGRICULTURE TEXTILE MARKET BY PRODUCT (USD MILLIONS) 2020-2029
TABLE 94 GERMANY AGRICULTURE TEXTILE MARKET BY PRODUCT (KILOTONS) 2020-2029
TABLE 95 GERMANY AGRICULTURE TEXTILE MARKET BY FIBER MATERIAL (USD MILLIONS) 2020-2029
TABLE 96 GERMANY AGRICULTURE TEXTILE MARKET BY FIBER MATERIAL (KILOTONS) 2020-2029
TABLE 97 GERMANY AGRICULTURE TEXTILE MARKET BY APPLICATIPON (USD MILLIONS) 2020-2029
TABLE 98 GERMANY AGRICULTURE TEXTILE MARKET BY APPLICATIPON (KILOTONS) 2020-2029
TABLE 99 UK AGRICULTURE TEXTILE MARKET BY PRODUCT (USD MILLIONS) 2020-2029
TABLE 100 UK AGRICULTURE TEXTILE MARKET BY PRODUCT (KILOTONS) 2020-2029
TABLE 101 UK AGRICULTURE TEXTILE MARKET BY FIBER MATERIAL (USD MILLIONS) 2020-2029
TABLE 102 UK AGRICULTURE TEXTILE MARKET BY FIBER MATERIAL (KILOTONS) 2020-2029
TABLE 103 UK AGRICULTURE TEXTILE MARKET BY APPLICATIPON (USD MILLIONS) 2020-2029
TABLE 104 UK AGRICULTURE TEXTILE MARKET BY APPLICATIPON (KILOTONS) 2020-2029
TABLE 105 FRANCE AGRICULTURE TEXTILE MARKET BY PRODUCT (USD MILLIONS) 2020-2029
TABLE 106 FRANCE AGRICULTURE TEXTILE MARKET BY PRODUCT (KILOTONS) 2020-2029
TABLE 107 FRANCE AGRICULTURE TEXTILE MARKET BY FIBER MATERIAL (USD MILLIONS) 2020-2029
TABLE 108 FRANCE AGRICULTURE TEXTILE MARKET BY FIBER MATERIAL (KILOTONS) 2020-2029
TABLE 109 FRANCE AGRICULTURE TEXTILE MARKET BY APPLICATIPON (USD MILLIONS) 2020-2029
TABLE 110 FRANCE AGRICULTURE TEXTILE MARKET BY APPLICATIPON (KILOTONS) 2020-2029
TABLE 111 ITALY AGRICULTURE TEXTILE MARKET BY PRODUCT (USD MILLIONS) 2020-2029
TABLE 112 ITALY AGRICULTURE TEXTILE MARKET BY PRODUCT (KILOTONS) 2020-2029
TABLE 113 ITALY AGRICULTURE TEXTILE MARKET BY FIBER MATERIAL (USD MILLIONS) 2020-2029
TABLE 114 ITALY AGRICULTURE TEXTILE MARKET BY FIBER MATERIAL (KILOTONS) 2020-2029
TABLE 115 ITALY AGRICULTURE TEXTILE MARKET BY APPLICATIPON (USD MILLIONS) 2020-2029
TABLE 116 ITALY AGRICULTURE TEXTILE MARKET BY APPLICATIPON (KILOTONS) 2020-2029
TABLE 117 SPAIN AGRICULTURE TEXTILE MARKET BY PRODUCT (USD MILLIONS) 2020-2029
TABLE 118 SPAIN AGRICULTURE TEXTILE MARKET BY PRODUCT (KILOTONS) 2020-2029
TABLE 119 SPAIN AGRICULTURE TEXTILE MARKET BY FIBER MATERIAL (USD MILLIONS) 2020-2029
TABLE 120 SPAIN AGRICULTURE TEXTILE MARKET BY FIBER MATERIAL (KILOTONS) 2020-2029
TABLE 121 SPAIN AGRICULTURE TEXTILE MARKET BY APPLICATIPON (USD MILLIONS) 2020-2029
TABLE 122 SPAIN AGRICULTURE TEXTILE MARKET BY APPLICATIPON (KILOTONS) 2020-2029
TABLE 123 RUSSIA AGRICULTURE TEXTILE MARKET BY PRODUCT (USD MILLIONS) 2020-2029
TABLE 124 RUSSIA AGRICULTURE TEXTILE MARKET BY PRODUCT (KILOTONS) 2020-2029
TABLE 125 RUSSIA AGRICULTURE TEXTILE MARKET BY FIBER MATERIAL (USD MILLIONS) 2020-2029
TABLE 126 RUSSIA AGRICULTURE TEXTILE MARKET BY FIBER MATERIAL (KILOTONS) 2020-2029
TABLE 127 RUSSIA AGRICULTURE TEXTILE MARKET BY APPLICATIPON (USD MILLIONS) 2020-2029
TABLE 128 RUSSIA AGRICULTURE TEXTILE MARKET BY APPLICATIPON (KILOTONS) 2020-2029
TABLE 129 REST OF EUROPE AGRICULTURE TEXTILE MARKET BY PRODUCT (USD MILLIONS) 2020-2029
TABLE 130 REST OF EUROPE AGRICULTURE TEXTILE MARKET BY PRODUCT (KILOTONS) 2020-2029
TABLE 131 REST OF EUROPE AGRICULTURE TEXTILE MARKET BY FIBER MATERIAL (USD MILLIONS) 2020-2029
TABLE 132 REST OF EUROPE AGRICULTURE TEXTILE MARKET BY FIBER MATERIAL (KILOTONS) 2020-2029
TABLE 133 REST OF EUROPE AGRICULTURE TEXTILE MARKET BY APPLICATIPON (USD MILLIONS) 2020-2029
TABLE 134 REST OF EUROPE AGRICULTURE TEXTILE MARKET BY APPLICATIPON (KILOTONS) 2020-2029
TABLE 135 UAE AGRICULTURE TEXTILE MARKET BY PRODUCT (USD MILLIONS) 2020-2029
TABLE 136 UAE AGRICULTURE TEXTILE MARKET BY PRODUCT (KILOTONS) 2020-2029
TABLE 137 UAE AGRICULTURE TEXTILE MARKET BY FIBER MATERIAL (USD MILLIONS) 2020-2029
TABLE 138 UAE AGRICULTURE TEXTILE MARKET BY FIBER MATERIAL (KILOTONS) 2020-2029
TABLE 139 UAE AGRICULTURE TEXTILE MARKET BY APPLICATIPON (USD MILLIONS) 2020-2029
TABLE 140 UAE AGRICULTURE TEXTILE MARKET BY APPLICATIPON (KILOTONS) 2020-2029
TABLE 141 SAUDI ARABIA AGRICULTURE TEXTILE MARKET BY PRODUCT (USD MILLIONS) 2020-2029
TABLE 142 SAUDI ARABIA AGRICULTURE TEXTILE MARKET BY PRODUCT (KILOTONS) 2020-2029
TABLE 143 SAUDI ARABIA AGRICULTURE TEXTILE MARKET BY FIBER MATERIAL (USD MILLIONS) 2020-2029
TABLE 144 SAUDI ARABIA AGRICULTURE TEXTILE MARKET BY FIBER MATERIAL (KILOTONS) 2020-2029
TABLE 145 SAUDI ARABIA AGRICULTURE TEXTILE MARKET BY APPLICATIPON (USD MILLIONS) 2020-2029
TABLE 146 SAUDI ARABIA AGRICULTURE TEXTILE MARKET BY APPLICATIPON (KILOTONS) 2020-2029
TABLE 147 SOUTH AFRICA AGRICULTURE TEXTILE MARKET BY PRODUCT (USD MILLIONS) 2020-2029
TABLE 148 SOUTH AFRICA AGRICULTURE TEXTILE MARKET BY PRODUCT (KILOTONS) 2020-2029
TABLE 149 SOUTH AFRICA AGRICULTURE TEXTILE MARKET BY FIBER MATERIAL (USD MILLIONS) 2020-2029
TABLE 150 SOUTH AFRICA AGRICULTURE TEXTILE MARKET BY FIBER MATERIAL (KILOTONS) 2020-2029
TABLE 151 SOUTH AFRICA AGRICULTURE TEXTILE MARKET BY APPLICATIPON (USD MILLIONS) 2020-2029
TABLE 152 SOUTH AFRICA AGRICULTURE TEXTILE MARKET BY APPLICATIPON (KILOTONS) 2020-2029
TABLE 153 REST OF MIDDLE EAST AND AFRICA AGRICULTURE TEXTILE MARKET BY PRODUCT (USD MILLIONS) 2020-2029
TABLE 154 REST OF MIDDLE EAST AND AFRICA AGRICULTURE TEXTILE MARKET BY PRODUCT (KILOTONS) 2020-2029
TABLE 155 REST OF MIDDLE EAST AND AFRICA AGRICULTURE TEXTILE MARKET BY FIBER MATERIAL (USD MILLIONS) 2020-2029
TABLE 156 REST OF MIDDLE EAST AND AFRICA AGRICULTURE TEXTILE MARKET BY FIBER MATERIAL (KILOTONS) 2020-2029
TABLE 157 REST OF MIDDLE EAST AND AFRICA AGRICULTURE TEXTILE MARKET BY APPLICATIPON (USD MILLIONS) 2020-2029
TABLE 158 REST OF MIDDLE EAST AND AFRICA AGRICULTURE TEXTILE MARKET BY APPLICATIPON (KILOTONS) 2020-2029
LIST OF FIGURES
FIGURE 1 MARKET DYNAMICS
FIGURE 2 MARKET SEGMENTATION
FIGURE 3 REPORT TIMELINES: YEARS CONSIDERED
FIGURE 4 DATA TRIANGULATION
FIGURE 5 BOTTOM-UP APPROACH
FIGURE 6 TOP-DOWN APPROACH
FIGURE 7 RESEARCH FLOW
FIGURE 8 GLOBAL AGRICULTURE TEXTILE MARKET BY PRODUCT, USD MILLION, 2020-2029
FIGURE 9 GLOBAL AGRICULTURE TEXTILE MARKET BY FIBER MATERIAL, USD MILLION, 2020-2029
FIGURE 10 GLOBAL AGRICULTURE TEXTILE MARKET BY APPLICATIPON, USD MILLION, 2020-2029
FIGURE 11 GLOBAL AGRICULTURE TEXTILE MARKET BY REGION, USD MILLION, 2020-2029
FIGURE 12 PORTER’S FIVE FORCES MODEL
FIGURE 13 NORTH AMERICA AGRICULTURE TEXTILE MARKET SNAPSHOT
FIGURE 14 EUROPE AGRICULTURE TEXTILE MARKET SNAPSHOT
FIGURE 15 ASIA PACIFIC AGRICULTURE TEXTILE MARKET SNAPSHOT
FIGURE 16 SOUTH AMERICA AGRICULTURE TEXTILE MARKET SNAPSHOT
FIGURE 17 MIDDLE EAST & AFRICA AGRICULTURE TEXTILE MARKET SNAPSHOT
FIGURE 18 MARKET SHARE ANALYSIS
FIGURE 19 BEAULIEU TECHNICAL TEXTILES: COMPANY SNAPSHOT
FIGURE 20 BELTON INDUSTRIES, INC.: COMPANY SNAPSHOT
FIGURE 21 MEYABOND INDUSTRY & TRADING (BEIJING) CO. LTD: COMPANY SNAPSHOT
FIGURE 22 CAPATEX LTD: COMPANY SNAPSHOT
FIGURE 23 NEO CORP INTERNATIONAL LTD.: COMPANY SNAPSHOT
FIGURE 24 DIATEX: COMPANY SNAPSHOT
FIGURE 25 HY-TEX (U.K.) LTD: COMPANY SNAPSHOT
FIGURE 26 ZHONGSHAN HONGJUN NONWOVENS CO. LTD: COMPANY SNAPSHOT
FIGURE 27 SRF LTD: COMPANY SNAPSHOT
DOWNLOAD FREE SAMPLE REPORT
License Type
SPEAK WITH OUR ANALYST
Want to know more about the report or any specific requirement?
WANT TO CUSTOMIZE THE REPORT?
Our Clients Speak
We asked them to research ‘ Equipment market’ all over the world, and their whole arrangement was helpful to us. thehealthanalytics.com insightful analysis and reports contributed to our current analysis and in creating a future strategy. Besides, the te
Yosuke Mitsui
Senior Associate Construction Equipment Sales & Marketing
We asked them to research ‘Equipment market’ all over the world, and their whole arrangement was helpful to us. thehealthanalytics.com insightful analysis and reports contributed to our current analysis and in creating a future strategy. Besides, the te


