

Base Year Value ()
x.x %
x.x %
CAGR ()
x.x %
x.x %
Forecast Year Value ()
x.x %
x.x %
Historical Data Period
Largest Region
Forecast Period
Medical Exoskeleton Market by Component (Hardware, Software), Type (Powered Exoskeleton, Passive Exoskeleton), Extremity (Upper Extremity, Lower Extremity), Mobility (Mobile, Stationary, Medical, Rigid, Soft), and Region (North America, Europe, Asia Pacific, South America, Middle East and Africa), Global trends and forecast from 2022 to 2029
Instant access to hundreds of data points and trends
- Market estimates from 2014-2029
- Competitive analysis, industry segmentation, financial benchmarks
- Incorporates SWOT, Porter's Five Forces and risk management frameworks
- PDF report or online database with Word, Excel and PowerPoint export options
- 100% money back guarantee
Medical Exoskeleton Market Overview
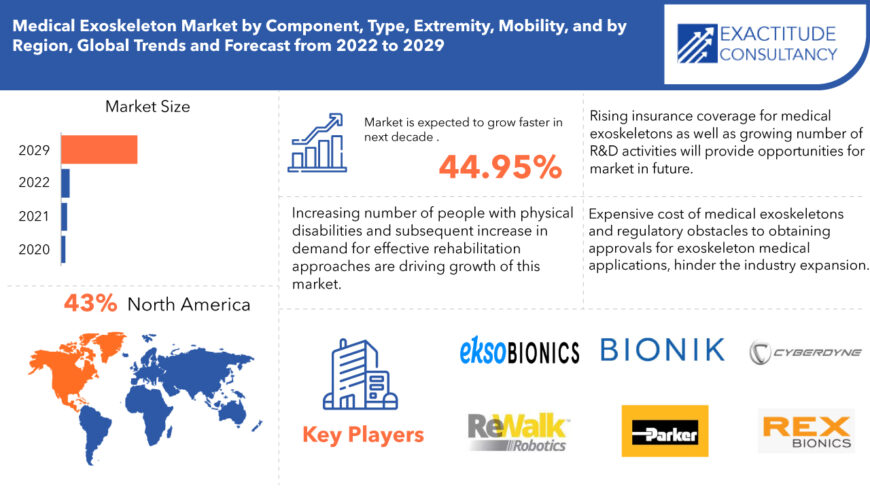
The global medical exoskeleton market is expected to grow at 44.95% CAGR from 2022 to 2029. It is expected to reach above 3881.22 USD million by 2029 from 200 USD million in 2020.
Exoskeletons are employed in a variety of disciplines, including military, civilian, and rehabilitation, to improve troops' travel and loading capacities, to boost an operator's load-handling capabilities, and in the medical profession to improve lost functioning and patient life. It can also be used to treat musculoskeletal diseases. It aids physical therapists in training individuals with motor nerve degeneration and motor cognitive limitations.
Exoskeletons are robotics and bio-mechatronic applications aimed at augmenting people while performing a range of jobs. Exoskeletons are sometimes referred to as robotic suits, powered armor, wearable machines, power jackets, and exo-frames or suits. The area of exoskeleton systems is constantly evolving in the current context.
Medical exoskeletons are wearable electromechanical devices that have been designed as an external framework that is worn on the body to aid patients in recovering from injuries and improving biological capacities, such as orthotic devices for gait rehabilitation or locomotion support. As a result, this frame provides greater flexibility, strength, and endurance to the limbs.
| ATTRIBUTE | DETAILS |
| Study period | 2020-2029 |
| Base year | 2021 |
| Estimated year | 2022 |
| Forecasted year | 2022-2029 |
| Historical period | 2018-2020 |
| Unit | Value (USD Billion), Volume (Thousand Units) |
| Segmentation | By Component, By Type, By Extremity, By Mobility, By Region |
| By Component
|
|
| By Type
|
|
| By Extremity
|
|
| By Mobility
|
|
|
By Region |
|
Furthermore, an increasing number of people with physical disabilities, as well as the subsequent increase in demand for effective rehabilitation approaches, are driving the growth of this market. The number of people with physical impairments is quickly increasing as a result of car accidents, strokes, and serious injuries, which should encourage company growth. Strokes are more common in the senior population. Other factors include agreements and collaborations among companies and research organizations for the development of exoskeleton technology, and increasing insurance coverage for medical exoskeletons in several countries provides an opportunity for the market expansion.
Additionally, assistive technology is a critical component of the healthcare business. Many rehabilitation facilities in numerous countries utilize assistive devices that are designed to aid an individual in doing a certain activity; utilization of such assistive devices should support industry expansion over the projection timeline.
However, the expensive cost of medical exoskeletons may, to some extent and regulatory obstacles to obtaining approvals for exoskeleton medical applications, hinder and challenge the industry expansion. But increasing insurance coverage for medical exoskeletons in a lot of nations as well as growing number of R&D activities will provide opportunities for market expansion in the future years.
The COVID-19 pandemic spread throughout the world and that disrupted the supply chain globally. Due to lockdown, the production process of the automotive industry was halted rather than closed and that resulted in decreased demand and sales for vehicles in the market. As the world markets have opened-up, they are focusing on having less carbon emissions and fuel efficiency and this is expected to gain potential growth in the medical exoskeleton market. The pandemic has had a negative influence on the medical exoskeleton market.
[caption id="attachment_10080" align="alignleft" width="870"]
Frequently Asked Questions
• What is the worth of the Medical Exoskeleton market?
The Medical Exoskeleton market size had crossed USD 200.00 million in 2020 and will observe a CAGR of more than 44.95% up to 2029 driven by the rising geriatric population.
• What is the size of the North America Medical Exoskeleton industry?
North America accounted for a 43% share of the medical exoskeleton market in 2020 and is expected to maintain its dominance during the forecast period.
• What are the challenges, drivers and opportunities for the Medical Exoskeleton market?
Increasing number of people with physical disabilities, as well as the subsequent increase in demand for effective rehabilitation approaches, are driving the growth of this market. The expensive cost of medical exoskeletons may, to some extent and regulatory obstacles to obtaining approvals for exoskeleton medical applications, hinder and challenge the industry expansion. But increasing insurance coverage for medical exoskeletons in a lot of nations as well as growing number of R&D activities will provide opportunities for market expansion in the future years.
• Which are the top companies to hold the market share in the Medical Exoskeleton market?
Ekso Bionics Holdings, Inc., ReWalk Robotics Ltd., Parker Hannifin Corp, CYBERDYNE Inc., Bionik Laboratories Corp, Rex Bionics Ltd., B-TEMIA Inc., Hocoma AG, Wearable Robotics SRL, Gogoa Mobility Robots SL, ExoAtlet and others. are among the leading players in the global medical exoskeleton market.
• Which is the largest regional market for Medical Exoskeleton Market?
Expanding senior population, rising demand for self-assist exoskeletons, high stroke prevalence, and rising incidence of spinal cord injuries in the North American region. North America accounted for a large share of the medical exoskeleton market in 2020 and is expected to maintain its dominance during the forecast period.
• Which region is expected to have the fastest growth rate within the forecast period?
Due to its large elder patient population, quick development of the healthcare industry, increasing healthcare expenditure and manufacturers' shift of attention to emerging nations, Asia-Pacific is expected to have the highest CAGR in coming years.
Medical Exoskeleton Market Segment Analysis
The global medical exoskeleton market is segmented by component, type, extremity, mobility, and region. Based on the component segment, the medical exoskeleton market includes Hardware, Software. The hardware industry is expected to grow rapidly as a result of increased customer awareness. The increased need for smarter and more interactive solutions has resulted in more updated and improved technology with enhanced capabilities. The increased efforts made by product makers, as well as the rising demand for various hardware sub-components and power sources, would boost market revenue. Based on type segment, the medical exoskeleton market includes Powered Exoskeleton, Passive Exoskeleton. Due to the general growing need for personal safety and productivity, the powered medical exoskeleton market is expected to grow significantly through 2027. Given the existence of various regulating functions and sensors, these exoskeletons are widely utilized to measure tilt, speed, and motion. For example, Cyberdyne, a Japanese robotics technology firm, created the Hybrid Assistive Limb (HAL), a powered exoskeleton suit used in the treatment of lower limb problems. The growing use of powered medical exoskeletons by construction workers to move heavy things will contribute to the segment's growth. The medical exoskeleton market can be classified based on the extremity, that is, Upper Extremity, Lower Extremity. Lower Extremity Medical Exoskeletons account for the largest share of the Medical Exoskeleton Market due to the use of Lower Extremity Medical Exoskeletons in the rehabilitation of lower body parts for prevention of normal motions such as mobility and increasing awareness of Lower Extremity Medical Exoskeletons in developing countries are fueling the segment's growth. Based on the mobility segment, the medical exoskeleton market includes Mobile, Stationary, Medical, Rigid, Soft. The size of the mobile medical exoskeleton market is predicted to develop significantly as the number of favorable reimbursement policies increases. These exoskeletons give optimal mobility aid to paralyzed people due to their small and lightweight design. Another factor affecting market expansion is the increasing number of R&D activities. [caption id="attachment_10082" align="alignleft" width="680"]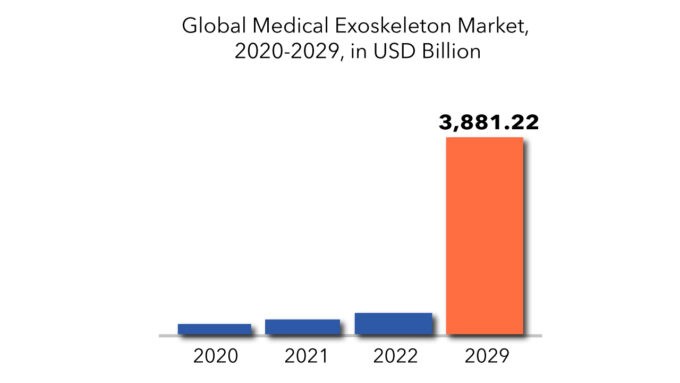
Medical Exoskeleton Market Players
The global medical exoskeleton market key players include Ekso Bionics Holdings, Inc., ReWalk Robotics Ltd., Parker Hannifin Corp, CYBERDYNE Inc., Bionik Laboratories Corp, Rex Bionics Ltd., B-TEMIA Inc., Hocoma AG, Wearable Robotics SRL, Gogoa Mobility Robots SL, ExoAtlet and others. The market for medical exoskeleton is moderately competitive, dominated by a few significant competitors. Various businesses are focusing on organic growth tactics such as new launches, product approvals, and other things like patents and events. Mergers & Acquisitions, partnerships, and collaborations were among the inorganic growth tactics observed in the market. These initiatives such as development and expansion have paved the road for market participants to expand their business. These market players in the medical exoskeleton market are expected to benefit from attractive growth prospects in the future.Who Should Buy? Or Key stakeholders
- Government and research organization
- Investors
- Trade Associations
- Physiotherapy labs
- Exoskeleton manufacturers
- Scientific research organization
- Healthcare Industry
Medical Exoskeleton Market Regional Analysis
The medical exoskeleton market by region includes North America, Asia-Pacific (APAC), Europe, South America, and Middle East & Africa (MEA).- North America: includes the US, Canada, Mexico
- Asia Pacific: includes China, Japan, South Korea, India, Australia, ASEAN and Rest of APAC
- Europe: includes UK, Germany, France, Italy, Spain, Russia, and Rest of Europe
- South America: includes Brazil, Argentina and Rest of South America
- Middle East & Africa: includes Turkey, UAE, Saudi Arabia, South Africa, and Rest of MEA
Key Market Segments: Medical Exoskeleton Market
Medical Exoskeleton Market By Component, 2020-2029, (USD Million) (Thousand Units)- Hardware
- Software
- Powered Exoskeleton
- Passive Exoskeleton
- Upper Extremity
- Lower Extremity
- Mobile
- Stationary
- Medical
- Rigid
- Soft
- North America
- Europe
- Asia Pacific
- South America
- Middle East And Africa
- INTRODUCTION
- MARKET DEFINITION
- MARKET SEGMENTATION
- RESEARCH TIMELINES
- ASSUMPTIONS AND LIMITATIONS
- RESEARCH METHODOLOGY
- DATA MINING
- SECONDARY RESEARCH
- PRIMARY RESEARCH
- SUBJECT-MATTER EXPERTS’ ADVICE
- QUALITY CHECKS
- FINAL REVIEW
- DATA TRIANGULATION
- BOTTOM-UP APPROACH
- TOP-DOWN APPROACH
- RESEARCH FLOW
- DATA SOURCES
- DATA MINING
- EXECUTIVE SUMMARY
- MARKET OVERVIEW
- GLOBAL MEDICAL EXOSKELETON MARKET OUTLOOK
- MARKET DRIVERS
- MARKET RESTRAINTS
- MARKET OPPORTUNITIES
- IMPACT OF COVID-19 ON MEDICAL EXOSKELETON MARKET
- PORTER’S FIVE FORCES MODEL
- THREAT FROM NEW ENTRANTS
- THREAT FROM SUBSTITUTES
- BARGAINING POWER OF SUPPLIERS
- BARGAINING POWER OF CUSTOMERS
- DEGREE OF COMPETITION
- INDUSTRY VALUE CHAIN ANALYSIS
- GLOBAL MEDICAL EXOSKELETON MARKET OUTLOOK
- GLOBAL MEDICAL EXOSKELETON MARKET BY COMPONENT
- HARDWARE
- SOFTWARE
- GLOBAL MEDICAL EXOSKELETON MARKET BY TYPE
- POWERED EXOSKELETON
- PASSIVE EXOSKELETON
- GLOBAL MEDICAL EXOSKELETON MARKET BY EXTREMITY
- UPPER EXTREMITY
- LOWER EXTREMITY
- GLOBAL MEDICAL EXOSKELETON MARKET BY MOBILITY
- MOBILE
- STATIONARY
- MEDICAL
- RIGID
- SOFT
- GLOBAL MEDICAL EXOSKELETON MARKET BY REGION
- NORTH AMERICA
- US
- CANADA
- MEXICO
- SOUTH AMERICA
- BRAZIL
- ARGENTINA
- COLOMBIA
- REST OF SOUTH AMERICA
- EUROPE
- GERMANY
- UK
- FRANCE
- ITALY
- SPAIN
- RUSSIA
- REST OF EUROPE
- ASIA PACIFIC
- INDIA
- CHINA
- JAPAN
- SOUTH KOREA
- AUSTRALIA
- SOUTH-EAST ASIA
- REST OF ASIA PACIFIC
- MIDDLE EAST AND AFRICA
- UAE
- SAUDI ARABIA
- SOUTH AFRICA
- REST OF MIDDLE EAST AND AFRICA
- NORTH AMERICA
- COMPANY PROFILES* (BUSINESS OVERVIEW, COMPANY SNAPSHOT, PRODUCTS OFFERED, RECENT DEVELOPMENTS)
- EKSO BIONICS HOLDINGS, INC.
- REWALK ROBOTICS LTD.
- PARKER HANNIFIN CORP
- CYBERDYNE INC.
- BIONIK LABORATORIES CORP
- REX BIONICS LTD.
- B-TEMIA INC.
- HOCOMA AG
- WEARABLE ROBOTICS SRL
- GOGOA MOBILITY ROBOTS SL
- EXOATLET *THE COMPANY LIST IS INDICATIVE
LIST OF TABLES
TABLE 1 GLOBAL MEDICAL EXOSKELETON MARKET BY COMPONENT (USD MILLIONS) 2020-2029
TABLE 2 GLOBAL MEDICAL EXOSKELETON MARKET BY COMPONENT (THOUSAND UNITS) 2020-2029
TABLE 3 GLOBAL MEDICAL EXOSKELETON MARKET BY TYPE (USD MILLIONS) 2020-2029
TABLE 4 GLOBAL MEDICAL EXOSKELETON MARKET BY TYPE (THOUSAND UNITS) 2020-2029
TABLE 5 GLOBAL MEDICAL EXOSKELETON MARKET BY EXTREMITY (USD MILLIONS) 2020-2029
TABLE 6 GLOBAL MEDICAL EXOSKELETON MARKET BY EXTREMITY (THOUSAND UNITS) 2020-2029
TABLE 7 GLOBAL MEDICAL EXOSKELETON MARKET BY MOBILITY (USD MILLIONS) 2020-2029
TABLE 8 GLOBAL MEDICAL EXOSKELETON MARKET BY MOBILITY (THOUSAND UNITS) 2020-2029
TABLE 9 GLOBAL MEDICAL EXOSKELETON MARKET BY REGION (USD MILLIONS) 2020-2029
TABLE 10 GLOBAL MEDICAL EXOSKELETON MARKET BY REGION (THOUSAND UNITS) 2020-2029
TABLE 11 US MEDICAL EXOSKELETON MARKET BY COMPONENT (USD MILLIONS) 2020-2029
TABLE 12 US MEDICAL EXOSKELETON MARKET BY COMPONENT (THOUSAND UNITS) 2020-2029
TABLE 13 US MEDICAL EXOSKELETON MARKET BY TYPE (USD MILLIONS) 2020-2029
TABLE 14 US MEDICAL EXOSKELETON MARKET BY TYPE (THOUSAND UNITS) 2020-2029
TABLE 15 US MEDICAL EXOSKELETON MARKET BY EXTREMITY (USD MILLIONS) 2020-2029
TABLE 16 US MEDICAL EXOSKELETON MARKET BY EXTREMITY (THOUSAND UNITS) 2020-2029
TABLE 17 US MEDICAL EXOSKELETON MARKET BY MOBILITY (USD MILLIONS) 2020-2029
TABLE 18 US MEDICAL EXOSKELETON MARKET BY MOBILITY (THOUSAND UNITS) 2020-2029
TABLE 19 CANADA MEDICAL EXOSKELETON MARKET BY COMPONENT (USD MILLIONS) 2020-2029
TABLE 20 CANADA MEDICAL EXOSKELETON MARKET BY COMPONENT (THOUSAND UNITS) 2020-2029
TABLE 21 CANADA MEDICAL EXOSKELETON MARKET BY TYPE (USD MILLIONS) 2020-2029
TABLE 22 CANADA MEDICAL EXOSKELETON MARKET BY TYPE (THOUSAND UNITS) 2020-2029
TABLE 23 CANADA MEDICAL EXOSKELETON MARKET BY EXTREMITY (USD MILLIONS) 2020-2029
TABLE 24 CANADA MEDICAL EXOSKELETON MARKET BY EXTREMITY (THOUSAND UNITS) 2020-2029
TABLE 25 CANADA MEDICAL EXOSKELETON MARKET BY MOBILITY (USD MILLIONS) 2020-2029
TABLE 26 CANADA MEDICAL EXOSKELETON MARKET BY MOBILITY (THOUSAND UNITS) 2020-2029
TABLE 27 MEXICO MEDICAL EXOSKELETON MARKET BY COMPONENT (USD MILLIONS) 2020-2029
TABLE 28 MEXICO MEDICAL EXOSKELETON MARKET BY COMPONENT (THOUSAND UNITS) 2020-2029
TABLE 29 MEXICO MEDICAL EXOSKELETON MARKET BY TYPE (USD MILLIONS) 2020-2029
TABLE 30 MEXICO MEDICAL EXOSKELETON MARKET BY TYPE (THOUSAND UNITS) 2020-2029
TABLE 31 MEXICO MEDICAL EXOSKELETON MARKET BY EXTREMITY (USD MILLIONS) 2020-2029
TABLE 32 MEXICO MEDICAL EXOSKELETON MARKET BY EXTREMITY (THOUSAND UNITS) 2020-2029
TABLE 33 MEXICO MEDICAL EXOSKELETON MARKET BY MOBILITY (USD MILLIONS) 2020-2029
TABLE 34 MEXICO MEDICAL EXOSKELETON MARKET BY MOBILITY (THOUSAND UNITS) 2020-2029
TABLE 35 BRAZIL MEDICAL EXOSKELETON MARKET BY COMPONENT (USD MILLIONS) 2020-2029
TABLE 36 BRAZIL MEDICAL EXOSKELETON MARKET BY COMPONENT (THOUSAND UNITS) 2020-2029
TABLE 37 BRAZIL MEDICAL EXOSKELETON MARKET BY TYPE (USD MILLIONS) 2020-2029
TABLE 38 BRAZIL MEDICAL EXOSKELETON MARKET BY TYPE (THOUSAND UNITS) 2020-2029
TABLE 39 BRAZIL MEDICAL EXOSKELETON MARKET BY EXTREMITY (USD MILLIONS) 2020-2029
TABLE 40 BRAZIL MEDICAL EXOSKELETON MARKET BY EXTREMITY (THOUSAND UNITS) 2020-2029
TABLE 41 BRAZIL MEDICAL EXOSKELETON MARKET BY MOBILITY (USD MILLIONS) 2020-2029
TABLE 42 BRAZIL MEDICAL EXOSKELETON MARKET BY MOBILITY (THOUSAND UNITS) 2020-2029
TABLE 43 ARGENTINA MEDICAL EXOSKELETON MARKET BY COMPONENT (USD MILLIONS) 2020-2029
TABLE 44 ARGENTINA MEDICAL EXOSKELETON MARKET BY COMPONENT (THOUSAND UNITS) 2020-2029
TABLE 45 ARGENTINA MEDICAL EXOSKELETON MARKET BY TYPE (USD MILLIONS) 2020-2029
TABLE 46 ARGENTINA MEDICAL EXOSKELETON MARKET BY TYPE (THOUSAND UNITS) 2020-2029
TABLE 47 ARGENTINA MEDICAL EXOSKELETON MARKET BY EXTREMITY (USD MILLIONS) 2020-2029
TABLE 48 ARGENTINA MEDICAL EXOSKELETON MARKET BY EXTREMITY (THOUSAND UNITS) 2020-2029
TABLE 49 ARGENTINA MEDICAL EXOSKELETON MARKET BY MOBILITY (USD MILLIONS) 2020-2029
TABLE 50 ARGENTINA MEDICAL EXOSKELETON MARKET BY MOBILITY (THOUSAND UNITS) 2020-2029
TABLE 51 COLOMBIA MEDICAL EXOSKELETON MARKET BY COMPONENT (USD MILLIONS) 2020-2029
TABLE 52 COLOMBIA MEDICAL EXOSKELETON MARKET BY COMPONENT (THOUSAND UNITS) 2020-2029
TABLE 53 COLOMBIA MEDICAL EXOSKELETON MARKET BY TYPE (USD MILLIONS) 2020-2029
TABLE 54 COLOMBIA MEDICAL EXOSKELETON MARKET BY TYPE (THOUSAND UNITS) 2020-2029
TABLE 55 COLOMBIA MEDICAL EXOSKELETON MARKET BY EXTREMITY (USD MILLIONS) 2020-2029
TABLE 56 COLOMBIA MEDICAL EXOSKELETON MARKET BY EXTREMITY (THOUSAND UNITS) 2020-2029
TABLE 57 COLOMBIA MEDICAL EXOSKELETON MARKET BY MOBILITY (USD MILLIONS) 2020-2029
TABLE 58 COLOMBIA MEDICAL EXOSKELETON MARKET BY MOBILITY (THOUSAND UNITS) 2020-2029
TABLE 59 REST OF SOUTH AMERICA MEDICAL EXOSKELETON MARKET BY COMPONENT (USD MILLIONS) 2020-2029
TABLE 60 REST OF SOUTH AMERICA MEDICAL EXOSKELETON MARKET BY COMPONENT (THOUSAND UNITS) 2020-2029
TABLE 61 REST OF SOUTH AMERICA MEDICAL EXOSKELETON MARKET BY TYPE (USD MILLIONS) 2020-2029
TABLE 62 REST OF SOUTH AMERICA MEDICAL EXOSKELETON MARKET BY TYPE (THOUSAND UNITS) 2020-2029
TABLE 63 REST OF SOUTH AMERICA MEDICAL EXOSKELETON MARKET BY EXTREMITY (USD MILLIONS) 2020-2029
TABLE 64 REST OF SOUTH AMERICA MEDICAL EXOSKELETON MARKET BY EXTREMITY (THOUSAND UNITS) 2020-2029
TABLE 65 REST OF SOUTH AMERICA MEDICAL EXOSKELETON MARKET BY MOBILITY (USD MILLIONS) 2020-2029
TABLE 66 REST OF SOUTH AMERICA MEDICAL EXOSKELETON MARKET BY MOBILITY (THOUSAND UNITS) 2020-2029
TABLE 67 INDIA MEDICAL EXOSKELETON MARKET BY COMPONENT (USD MILLIONS) 2020-2029
TABLE 68 INDIA MEDICAL EXOSKELETON MARKET BY COMPONENT (THOUSAND UNITS) 2020-2029
TABLE 69 INDIA MEDICAL EXOSKELETON MARKET BY TYPE (USD MILLIONS) 2020-2029
TABLE 70 INDIA MEDICAL EXOSKELETON MARKET BY TYPE (THOUSAND UNITS) 2020-2029
TABLE 71 INDIA MEDICAL EXOSKELETON MARKET BY EXTREMITY (USD MILLIONS) 2020-2029
TABLE 72 INDIA MEDICAL EXOSKELETON MARKET BY EXTREMITY (THOUSAND UNITS) 2020-2029
TABLE 73 INDIA MEDICAL EXOSKELETON MARKET BY MOBILITY (USD MILLIONS) 2020-2029
TABLE 74 INDIA MEDICAL EXOSKELETON MARKET BY MOBILITY (THOUSAND UNITS) 2020-2029
TABLE 75 CHINA MEDICAL EXOSKELETON MARKET BY COMPONENT (USD MILLIONS) 2020-2029
TABLE 76 CHINA MEDICAL EXOSKELETON MARKET BY COMPONENT (THOUSAND UNITS) 2020-2029
TABLE 77 CHINA MEDICAL EXOSKELETON MARKET BY TYPE (USD MILLIONS) 2020-2029
TABLE 78 CHINA MEDICAL EXOSKELETON MARKET BY TYPE (THOUSAND UNITS) 2020-2029
TABLE 79 CHINA MEDICAL EXOSKELETON MARKET BY EXTREMITY (USD MILLIONS) 2020-2029
TABLE 80 CHINA MEDICAL EXOSKELETON MARKET BY EXTREMITY (THOUSAND UNITS) 2020-2029
TABLE 81 CHINA MEDICAL EXOSKELETON MARKET BY MOBILITY (USD MILLIONS) 2020-2029
TABLE 82 CHINA MEDICAL EXOSKELETON MARKET BY MOBILITY (THOUSAND UNITS) 2020-2029
TABLE 83 JAPAN MEDICAL EXOSKELETON MARKET BY COMPONENT (USD MILLIONS) 2020-2029
TABLE 84 JAPAN MEDICAL EXOSKELETON MARKET BY COMPONENT (THOUSAND UNITS) 2020-2029
TABLE 85 JAPAN MEDICAL EXOSKELETON MARKET BY TYPE (USD MILLIONS) 2020-2029
TABLE 86 JAPAN MEDICAL EXOSKELETON MARKET BY TYPE (THOUSAND UNITS) 2020-2029
TABLE 87 JAPAN MEDICAL EXOSKELETON MARKET BY EXTREMITY (USD MILLIONS) 2020-2029
TABLE 88 JAPAN MEDICAL EXOSKELETON MARKET BY EXTREMITY (THOUSAND UNITS) 2020-2029
TABLE 89 JAPAN MEDICAL EXOSKELETON MARKET BY MOBILITY (USD MILLIONS) 2020-2029
TABLE 90 JAPAN MEDICAL EXOSKELETON MARKET BY MOBILITY (THOUSAND UNITS) 2020-2029
TABLE 91 SOUTH KOREA MEDICAL EXOSKELETON MARKET BY COMPONENT (USD MILLIONS) 2020-2029
TABLE 92 SOUTH KOREA MEDICAL EXOSKELETON MARKET BY COMPONENT (THOUSAND UNITS) 2020-2029
TABLE 93 SOUTH KOREA MEDICAL EXOSKELETON MARKET BY TYPE (USD MILLIONS) 2020-2029
TABLE 94 SOUTH KOREA MEDICAL EXOSKELETON MARKET BY TYPE (THOUSAND UNITS) 2020-2029
TABLE 95 SOUTH KOREA MEDICAL EXOSKELETON MARKET BY EXTREMITY (USD MILLIONS) 2020-2029
TABLE 96 SOUTH KOREA MEDICAL EXOSKELETON MARKET BY EXTREMITY (THOUSAND UNITS) 2020-2029
TABLE 97 SOUTH KOREA MEDICAL EXOSKELETON MARKET BY MOBILITY (USD MILLIONS) 2020-2029
TABLE 98 SOUTH KOREA MEDICAL EXOSKELETON MARKET BY MOBILITY (THOUSAND UNITS) 2020-2029
TABLE 99 AUSTRALIA MEDICAL EXOSKELETON MARKET BY COMPONENT (USD MILLIONS) 2020-2029
TABLE 100 AUSTRALIA MEDICAL EXOSKELETON MARKET BY COMPONENT (THOUSAND UNITS) 2020-2029
TABLE 101 AUSTRALIA MEDICAL EXOSKELETON MARKET BY TYPE (USD MILLIONS) 2020-2029
TABLE 102 AUSTRALIA MEDICAL EXOSKELETON MARKET BY TYPE (THOUSAND UNITS) 2020-2029
TABLE 103 AUSTRALIA MEDICAL EXOSKELETON MARKET BY EXTREMITY (USD MILLIONS) 2020-2029
TABLE 104 AUSTRALIA MEDICAL EXOSKELETON MARKET BY EXTREMITY (THOUSAND UNITS) 2020-2029
TABLE 105 AUSTRALIA MEDICAL EXOSKELETON MARKET BY MOBILITY (USD MILLIONS) 2020-2029
TABLE 106 AUSTRALIA MEDICAL EXOSKELETON MARKET BY MOBILITY (THOUSAND UNITS) 2020-2029
TABLE 107 SOUTH-EAST ASIA MEDICAL EXOSKELETON MARKET BY COMPONENT (USD MILLIONS) 2020-2029
TABLE 108 SOUTH-EAST ASIA MEDICAL EXOSKELETON MARKET BY COMPONENT (THOUSAND UNITS) 2020-2029
TABLE 109 SOUTH-EAST ASIA MEDICAL EXOSKELETON MARKET BY TYPE (USD MILLIONS) 2020-2029
TABLE 110 SOUTH-EAST ASIA MEDICAL EXOSKELETON MARKET BY TYPE (THOUSAND UNITS) 2020-2029
TABLE 111 SOUTH-EAST ASIA MEDICAL EXOSKELETON MARKET BY EXTREMITY (USD MILLIONS) 2020-2029
TABLE 112 SOUTH-EAST ASIA MEDICAL EXOSKELETON MARKET BY EXTREMITY (THOUSAND UNITS) 2020-2029
TABLE 113 SOUTH-EAST ASIA MEDICAL EXOSKELETON MARKET BY MOBILITY (USD MILLIONS) 2020-2029
TABLE 114 SOUTH-EAST ASIA MEDICAL EXOSKELETON MARKET BY MOBILITY (THOUSAND UNITS) 2020-2029
TABLE 115 REST OF ASIA PACIFIC MEDICAL EXOSKELETON MARKET BY COMPONENT (USD MILLIONS) 2020-2029
TABLE 116 REST OF ASIA PACIFIC MEDICAL EXOSKELETON MARKET BY COMPONENT (THOUSAND UNITS) 2020-2029
TABLE 117 REST OF ASIA PACIFIC MEDICAL EXOSKELETON MARKET BY TYPE (USD MILLIONS) 2020-2029
TABLE 118 REST OF ASIA PACIFIC MEDICAL EXOSKELETON MARKET BY TYPE (THOUSAND UNITS) 2020-2029
TABLE 119 REST OF ASIA PACIFIC MEDICAL EXOSKELETON MARKET BY EXTREMITY (USD MILLIONS) 2020-2029
TABLE 120 REST OF ASIA PACIFIC MEDICAL EXOSKELETON MARKET BY EXTREMITY (THOUSAND UNITS) 2020-2029
TABLE 121 REST OF ASIA PACIFIC MEDICAL EXOSKELETON MARKET BY MOBILITY (USD MILLIONS) 2020-2029
TABLE 122 REST OF ASIA PACIFIC MEDICAL EXOSKELETON MARKET BY MOBILITY (THOUSAND UNITS) 2020-2029
TABLE 123 GERMANY MEDICAL EXOSKELETON MARKET BY COMPONENT (USD MILLIONS) 2020-2029
TABLE 124 GERMANY MEDICAL EXOSKELETON MARKET BY COMPONENT (THOUSAND UNITS) 2020-2029
TABLE 125 GERMANY MEDICAL EXOSKELETON MARKET BY TYPE (USD MILLIONS) 2020-2029
TABLE 126 GERMANY MEDICAL EXOSKELETON MARKET BY TYPE (THOUSAND UNITS) 2020-2029
TABLE 127 GERMANY MEDICAL EXOSKELETON MARKET BY EXTREMITY (USD MILLIONS) 2020-2029
TABLE 128 GERMANY MEDICAL EXOSKELETON MARKET BY EXTREMITY (THOUSAND UNITS) 2020-2029
TABLE 129 GERMANY MEDICAL EXOSKELETON MARKET BY MOBILITY (USD MILLIONS) 2020-2029
TABLE 130 GERMANY MEDICAL EXOSKELETON MARKET BY MOBILITY (THOUSAND UNITS) 2020-2029
TABLE 131 UK MEDICAL EXOSKELETON MARKET BY COMPONENT (USD MILLIONS) 2020-2029
TABLE 132 UK MEDICAL EXOSKELETON MARKET BY COMPONENT (THOUSAND UNITS) 2020-2029
TABLE 133 UK MEDICAL EXOSKELETON MARKET BY TYPE (USD MILLIONS) 2020-2029
TABLE 134 UK MEDICAL EXOSKELETON MARKET BY TYPE (THOUSAND UNITS) 2020-2029
TABLE 135 UK MEDICAL EXOSKELETON MARKET BY EXTREMITY (USD MILLIONS) 2020-2029
TABLE 136 UK MEDICAL EXOSKELETON MARKET BY EXTREMITY (THOUSAND UNITS) 2020-2029
TABLE 137 UK MEDICAL EXOSKELETON MARKET BY MOBILITY (USD MILLIONS) 2020-2029
TABLE 138 UK MEDICAL EXOSKELETON MARKET BY MOBILITY (THOUSAND UNITS) 2020-2029
TABLE 139 FRANCE MEDICAL EXOSKELETON MARKET BY COMPONENT (USD MILLIONS) 2020-2029
TABLE 140 FRANCE MEDICAL EXOSKELETON MARKET BY COMPONENT (THOUSAND UNITS) 2020-2029
TABLE 141 FRANCE MEDICAL EXOSKELETON MARKET BY TYPE (USD MILLIONS) 2020-2029
TABLE 142 FRANCE MEDICAL EXOSKELETON MARKET BY TYPE (THOUSAND UNITS) 2020-2029
TABLE 143 FRANCE MEDICAL EXOSKELETON MARKET BY EXTREMITY (USD MILLIONS) 2020-2029
TABLE 144 FRANCE MEDICAL EXOSKELETON MARKET BY EXTREMITY (THOUSAND UNITS) 2020-2029
TABLE 145 FRANCE MEDICAL EXOSKELETON MARKET BY MOBILITY (USD MILLIONS) 2020-2029
TABLE 146 FRANCE MEDICAL EXOSKELETON MARKET BY MOBILITY (THOUSAND UNITS) 2020-2029
TABLE 147 ITALY MEDICAL EXOSKELETON MARKET BY COMPONENT (USD MILLIONS) 2020-2029
TABLE 148 ITALY MEDICAL EXOSKELETON MARKET BY COMPONENT (THOUSAND UNITS) 2020-2029
TABLE 149 ITALY MEDICAL EXOSKELETON MARKET BY TYPE (USD MILLIONS) 2020-2029
TABLE 150 ITALY MEDICAL EXOSKELETON MARKET BY TYPE (THOUSAND UNITS) 2020-2029
TABLE 151 ITALY MEDICAL EXOSKELETON MARKET BY EXTREMITY (USD MILLIONS) 2020-2029
TABLE 152 ITALY MEDICAL EXOSKELETON MARKET BY EXTREMITY (THOUSAND UNITS) 2020-2029
TABLE 153 ITALY MEDICAL EXOSKELETON MARKET BY MOBILITY (USD MILLIONS) 2020-2029
TABLE 154 ITALY MEDICAL EXOSKELETON MARKET BY MOBILITY (THOUSAND UNITS) 2020-2029
TABLE 155 SPAIN MEDICAL EXOSKELETON MARKET BY COMPONENT (USD MILLIONS) 2020-2029
TABLE 156 SPAIN MEDICAL EXOSKELETON MARKET BY COMPONENT (THOUSAND UNITS) 2020-2029
TABLE 157 SPAIN MEDICAL EXOSKELETON MARKET BY TYPE (USD MILLIONS) 2020-2029
TABLE 158 SPAIN MEDICAL EXOSKELETON MARKET BY TYPE (THOUSAND UNITS) 2020-2029
TABLE 159 SPAIN MEDICAL EXOSKELETON MARKET BY EXTREMITY (USD MILLIONS) 2020-2029
TABLE 160 SPAIN MEDICAL EXOSKELETON MARKET BY EXTREMITY (THOUSAND UNITS) 2020-2029
TABLE 161 SPAIN MEDICAL EXOSKELETON MARKET BY MOBILITY (USD MILLIONS) 2020-2029
TABLE 162 SPAIN MEDICAL EXOSKELETON MARKET BY MOBILITY (THOUSAND UNITS) 2020-2029
TABLE 163 RUSSIA MEDICAL EXOSKELETON MARKET BY COMPONENT (USD MILLIONS) 2020-2029
TABLE 164 RUSSIA MEDICAL EXOSKELETON MARKET BY COMPONENT (THOUSAND UNITS) 2020-2029
TABLE 165 RUSSIA MEDICAL EXOSKELETON MARKET BY TYPE (USD MILLIONS) 2020-2029
TABLE 166 RUSSIA MEDICAL EXOSKELETON MARKET BY TYPE (THOUSAND UNITS) 2020-2029
TABLE 167 RUSSIA MEDICAL EXOSKELETON MARKET BY EXTREMITY (USD MILLIONS) 2020-2029
TABLE 168 RUSSIA MEDICAL EXOSKELETON MARKET BY EXTREMITY (THOUSAND UNITS) 2020-2029
TABLE 169 RUSSIA MEDICAL EXOSKELETON MARKET BY MOBILITY (USD MILLIONS) 2020-2029
TABLE 170 RUSSIA MEDICAL EXOSKELETON MARKET BY MOBILITY (THOUSAND UNITS) 2020-2029
TABLE 171 REST OF EUROPE MEDICAL EXOSKELETON MARKET BY COMPONENT (USD MILLIONS) 2020-2029
TABLE 172 REST OF EUROPE MEDICAL EXOSKELETON MARKET BY COMPONENT (THOUSAND UNITS) 2020-2029
TABLE 173 REST OF EUROPE MEDICAL EXOSKELETON MARKET BY TYPE (USD MILLIONS) 2020-2029
TABLE 174 REST OF EUROPE MEDICAL EXOSKELETON MARKET BY TYPE (THOUSAND UNITS) 2020-2029
TABLE 175 REST OF EUROPE MEDICAL EXOSKELETON MARKET BY EXTREMITY (USD MILLIONS) 2020-2029
TABLE 176 REST OF EUROPE MEDICAL EXOSKELETON MARKET BY EXTREMITY (THOUSAND UNITS) 2020-2029
TABLE 177 REST OF EUROPE MEDICAL EXOSKELETON MARKET BY MOBILITY (USD MILLIONS) 2020-2029
TABLE 178 REST OF EUROPE MEDICAL EXOSKELETON MARKET BY MOBILITY (THOUSAND UNITS) 2020-2029
TABLE 179 UAE MEDICAL EXOSKELETON MARKET BY COMPONENT (USD MILLIONS) 2020-2029
TABLE 180 UAE MEDICAL EXOSKELETON MARKET BY COMPONENT (THOUSAND UNITS) 2020-2029
TABLE 181 UAE MEDICAL EXOSKELETON MARKET BY TYPE (USD MILLIONS) 2020-2029
TABLE 182 UAE MEDICAL EXOSKELETON MARKET BY TYPE (THOUSAND UNITS) 2020-2029
TABLE 183 UAE MEDICAL EXOSKELETON MARKET BY EXTREMITY (USD MILLIONS) 2020-2029
TABLE 184 UAE MEDICAL EXOSKELETON MARKET BY EXTREMITY (THOUSAND UNITS) 2020-2029
TABLE 185 UAE MEDICAL EXOSKELETON MARKET BY MOBILITY (USD MILLIONS) 2020-2029
TABLE 186 UAE MEDICAL EXOSKELETON MARKET BY MOBILITY (THOUSAND UNITS) 2020-2029
TABLE 187 SAUDI ARABIA MEDICAL EXOSKELETON MARKET BY COMPONENT (USD MILLIONS) 2020-2029
TABLE 188 SAUDI ARABIA MEDICAL EXOSKELETON MARKET BY COMPONENT (THOUSAND UNITS) 2020-2029
TABLE 189 SAUDI ARABIA MEDICAL EXOSKELETON MARKET BY TYPE (USD MILLIONS) 2020-2029
TABLE 190 SAUDI ARABIA MEDICAL EXOSKELETON MARKET BY TYPE (THOUSAND UNITS) 2020-2029
TABLE 191 SAUDI ARABIA MEDICAL EXOSKELETON MARKET BY EXTREMITY (USD MILLIONS) 2020-2029
TABLE 192 SAUDI ARABIA MEDICAL EXOSKELETON MARKET BY EXTREMITY (THOUSAND UNITS) 2020-2029
TABLE 193 SAUDI ARABIA MEDICAL EXOSKELETON MARKET BY MOBILITY (USD MILLIONS) 2020-2029
TABLE 194 SAUDI ARABIA MEDICAL EXOSKELETON MARKET BY MOBILITY (THOUSAND UNITS) 2020-2029
TABLE 195 SOUTH AFRICA MEDICAL EXOSKELETON MARKET BY COMPONENT (USD MILLIONS) 2020-2029
TABLE 196 SOUTH AFRICA MEDICAL EXOSKELETON MARKET BY COMPONENT (THOUSAND UNITS) 2020-2029
TABLE 197 SOUTH AFRICA MEDICAL EXOSKELETON MARKET BY TYPE (USD MILLIONS) 2020-2029
TABLE 198 SOUTH AFRICA MEDICAL EXOSKELETON MARKET BY TYPE (THOUSAND UNITS) 2020-2029
TABLE 199 SOUTH AFRICA MEDICAL EXOSKELETON MARKET BY EXTREMITY (USD MILLIONS) 2020-2029
TABLE 200 SOUTH AFRICA MEDICAL EXOSKELETON MARKET BY EXTREMITY (THOUSAND UNITS) 2020-2029
TABLE 201 SOUTH AFRICA MEDICAL EXOSKELETON MARKET BY MOBILITY (USD MILLIONS) 2020-2029
TABLE 202 SOUTH AFRICA MEDICAL EXOSKELETON MARKET BY MOBILITY (THOUSAND UNITS) 2020-2029
TABLE 203 REST OF MIDDLE EAST AND AFRICA MEDICAL EXOSKELETON MARKET BY COMPONENT (USD MILLIONS) 2020-2029
TABLE 204 REST OF MIDDLE EAST AND AFRICA MEDICAL EXOSKELETON MARKET BY COMPONENT (THOUSAND UNITS) 2020-2029
TABLE 205 REST OF MIDDLE EAST AND AFRICA MEDICAL EXOSKELETON MARKET BY TYPE (USD MILLIONS) 2020-2029
TABLE 206 REST OF MIDDLE EAST AND AFRICA MEDICAL EXOSKELETON MARKET BY TYPE (THOUSAND UNITS) 2020-2029
TABLE 207 REST OF MIDDLE EAST AND AFRICA MEDICAL EXOSKELETON MARKET BY EXTREMITY (USD MILLIONS) 2020-2029
TABLE 208 REST OF MIDDLE EAST AND AFRICA MEDICAL EXOSKELETON MARKET BY EXTREMITY (THOUSAND UNITS) 2020-2029
TABLE 209 REST OF MIDDLE EAST AND AFRICA MEDICAL EXOSKELETON MARKET BY MOBILITY (USD MILLIONS) 2020-2029
TABLE 210 REST OF MIDDLE EAST AND AFRICA MEDICAL EXOSKELETON MARKET BY MOBILITY (THOUSAND UNITS) 2020-2029
LIST OF FIGURES
FIGURE 1 MARKET DYNAMICS
FIGURE 2 MARKET SEGMENTATION
FIGURE 3 REPORT TIMELINES: YEARS CONSIDERED
FIGURE 4 DATA TRIANGULATION
FIGURE 5 BOTTOM-UP APPROACH
FIGURE 6 TOP-DOWN APPROACH
FIGURE 7 RESEARCH FLOW
FIGURE 8 GLOBAL MEDICAL EXOSKELETON MARKET BY COMPONENT, USD MILLION, 2020-2029
FIGURE 9 GLOBAL MEDICAL EXOSKELETON MARKET BY TYPE, USD MILLION, 2020-2029
FIGURE 10 GLOBAL MEDICAL EXOSKELETON MARKET BY EXTREMITY, USD MILLION, 2020-2029
FIGURE 11 GLOBAL MEDICAL EXOSKELETON MARKET BY MOBILITY, USD MILLION, 2020-2029
FIGURE 12 GLOBAL MEDICAL EXOSKELETON MARKET BY REGION, USD MILLION, 2020-2029
FIGURE 13 PORTER’S FIVE FORCES MODEL
FIGURE 14 NORTH AMERICA MEDICAL EXOSKELETON MARKET SNAPSHOT
FIGURE 15 EUROPE MEDICAL EXOSKELETON MARKET SNAPSHOT
FIGURE 16 ASIA PACIFIC MEDICAL EXOSKELETON MARKET SNAPSHOT
FIGURE 17 SOUTH AMERICA MEDICAL EXOSKELETON MARKET SNAPSHOT
FIGURE 18 MIDDLE EAST & AFRICA MEDICAL EXOSKELETON MARKET SNAPSHOT
FIGURE 19 EKSO BIONICS HOLDINGS, INC.: COMPANY SNAPSHOT
FIGURE 20 REWALK ROBOTICS LTD.: COMPANY SNAPSHOT
FIGURE 21 PARKER HANNIFIN CORP: COMPANY SNAPSHOT
FIGURE 22 CYBERDYNE INC.: COMPANY SNAPSHOT
FIGURE 23 BIONIK LABORATORIES CORP: COMPANY SNAPSHOT
FIGURE 24 REX BIONICS LTD.: COMPANY SNAPSHOT
FIGURE 25 B-TEMIA INC.: COMPANY SNAPSHOT
FIGURE 26 HOCOMA AG: COMPANY SNAPSHOT
FIGURE 27 WEARABLE ROBOTICS SRL: COMPANY SNAPSHOT
FIGURE 28 GOGOA MOBILITY ROBOTS SL: COMPANY SNAPSHOT
FIGURE 29 EXOATLET: COMPANY SNAPSHOT
DOWNLOAD FREE SAMPLE REPORT
License Type
SPEAK WITH OUR ANALYST
Want to know more about the report or any specific requirement?
WANT TO CUSTOMIZE THE REPORT?
Our Clients Speak
We asked them to research ‘ Equipment market’ all over the world, and their whole arrangement was helpful to us. thehealthanalytics.com insightful analysis and reports contributed to our current analysis and in creating a future strategy. Besides, the te
Yosuke Mitsui
Senior Associate Construction Equipment Sales & Marketing
We asked them to research ‘Equipment market’ all over the world, and their whole arrangement was helpful to us. thehealthanalytics.com insightful analysis and reports contributed to our current analysis and in creating a future strategy. Besides, the te


