

Base Year Value ()
x.x %
x.x %
CAGR ()
x.x %
x.x %
Forecast Year Value ()
x.x %
x.x %
Historical Data Period
Largest Region
Forecast Period
Fiber Optics Market by Type (Glass, Plastic) Application (Telecommunication, Premises, Utility, CATV, Military, Industrial) Region (North America, Asia Pacific, Europe, South America, Middle East & Africa), Global Trends and Forecast from 2022 to 2029
Instant access to hundreds of data points and trends
- Market estimates from 2014-2029
- Competitive analysis, industry segmentation, financial benchmarks
- Incorporates SWOT, Porter's Five Forces and risk management frameworks
- PDF report or online database with Word, Excel and PowerPoint export options
- 100% money back guarantee
Fiber Optics Market Overview
The global fiber optics market is expected to grow at a 4.32% CAGR from 2022 to 2029. It is expected to reach above USD 6.1 billion by 2029 from USD 4.17 billion in 2020.
The rising demand for a dependable, high-speed, and scalable communication infrastructure network has resulted in the widespread use of optical fiber. It is ten times quicker than conventional cables and transports significantly more data than copper cables of the same diameter. Fiber to the Home (FTTH) deployments by AT&T Fiber and Verizon Fios, provide ultra-fast file uploads and can effortlessly transmit 4K films. Companies are always working to develop fiber network technologies in order to reduce optical distribution network (ODN) construction and operations and maintenance (O&M) expenses. These initiatives, as well as characteristics such as high bandwidth optical fiber communication, are projected to support new technologies such as the Internet of Things (IoT) and 5G.
The introduction of IoT and cloud computing has increased the demand for more bandwidth and improved connections in workplaces and commercial office buildings. Fiber optics is regarded as the optimum solution since it delivers a dependable and secure connection between IoT devices. IoT devices may be found at any point along the supply chain, including a jobsite, an assembly line, a factory, or a warehouse. The fiber network facilitates data transfer among devices, which aids in the processing of information. In settings where wireless networks are difficult to function, optical fiber components may be the best way of sending and managing data. For example, in the oil and gas business, optical fiber is used to sense and monitor massive volumes of data such as asset locations, temperature, and oil reserve levels, among other things. Because the data transferred through the fiber is in the form of a light beam, it replaces heavy equipment while saving space, weight, and logistical costs.
| ATTRIBUTE | DETAILS |
| Study period | 2020-2029 |
| Base year | 2021 |
| Estimated year | 2022 |
| Forecasted year | 2022-2029 |
| Historical period | 2018-2020 |
| Unit | USD Millions |
| Segmentation | By Type, Application |
| By Type
|
|
| By Application
|
|
| By Region
|
|
As a consequence, data transfer is simplified, security settings are improved, and product automation is achieved. Similarly, fiber connectivity is an excellent solution for cloud computing since it allows organizations to simplify their processes. Cloud computing is being adopted by an increasing number of businesses for data storage, customer relationship management (CRM) tools, and other business activities. The increased capacity and speed capabilities are the primary reasons for enterprises' widespread adoption of optical fiber. Because of its greater performance, limitless speed, and enhanced security, enterprises seeking cloud providers choose those that provide optic connectivity. As a result, the industry is leaning toward increased bandwidth and better connection in IoT and cloud computing.
The increasing preference for fiber optics in smart city projects will drive market growth. Interconnected and associated technologies play a vital role in developing and strengthening urban infrastructure by transmitting, recording, and transforming data into meaningful information. High-speed fiber connectivity aids in the transmission of huge amounts of data from one end to the other via communications infrastructure. It is important in autonomous drones for land surveying, surveillance systems for crime prevention, traffic management systems to prevent accidents or congestion, and smart buildings to promote sustainable living. For example, one of the communities in California, the United States, called 'Fullerton,' is on the verge of becoming the country's first fiber city. SiFi Networks, a provider of optical fiber networks, has been awarded the contract to construct an open-access network that would flow through every home and office in the city. Thus, the increasing usage of optical fiber is likely to transform smart cities while driving growth in the worldwide fiber optics market.
In 2020, many countries faced strict lockdowns due to the covid-19 pandemic. These lockdowns have resulted in the partial or complete shutdown of manufacturing facilities. The shutdown of manufacturing facilities had a major impact on the consumption of materials. This led to reduced transportation resulting in a slowing down of updating the railway system. However, with the ease of lockdown manufacturing sector is expected to return to its normal growth. The global fiber optics market is crowded with established players. These players have a commanding say in the market. The technology used in the fiber optics market is proprietary and needs long-term research and development planning implemented efficiently.
[caption id="attachment_10831" align="alignleft" width="870"]

Frequently Asked Questions
• What are the growth opportunities in fiber optics market, globally?
Increased Internet demand will have considerable market expansion.
• What is the CAGR of the fiber optics market?
The global fiber optics market registered a CAGR of 4.32% from 2022 to 2029.
• Which are the top companies to hold the market share in the fiber optics market?
Key players profiled in the report include Corning Incorporated, Prysmian Group, Finisar, AFL Global, Sumitomo Electric Industries Ltd, LS Cable & System, Leoni AG, Furukawa Electric Co. Ltd., General Cable Corporation, Sterlite Technologies Limited, Optical Cable Corporation.
• Which is the largest regional market for fiber optics market?
Asia Pacific holds the largest regional market for the fiber optics market.
• What are the key factors hampering the growth of the market?
The expansion of wireless communication networks will impede the growth of the fiber optics business.
Fiber Optics Market Segment Analysis
On the basis of type, the fiber optics market is divided into glass and plastic. Because of its rising demand from numerous applications, glass is the most common fiber type in fiber optics. The glass fiber optics industry is being driven by the excellent performance and ease of availability of glass fiber optics. Europe and North America are mature markets. Markets in APAC and the Middle East and Africa, are expanding due to high industrial expansion in these regions.
Based on application, the fiber optics market is segmented into telecommunication, premises, utility, CATV, military, and industrial. The fiber optics industry has been divided into two categories: communication (telecom, premises, utilities, CATV, military, and industrial) and non-communication (sensors and fiber optic lighting). According to estimates, the communication sector will be the largest application of the global fiber optic market.
The growing number of internet users is a primary driver of the fiber optics industry in the communication segment. Furthermore, expansion in the telecom, premises, utilities, and industrial sectors is propelling the fiber optic market. Furthermore, the enormous population bases of China and India are one of the primary drivers of development in the region's telecom sector, which is likely to boost the fiber optics market throughout the projection period.
[caption id="attachment_10832" align="alignleft" width="680"]
Fiber Optics Market Players
From large companies to small ones, many companies are actively working in the fiber optics market. These key players include Corning Incorporated, Prysmian Group, Finisar, AFL Global, Sumitomo Electric Industries Ltd, LS Cable & System, Leoni AG, Furukawa Electric Co. Ltd., General Cable Corporation, Sterlite Technologies Limited, Optical Cable Corporation, and others.
Companies are mainly in fiber optics they are competing closely with each other. Innovation is one of the most important key strategies as it has to be for any market. However, companies in the market have also opted for and successfully driven inorganic growth strategies like mergers & acquisitions, and so on.
- In March 2020, Allegiant Stadium in Las Vegas, Nevada, CommScope built over 1.5 million feet of copper wiring and 227 miles of fiber cables. This fiber optic cable is projected to enable high-bandwidth connectivity, giving Raiders fans with a genuinely fascinating and participatory experience.
- In March 2019, Microsoft Corporation and Facebook, Inc. announced cooperation on CoPackaged Optics (CPO) with the goal of guiding technology providers in the manufacture and design of CPO techniques.
Who Should Buy? Or Key Stakeholders
- Fiber Optics suppliers
- Investors
- End user companies
- Research institutes
Fiber Optics Market Regional Analysis
The fiber optics market by region includes Asia-Pacific (APAC), North America, Europe, Middle East & Africa (MEA), and South America.
- North America: includes the US, Canada, Mexico
- Asia Pacific: includes China, Japan, South Korea, India, Australia, ASEAN and Rest of APAC
- Europe: includes UK, Germany, France, Italy, Spain, Russia, and Rest of Europe
- South America: includes Brazil, Argentina and Rest of South America
- Middle East & Africa: includes Turkey, UAE, Saudi Arabia, South Africa, and the Rest of MEA
Its major share is occupied by Asia Pacific, North America, Middle East & Africa (MEA), and Europe. Asia Pacific shares 37% of the total market. The factors contributing to the region's market growth include the increasing number of fiber optics production plants and the rapid usage of fiber optics. The market in the region is expanding as a result of increased foreign investment due to low labor costs and the availability of raw resources.
[caption id="attachment_10833" align="alignleft" width="680"]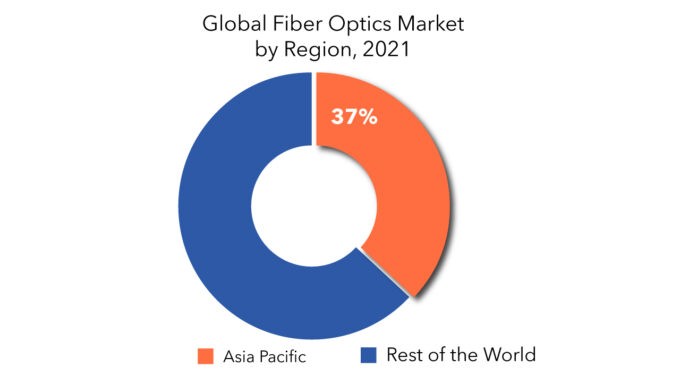
Key Market Segments: Fiber Optics Market
Fiber Optics Market by Type, 2020-2029, (USD Millions)- Glass
- Plastic
- Telecommunication
- Premises
- Utility
- CATV
- Military
- Industrial
- North America
- Europe
- Asia Pacific
- South America
- Middle East and Africa
Key Question Answered
- What is the worth of global fiber optics market?
- What are the new trends and advancements in the fiber optics market
- Which product categories are expected to have the highest growth rate in the fiber optics market?
- Which are the key factors driving the fiber optics market?
- What will the market growth rate, growth momentum, or acceleration the market carries during the forecast period?
- Introduction
- Market Definition
- Market Segmentation
- Research Timelines
- Assumptions and Limitations
- Research Methodology
- Data Mining
- Secondary Research
- Primary Research
- Subject-Matter Experts’ Advice
- Quality Checks
- Final Review
- Data Triangulation
- Bottom-Up Approach
- Top-Down Approach
- Research Flow
- Data Sources
- Data Mining
- Executive Summary
- Market Overview
- Global Fiber Optics Market Outlook
- Market Drivers
- Market Restraints
- Market Opportunities
- Impact of Covid-19 On Global Fiber Optics Market
- Global Fiber Optics Market Outlook
- Global Fiber Optics Market by Type, (USD Million)
- Glass
- Plastic
- Global Fiber Optics Market by Application, (USD Million)
- Glass
- Plastic
- Global Fiber Optics Market by Region, (USD Million)
- Introduction
- Asia-Pacific
- China
- India
- Japan
- South Korea
- Australia
- South-East Asia
- Rest of Asia-Pacific
- North America
- United States
- Canada
- Mexico
- Europe
- Germany
- United Kingdom
- France
- Italy
- Spain
- Russia
- Rest of Europe
- South America
- Brazil
- Argentina
- Colombia
- Rest of South America
- Middle East and Africa
- UAE
- Saudi Arabia
- South Africa
- Rest of Middle East and Africa
- Company Profiles* (Business Overview, Company Snapshot, Products Offered, Recent Developments)
8.1. Corning Incorporated
8.2. Prysmian Group
8.3. Finisar
8.4. AFL Global
8.5. Sumitomo Electric Industries Ltd
8.6. LS Cable & System
8.7. Leoni AG
8.8. Furukawa Electric Co. Ltd.
8.9. General Cable Corporation
8.10. Sterlite Technologies Limited
8.11. Optical Cable Corporation aa*The Company List Is Indicative
LIST OF TABLES
TABLE 1 GLOBAL FIBER OPTICS MARKET BY FABRIC MATERIAL (USD MILLIONS) 2020-2029
TABLE 2 GLOBAL FIBER OPTICS MARKET BY FILTER MEDIA (USD MILLIONS) 2020-2029
TABLE 3 GLOBAL FIBER OPTICS MARKET BY END USER (USD MILLIONS) 2020-2029
TABLE 4 GLOBAL FIBER OPTICS MARKET BY REGION (USD MILLIONS) 2020-2029
TABLE 5 US FIBER OPTICS MARKET BY FABRIC MATERIAL (USD MILLIONS) 2020-2029
TABLE 6 US FIBER OPTICS MARKET BY FILTER MEDIA (USD MILLIONS) 2020-2029
TABLE 7 US FIBER OPTICS MARKET BY END USER (USD MILLIONS) 2020-2029
TABLE 8 CANADA FIBER OPTICS MARKET BY FABRIC MATERIAL (USD MILLIONS) 2020-2029
TABLE 9 CANADA FIBER OPTICS MARKET BY FILTER MEDIA (USD MILLIONS) 2020-2029
TABLE 10 CANADA FIBER OPTICS MARKET BY END USER (USD MILLIONS) 2020-2029
TABLE 11 MEXICO FIBER OPTICS MARKET BY FABRIC MATERIAL (USD MILLIONS) 2020-2029
TABLE 12 MEXICO FIBER OPTICS MARKET BY FILTER MEDIA (USD MILLIONS) 2020-2029
TABLE 13 MEXICO FIBER OPTICS MARKET BY END USER (USD MILLIONS) 2020-2029
TABLE 14 BRAZIL FIBER OPTICS MARKET BY FABRIC MATERIAL (USD MILLIONS) 2020-2029
TABLE 15 BRAZIL FIBER OPTICS MARKET BY FILTER MEDIA (USD MILLIONS) 2020-2029
TABLE 16 BRAZIL FIBER OPTICS MARKET BY END USER (USD MILLIONS) 2020-2029
TABLE 17 ARGENTINA FIBER OPTICS MARKET BY FABRIC MATERIAL (USD MILLIONS) 2020-2029
TABLE 18 ARGENTINA FIBER OPTICS MARKET BY FILTER MEDIA (USD MILLIONS) 2020-2029
TABLE 19 ARGENTINA FIBER OPTICS MARKET BY END USER (USD MILLIONS) 2020-2029
TABLE 20 COLOMBIA FIBER OPTICS MARKET BY FABRIC MATERIAL (USD MILLIONS) 2020-2029
TABLE 21 COLOMBIA FIBER OPTICS MARKET BY FILTER MEDIA (USD MILLIONS) 2020-2029
TABLE 22 COLOMBIA FIBER OPTICS MARKET BY END USER (USD MILLIONS) 2020-2029
TABLE 23 REST OF SOUTH AMERICA FIBER OPTICS MARKET BY FABRIC MATERIAL (USD MILLIONS) 2020-2029
TABLE 24 REST OF SOUTH AMERICA FIBER OPTICS MARKET BY FILTER MEDIA (USD MILLIONS) 2020-2029
TABLE 25 REST OF SOUTH AMERICA FIBER OPTICS MARKET BY END USER (USD MILLIONS) 2020-2029
TABLE 26 INDIA FIBER OPTICS MARKET BY FABRIC MATERIAL (USD MILLIONS) 2020-2029
TABLE 27 INDIA FIBER OPTICS MARKET BY FILTER MEDIA (USD MILLIONS) 2020-2029
TABLE 28 INDIA FIBER OPTICS MARKET BY END USER (USD MILLIONS) 2020-2029
TABLE 29 CHINA FIBER OPTICS MARKET BY FABRIC MATERIAL (USD MILLIONS) 2020-2029
TABLE 30 CHINA FIBER OPTICS MARKET BY FILTER MEDIA (USD MILLIONS) 2020-2029
TABLE 31 CHINA FIBER OPTICS MARKET BY END USER (USD MILLIONS) 2020-2029
TABLE 32 JAPAN FIBER OPTICS MARKET BY FABRIC MATERIAL (USD MILLIONS) 2020-2029
TABLE 33 JAPAN FIBER OPTICS MARKET BY FILTER MEDIA (USD MILLIONS) 2020-2029
TABLE 34 JAPAN FIBER OPTICS MARKET BY END USER (USD MILLIONS) 2020-2029
TABLE 35 SOUTH KOREA FIBER OPTICS MARKET BY FABRIC MATERIAL (USD MILLIONS) 2020-2029
TABLE 36 SOUTH KOREA FIBER OPTICS MARKET BY FILTER MEDIA (USD MILLIONS) 2020-2029
TABLE 37 SOUTH KOREA FIBER OPTICS MARKET BY END USER (USD MILLIONS) 2020-2029
TABLE 38 AUSTRALIA FIBER OPTICS MARKET BY FABRIC MATERIAL (USD MILLIONS) 2020-2029
TABLE 39 AUSTRALIA FIBER OPTICS MARKET BY FILTER MEDIA (USD MILLIONS) 2020-2029
TABLE 40 AUSTRALIA FIBER OPTICS MARKET BY END USER (USD MILLIONS) 2020-2029
TABLE 41 SOUTH-EAST ASIA FIBER OPTICS MARKET BY FABRIC MATERIAL (USD MILLIONS) 2020-2029
TABLE 42 SOUTH-EAST ASIA FIBER OPTICS MARKET BY FILTER MEDIA (USD MILLIONS) 2020-2029
TABLE 43 SOUTH-EAST ASIA FIBER OPTICS MARKET BY END USER (USD MILLIONS) 2020-2029
TABLE 44 REST OF ASIA PACIFIC FIBER OPTICS MARKET BY FABRIC MATERIAL (USD MILLIONS) 2020-2029
TABLE 45 REST OF ASIA PACIFIC FIBER OPTICS MARKET BY FILTER MEDIA (USD MILLIONS) 2020-2029
TABLE 46 REST OF ASIA PACIFIC FIBER OPTICS MARKET BY END USER (USD MILLIONS) 2020-2029
TABLE 47 GERMANY FIBER OPTICS MARKET BY FABRIC MATERIAL (USD MILLIONS) 2020-2029
TABLE 48 GERMANY FIBER OPTICS MARKET BY FILTER MEDIA (USD MILLIONS) 2020-2029
TABLE 49 GERMANY FIBER OPTICS MARKET BY END USER (USD MILLIONS) 2020-2029
TABLE 50 UK FIBER OPTICS MARKET BY FABRIC MATERIAL (USD MILLIONS) 2020-2029
TABLE 51 UK FIBER OPTICS MARKET BY FILTER MEDIA (USD MILLIONS) 2020-2029
TABLE 52 UK FIBER OPTICS MARKET BY END USER (USD MILLIONS) 2020-2029
TABLE 53 FRANCE FIBER OPTICS MARKET BY FABRIC MATERIAL (USD MILLIONS) 2020-2029
TABLE 54 FRANCE FIBER OPTICS MARKET BY FILTER MEDIA (USD MILLIONS) 2020-2029
TABLE 55 FRANCE FIBER OPTICS MARKET BY END USER (USD MILLIONS) 2020-2029
TABLE 56 ITALY FIBER OPTICS MARKET BY FABRIC MATERIAL (USD MILLIONS) 2020-2029
TABLE 57 ITALY FIBER OPTICS MARKET BY FILTER MEDIA (USD MILLIONS) 2020-2029
TABLE 58 ITALY FIBER OPTICS MARKET BY END USER (USD MILLIONS) 2020-2029
TABLE 59 SPAIN FIBER OPTICS MARKET BY FABRIC MATERIAL (USD MILLIONS) 2020-2029
TABLE 60 SPAIN FIBER OPTICS MARKET BY FILTER MEDIA (USD MILLIONS) 2020-2029
TABLE 61 SPAIN FIBER OPTICS MARKET BY END USER (USD MILLIONS) 2020-2029
TABLE 62 RUSSIA FIBER OPTICS MARKET BY FABRIC MATERIAL (USD MILLIONS) 2020-2029
TABLE 63 RUSSIA FIBER OPTICS MARKET BY FILTER MEDIA (USD MILLIONS) 2020-2029
TABLE 64 RUSSIA FIBER OPTICS MARKET BY END USER (USD MILLIONS) 2020-2029
TABLE 65 REST OF EUROPE FIBER OPTICS MARKET BY FABRIC MATERIAL (USD MILLIONS) 2020-2029
TABLE 66 REST OF EUROPE FIBER OPTICS MARKET BY FILTER MEDIA (USD MILLIONS) 2020-2029
TABLE 67 REST OF EUROPE FIBER OPTICS MARKET BY END USER (USD MILLIONS) 2020-2029
TABLE 68 UAE FIBER OPTICS MARKET BY FABRIC MATERIAL (USD MILLIONS) 2020-2029
TABLE 69 UAE FIBER OPTICS MARKET BY FILTER MEDIA (USD MILLIONS) 2020-2029
TABLE 70 UAE FIBER OPTICS MARKET BY END USER (USD MILLIONS) 2020-2029
TABLE 71 SAUDI ARABIA FIBER OPTICS MARKET BY FABRIC MATERIAL (USD MILLIONS) 2020-2029
TABLE 72 SAUDI ARABIA FIBER OPTICS MARKET BY FILTER MEDIA (USD MILLIONS) 2020-2029
TABLE 73 SAUDI ARABIA FIBER OPTICS MARKET BY END USER (USD MILLIONS) 2020-2029
TABLE 74 SOUTH AFRICA FIBER OPTICS MARKET BY FABRIC MATERIAL (USD MILLIONS) 2020-2029
TABLE 75 SOUTH AFRICA FIBER OPTICS MARKET BY FILTER MEDIA (USD MILLIONS) 2020-2029
TABLE 76 SOUTH AFRICA FIBER OPTICS MARKET BY END USER (USD MILLIONS) 2020-2029
TABLE 77 REST OF MIDDLE EAST AND AFRICA FIBER OPTICS MARKET BY FABRIC MATERIAL (USD MILLIONS) 2020-2029
TABLE 78 REST OF MIDDLE EAST AND AFRICA FIBER OPTICS MARKET BY FILTER MEDIA (USD MILLIONS) 2020-2029
TABLE 79 REST OF MIDDLE EAST AND AFRICA FIBER OPTICS MARKET BY END USER (USD MILLIONS) 2020-2029
LIST OF FIGURES
FIGURE 1 MARKET DYNAMICS
FIGURE 2 MARKET SEGMENTATION
FIGURE 3 REPORT TIMELINES: YEARS CONSIDERED
FIGURE 4 DATA TRIANGULATION
FIGURE 5 BOTTOM-UP APPROACH
FIGURE 6 TOP-DOWN APPROACH
FIGURE 7 RESEARCH FLOW
FIGURE 8 GLOBAL FIBER OPTICS MARKET BY TYPE, USD MILLION, 2020-2029
FIGURE 9 GLOBAL FIBER OPTICS MARKET BY APPLICATION, USD MILLION, 2020-2029
FIGURE 10 GLOBAL FIBER OPTICS MARKET BY REGION, USD MILLION, 2020-2029
FIGURE 11 PORTER’S FIVE FORCES MODEL
FIGURE 12 FIBER OPTICS MARKET BY REGION 2020
FIGURE 13 MARKET SHARE ANALYSIS
FIGURE 14 CORNING INCORPORATED: COMPANY SNAPSHOT
FIGURE 15 PRYSMIAN GROUP: COMPANY SNAPSHOT
FIGURE 16 FINISAR: COMPANY SNAPSHOT
FIGURE 17 AFL GLOBAL: COMPANY SNAPSHOT
FIGURE 18 SUMITOMO ELECTRIC INDUSTRIES LTD: COMPANY SNAPSHOT
FIGURE 19 LS CABLE & SYSTEM: COMPANY SNAPSHOT
FIGURE 20 LEONI AG: COMPANY SNAPSHOT
FIGURE 21 FURUKAWA ELECTRIC CO. LTD.: COMPANY SNAPSHOT
FIGURE 22 GENERAL CABLE CORPORATION: COMPANY SNAPSHOT
FIGURE 23 STERLITE TECHNOLOGIES LIMITED: COMPANY SNAPSHOT
FIGURE 24 OPTICAL CABLE CORPORATION: COMPANY SNAPSHOT
DOWNLOAD FREE SAMPLE REPORT
License Type
SPEAK WITH OUR ANALYST
Want to know more about the report or any specific requirement?
WANT TO CUSTOMIZE THE REPORT?
Our Clients Speak
We asked them to research ‘ Equipment market’ all over the world, and their whole arrangement was helpful to us. thehealthanalytics.com insightful analysis and reports contributed to our current analysis and in creating a future strategy. Besides, the te
Yosuke Mitsui
Senior Associate Construction Equipment Sales & Marketing
We asked them to research ‘Equipment market’ all over the world, and their whole arrangement was helpful to us. thehealthanalytics.com insightful analysis and reports contributed to our current analysis and in creating a future strategy. Besides, the te


