

Base Year Value ()
x.x %
x.x %
CAGR ()
x.x %
x.x %
Forecast Year Value ()
x.x %
x.x %
Historical Data Period
Largest Region
Forecast Period
Augmented Reality Head-Up Display (AR HUD) Market by Type (Close Projection, Far Projection), Application (Premium Car, Luxury Car, Others), and Region (North America, Asia Pacific, Europe, South America, Middle East, and Africa) Global trends and forecast from 2023 to 2029
Instant access to hundreds of data points and trends
- Market estimates from 2014-2029
- Competitive analysis, industry segmentation, financial benchmarks
- Incorporates SWOT, Porter's Five Forces and risk management frameworks
- PDF report or online database with Word, Excel and PowerPoint export options
- 100% money back guarantee
Augmented Reality Head-Up Display (AR HUD) Market Overview
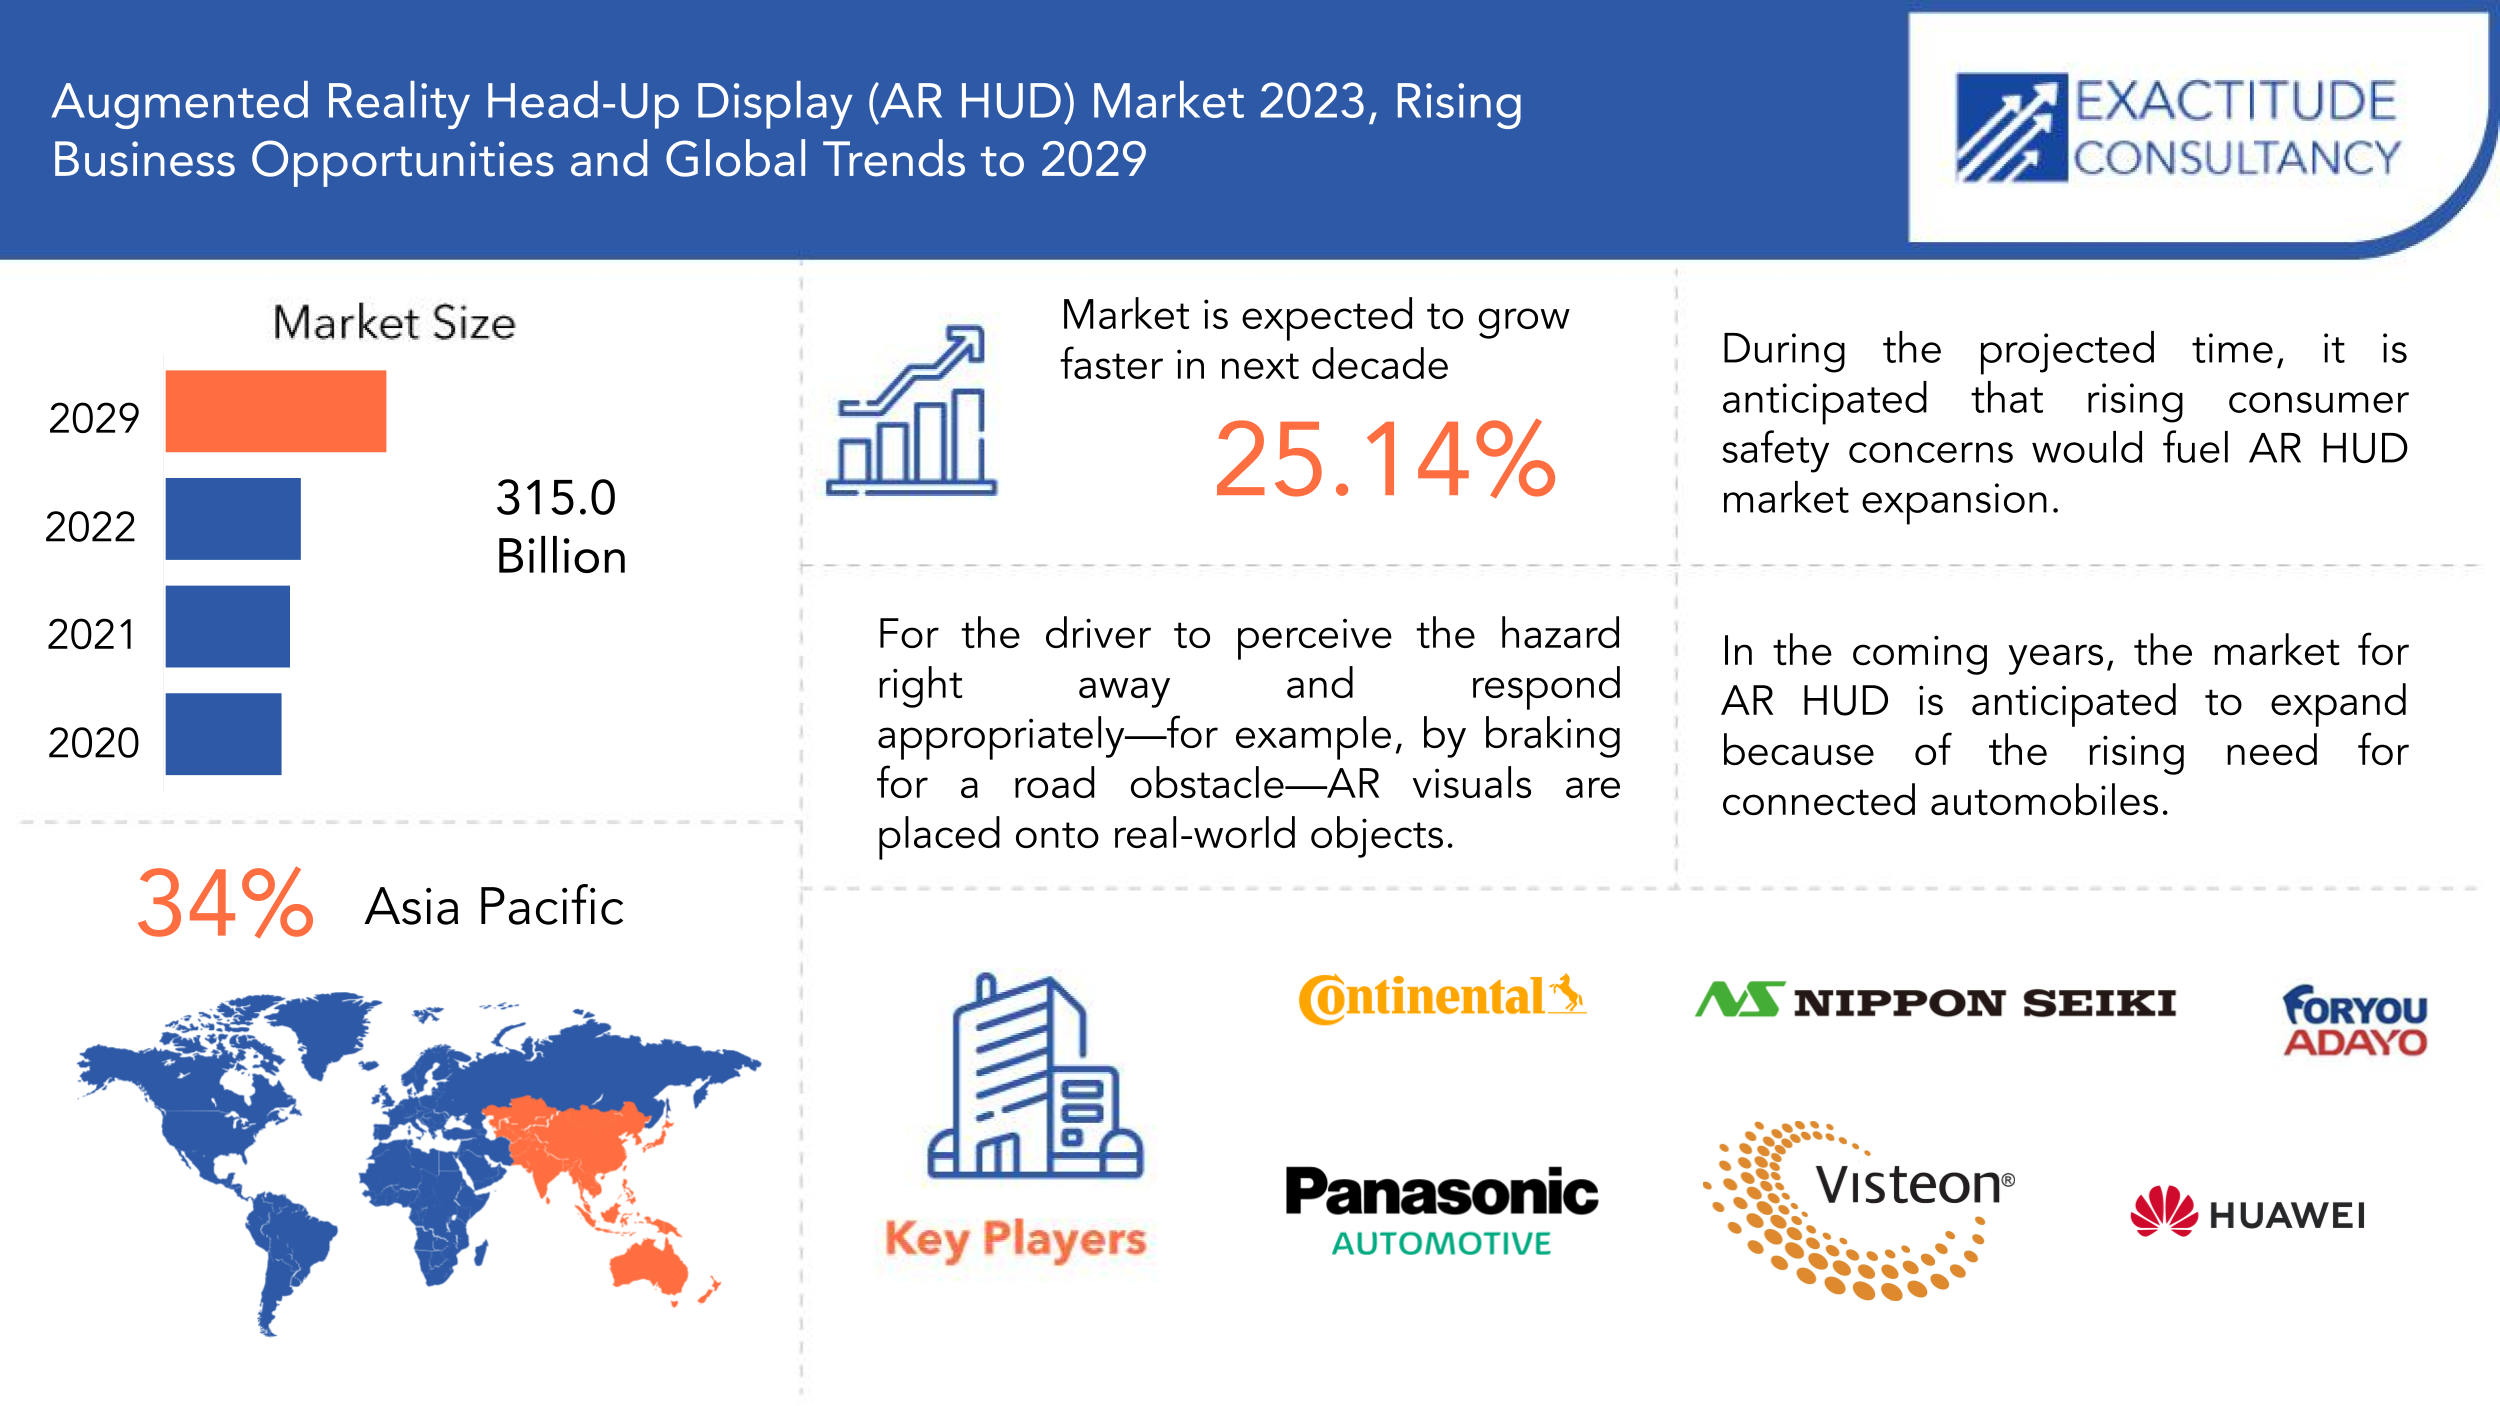
The global Augmented Reality Head Up Display (AR HUD) Market is expected to grow at 25.14 % CAGR from 2023 to 2029. It is expected to reach above USD 315.0 billion by 2029 from USD 2.81 billion in 2022.
A heads-up display (HUD) is a computer-enhanced display that shows information, data, or other visual elements in front of the user's primary point of view. Visual data can be viewed on a transparent glass screen using HUD imaging, or display technology, without the need for head/neck movement or scrolling.
AR HUD design is a particular type of projection device that uses optical projection technology to project ADAS information, navigation, speed limits, automobile speed, and traffic warnings into the fields of view of drivers in commercial vehicles, trucks, and affordable vehicles. Drivers can shift their focus away from their dashboards and onto the road in front of them, which encourages them to maintain their attention on road safety rather than bending over to look at their cars' dashboards. Augmented Reality Head-Up Displays are used mostly in the automotive sector such as premium cars and luxury cars.
| ATTRIBUTE | DETAILS |
| Study period | 2023-2029 |
| Base year | 2022 |
| Estimated year | 2023 |
| Forecasted year | 2023-2029 |
| Historical period | 2018-2022 |
| Unit | Value (USD Billion), (Thousand Units) |
| Segmentation | By Type, By Application, By Region |
| By Type
|
|
| By Application
|
|
| By Region
|
|
Augmented Reality Head-Up Display (AR HUD) provides variable benefits it enables a sufficient field of view overlay AR content, it provides virtual image distance (VID) at infinity or multiple distances, and it also provides a flat design a reduces spaces requirement.
During the projected time, it is anticipated that rising consumer safety concerns would fuel AR HUD market expansion. For the driver to perceive the hazard right away and respond appropriately—for example, by braking for a road obstacle—AR visuals are placed onto real-world objects. The market is being driven by the potential for this method of ADAS signal presentation to significantly improve driver situational awareness, particularly when driving at night or in poor visibility.
In the coming years, the market for AR HUD is anticipated to expand because of the rising need for connected automobiles. The car has higher comfort, convenience, and entertainment features compared to those found in passenger cars. The amount of time spent in cars has increased as a result of traffic jams, which has also increased demand for linked and in-car entertainment systems. HUDS for augmented reality is a crucial component of connected automobiles. Consumers can enjoy audio and visual entertainment through infotainment systems in connected cars, which also improve the driving experience by providing convenience and safety features.
Due to difficult driving circumstances brought on by an increase in both the population and the number of vehicles on the road throughout the projected period, the AR head-up display market is anticipated to develop. Additionally, the increased safety that head-up displays provide propels industry expansion. In addition, it is predicted that developments in augmented reality technology will completely transform the head-up display industry. In light of these elements, it is predicted that the AR HUD market would expand rapidly shortly.
[caption id="attachment_12949" align="aligncenter" width="870"]
 Augmented Reality Head-Up Display (AR HUD) Market | Exactitude Consultancy[/caption]
Frequently Asked Questions
• What is the worth of the global Augmented Reality Head Up Display (AR HUD) Market?
The global Augmented Reality Head Up Display (AR HUD) Market is expected to grow at 25.14 % CAGR from 2023 to 2029. It is expected to reach above USD 315.0 billion by 2029 from USD 2.81 billion in 2022.
• What are some of the market's driving forces?
Increasing incidence of road accidents and high demand for 3D AR head-up displays, rising awareness about Augmented Reality Head-Up Displays (AR HUD), Industrialization, and rising inclination towards autonomous are some driving forces in the market.
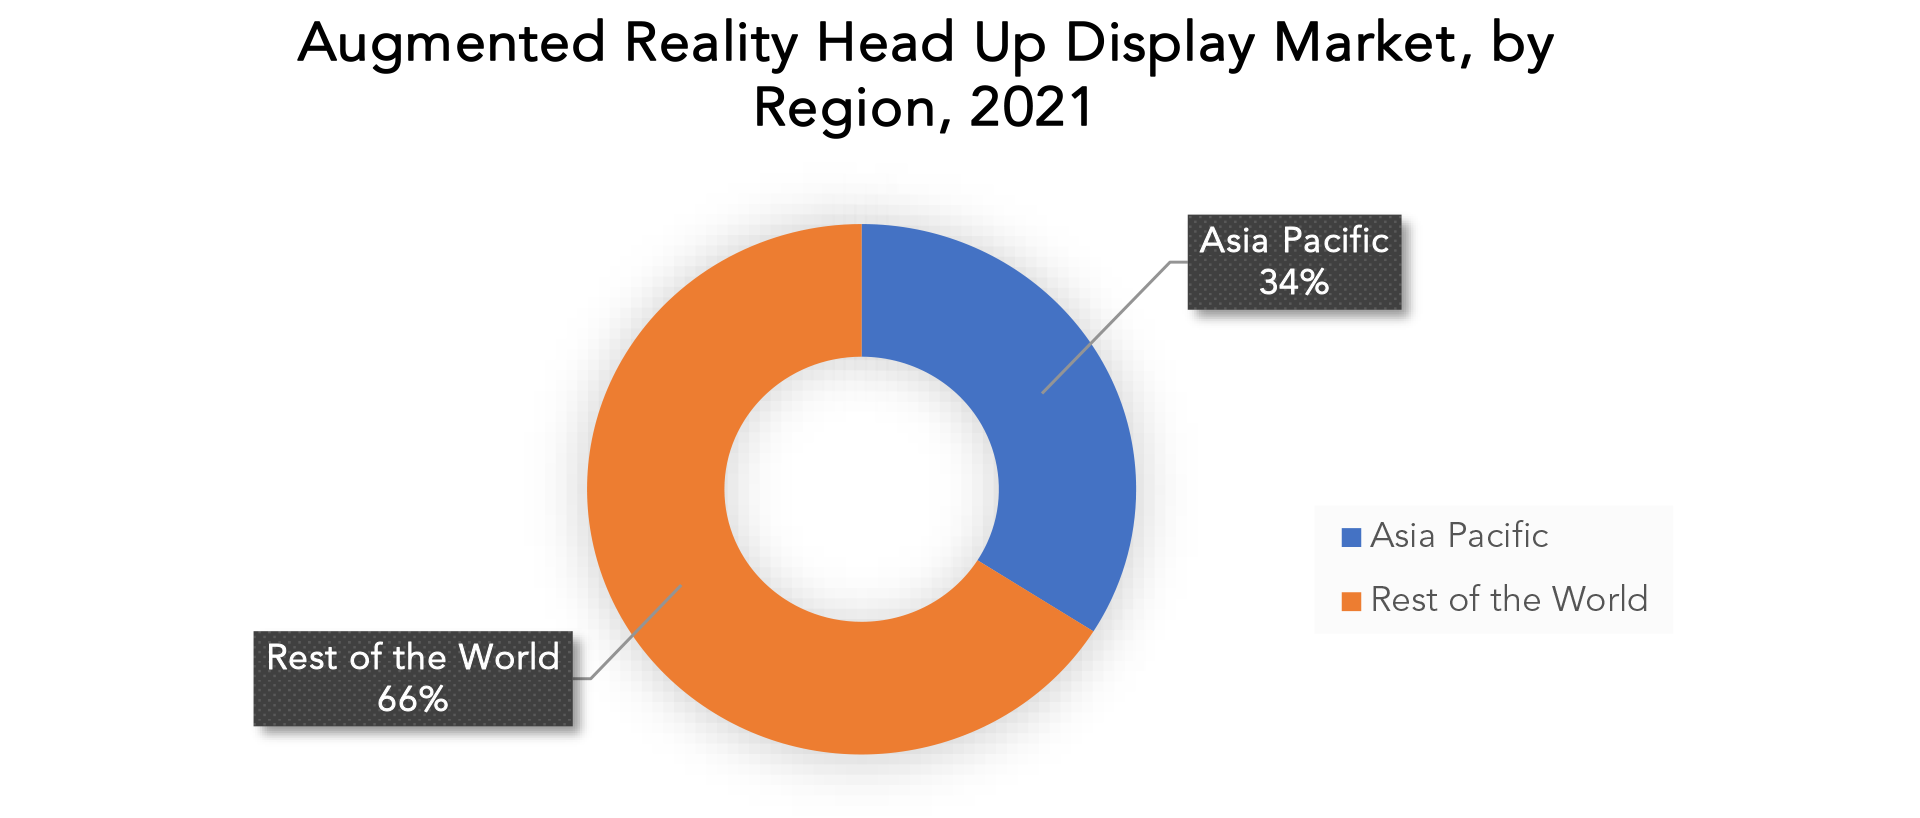
• Which is the largest regional market for Augmented Reality Head Up Display (AR HUD) Market?
Asia Pacific accounted for the largest market in the Augmented Reality Head Up Display (AR HUD) Market. Asia Pacific accounts for 34 % of the share across the globe.
• Which segment is dominating the market?
Based on type Close projection is dominating in the market. Due to the rising frequency of traffic accidents, the focus on enhancing driver and passenger comfort, and the growing use of close projectors for sharper and clearer visuals, the close projection market is anticipated to grow steadily over the forecast period.
Augmented Reality Head-Up Display (AR HUD) Market Segment Analysis
The global augmented reality head-up display (AR HUD) market is segmented based on type, application, and region. By type, the market is bifurcated into Close Projection and Far Projection. By application, the market is bifurcated into Premium Cars, Luxury Car, and Others. Based on type Close projection is dominating in the market. Concerns over passenger and vehicle safety are growing among car buyers. Regulatory organizations throughout the world work to enhance vehicle safety. The Global Status Report on Road Safety 2018 estimates that more than 1.35 million people worldwide lose their lives in traffic accidents every year. By 2030, studies predict that traffic-related injuries will rank as the sixth leading cause of death worldwide. Driver distraction is one of the main factors contributing to these collisions. The National Center for Statistics and Analysis (NCSA) estimates that every day in collisions involving a distracted driver in the United States, about 9 people die, and more than 1,000 are injured. Due to the rising frequency of traffic accidents, the focus on enhancing driver and passenger comfort, and the growing use of close projectors for sharper and clearer visuals, the close projection market is anticipated to grow steadily over the forecast period. Based on the application Premium cars segment is dominating the market. Due to the rising demand for top-end premium cars among the majority of middle-class consumers, rising disposable income, and the availability of AR HUD in premium cars with a variety of features, the premium car segment is anticipated to account for a significantly larger revenue share during the forecast period. [caption id="attachment_14147" align="aligncenter" width="1920"]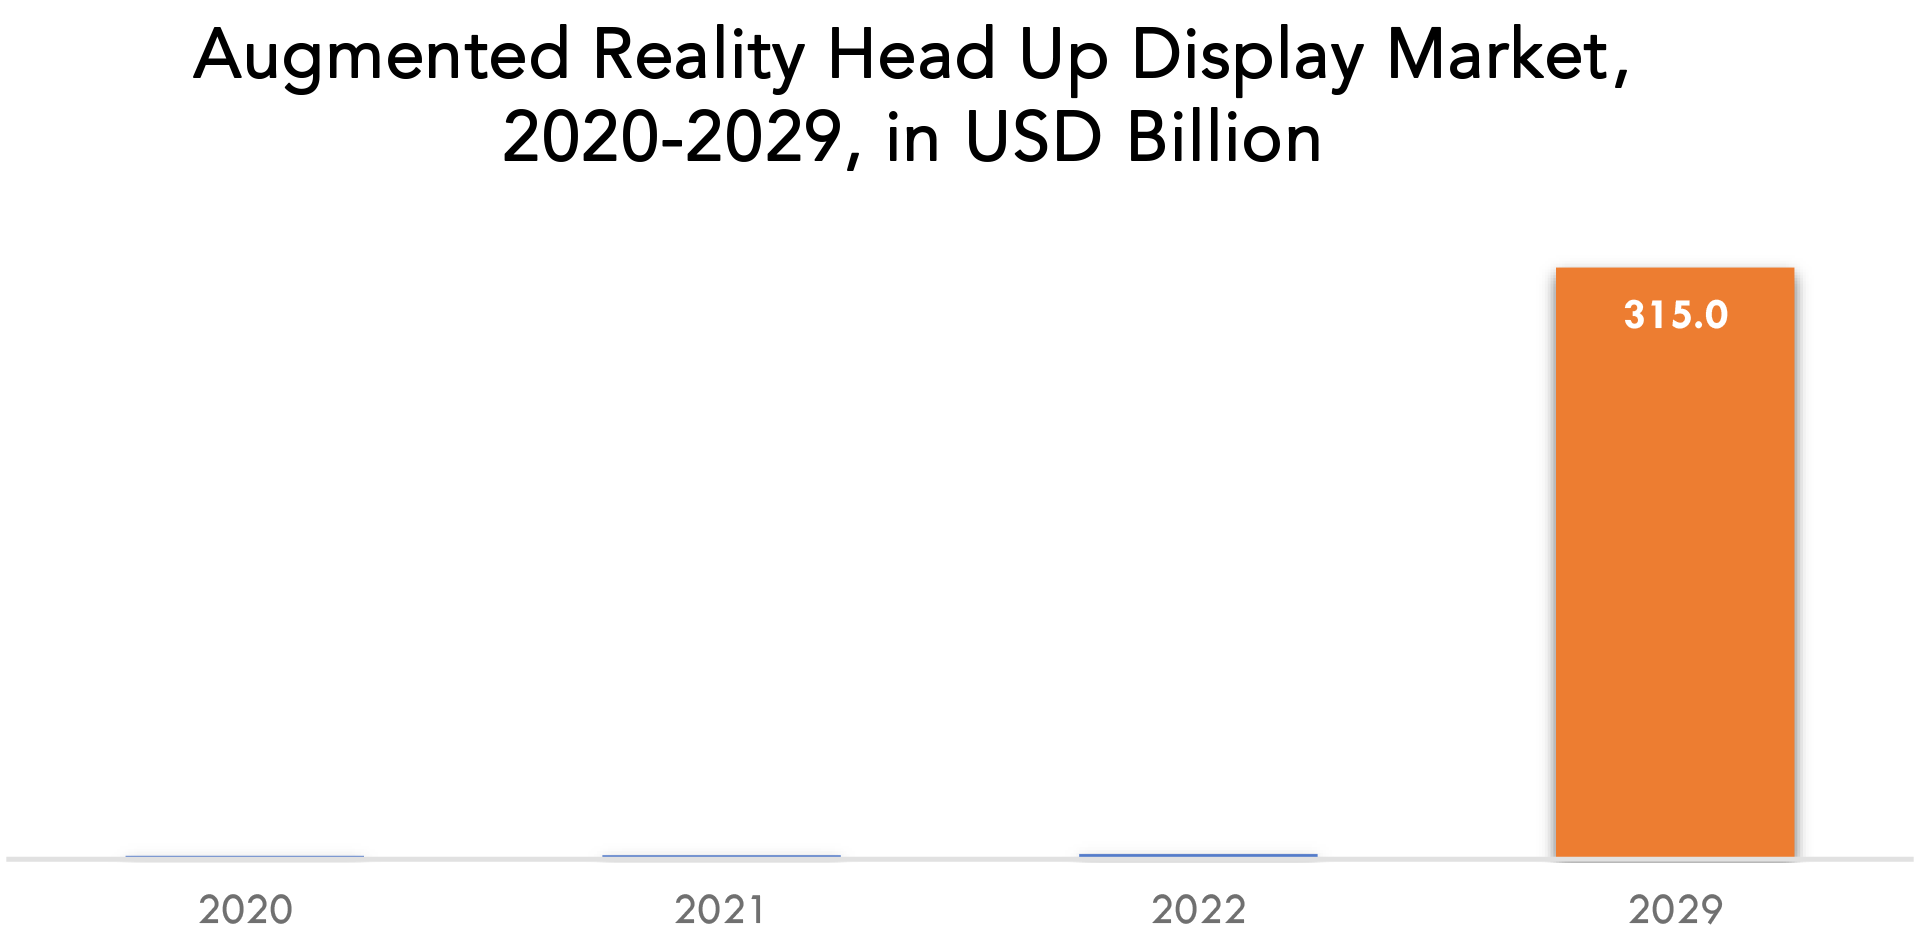
Augmented Reality Head-Up Display (AR HUD) Market Players
There are several small, medium, and major companies in the industry, and they are dispersed throughout all the regions. The Augmented Reality Head-Up Display (AR HUD) Market key players include Continental AG, Panasonic Automotive, Nippon Seiki, Visteon Corporation, Huawei, Foryou Corporation, Crystal Optech, New Vision Electronics, Shenzhen Ray thinks, Futurus, Shenzhen 3-dragons Technology, Beijing Carrobot, Shenzhen Jiangcheng Technology, Shanghai Year Technology, Shinex Electronic. Recent Developments January 04, 2022 Panasonic Automotive Unveils Driveable AR HUD 2.0 with Patented Eye-Tracking-System at CES 2022 LAS VEGAS —CES 2022 Panasonic Automotive Systems Company of America, a tier one automotive supplier, unveiled their Augmented Reality HUD (AR HUD) 2.0, the first to include a new patented eye tracking system (ETS) enhancing the AR experience. October 10, 2018. The technology company Continental reveals an industry-first full-color demonstrator of an automotive-specific Head-up Display (HUD) based on waveguide technology. This demonstrator is the result of the joint development with DigiLens Inc., one of the leading experts in projection technology enabled by switchable holographic gratings.Who Should Buy? Or Key stakeholders
- Automotive Industry
- Manufacturing Industry
- IT Industry
- Research Organizations
- Aviation Industry
- Investors
- Government Organizations
- Others
Augmented Reality Head-Up Display (AR HUD) Market Regional Analysis
The Augmented Reality Head Up Display (AR HUD) Market by region includes North America, Asia-Pacific (APAC), Europe, South America, and Middle East & Africa (MEA).- North America: includes the US, Canada, Mexico
- Asia Pacific: includes China, Japan, South Korea, India, Australia, ASEAN, and Rest of APAC
- Europe: includes UK, Germany, France, Italy, Spain, Russia, and the Rest of Europe
- South America: includes Brazil, Argentina and Rest of South America
- Middle East & Africa: includes Turkey, UAE, Saudi Arabia, South Africa, and Rest of MEA
Key Market Segments: Augmented Reality Head-Up Display (AR HUD) Market
Augmented Reality Head-Up Display (AR HUD) Market By Type, 2022-2029, (USD Billion), (Thousand Units)- Close Projection
- Far Projection
- Premium Cars
- Luxury Cars
- Others
- North America
- Asia Pacific
- Europe
- South America
- Middle East And Africa
[video width="1920" height="1080" mp4="https://gwsdigital.com/exactitudeconsultancy/wp-content/uploads/2023/03/Augmented-Reality-Head-Up-Display.mp4" poster="https://gwsdigital.com/exactitudeconsultancy/wp-content/uploads/2022/02/exactitude-1-3.jpg"][/video]
Key Question Answered
- What is the current size of the Augmented Reality Head Up Display (AR HUD) Market?
- What are the key factors influencing the growth of the Augmented Reality Head Up Display (AR HUD) Market?
- What are the major applications for Augmented Reality Head Up Display (AR HUD) Market?
- Who are the major key players in the Augmented Reality Head Up Display (AR HUD) Market?
- Which region will provide more business opportunities for Augmented Reality Head Up Display (AR HUD) Market in the future?
- Which segment holds the maximum share of the Augmented Reality Head Up Display (AR HUD) Market?
- INTRODUCTION
- MARKET DEFINITION
- MARKET SEGMENTATION
- RESEARCH TIMELINES
- ASSUMPTIONS AND LIMITATIONS
- RESEARCH METHODOLOGY
- DATA MINING
- SECONDARY RESEARCH
- PRIMARY RESEARCH
- SUBJECT-MATTER EXPERTS’ ADVICE
- QUALITY CHECKS
- FINAL REVIEW
- DATA TRIANGULATION
- BOTTOM-UP APPROACH
- TOP-DOWN APPROACH
- RESEARCH FLOW
- DATA SOURCES
- DATA MINING
- EXECUTIVE SUMMARY
- MARKET OVERVIEW
- GLOBAL AUGMENTED REALITY HEAD-UP DISPLAY MARKET OUTLOOK
- MARKET DRIVERS
- MARKET RESTRAINTS
- MARKET OPPORTUNITIES
- IMPACT OF COVID-19 ON AUGMENTED REALITY HEAD-UP DISPLAY MARKET
- PORTER’S FIVE FORCES MODEL
- THREAT FROM NEW ENTRANTS
- THREAT FROM SUBSTITUTES
- BARGAINING POWER OF SUPPLIERS
- BARGAINING POWER OF CUSTOMERS
- DEGREE OF COMPETITION
- INDUSTRY VALUE CHAIN ANALYSIS
- GLOBAL AUGMENTED REALITY HEAD-UP DISPLAY MARKET OUTLOOK
- GLOBAL AUGMENTED REALITY HEAD-UP DISPLAY MARKET BY TYPE, 2022-2029, (USD BILLION), (THOUSAND UNITS)
- CLOSE PROJECTION
- FAR PROJECTION
- GLOBAL AUGMENTED REALITY HEAD-UP DISPLAY MARKET BY APPLICATION, 2022-2029, (USD BILLION), (THOUSAND UNITS)
- PREMIUM CARS
- LUXURY CARS
- OTHERS
- GLOBAL AUGMENTED REALITY HEAD-UP DISPLAY MARKET BY REGION, 2022-2029, (USD BILLION), (THOUSAND UNITS)
- NORTH AMERICA
- US
- CANADA
- MEXICO
- SOUTH AMERICA
- BRAZIL
- ARGENTINA
- COLOMBIA
- REST OF SOUTH AMERICA
- EUROPE
- GERMANY
- UK
- FRANCE
- ITALY
- SPAIN
- RUSSIA
- REST OF EUROPE
- ASIA PACIFIC
- INDIA
- CHINA
- JAPAN
- SOUTH KOREA
- AUSTRALIA
- SOUTH-EAST ASIA
- REST OF ASIA PACIFIC
- MIDDLE EAST AND AFRICA
- UAE
- SAUDI ARABIA
- SOUTH AFRICA
- REST OF MIDDLE EAST AND AFRICA
- NORTH AMERICA
- COMPANY PROFILES* (BUSINESS OVERVIEW, COMPANY SNAPSHOT, PRODUCTS OFFERED, RECENT DEVELOPMENTS)
8.1. CONTINENTAL AG
8.2. PANASONIC AUTOMOTIVE
8.3. NIPPON SEIKI
8.4. VISTEON CORPORATION
8.5. HUAWEI
8.6. FORYOU CORPORATION
8.7. CRYSTAL OPTECH
8.8. NEW VISION ELECTRONICS,
8.9. SHENZHEN RAY THINK TECHNOLOGY
8.10. SHANGHAI YEAR TECHNOLOGY *THE COMPANY LIST IS INDICATIVE
LIST OF TABLES
TABLE 1 GLOBAL AUGMENTED REALITY HEAD-UP DISPLAY MARKET BY TYPE (USD BILLION) 2022-2029
TABLE 2 GLOBAL AUGMENTED REALITY HEAD-UP DISPLAY MARKET BY TYPE (THOUSAND UNITS) 2022-2029
TABLE 3 GLOBAL AUGMENTED REALITY HEAD-UP DISPLAY MARKET BY APPLICATION (USD BILLION) 2022-2029
TABLE 4 GLOBAL AUGMENTED REALITY HEAD-UP DISPLAY MARKET BY APPLICATION (THOUSAND UNITS) 2022-2029
TABLE 5 GLOBAL AUGMENTED REALITY HEAD-UP DISPLAY MARKET BY REGION (USD BILLION) 2022-2029
TABLE 6 GLOBAL AUGMENTED REALITY HEAD-UP DISPLAY MARKET BY REGION (THOUSAND UNITS) 2022-2029
TABLE 7 NORTH AMERICA AUGMENTED REALITY HEAD-UP DISPLAY MARKET BY COUNTRY (USD BILLION) 2022-2029
TABLE 8 NORTH AMERICA AUGMENTED REALITY HEAD-UP DISPLAY MARKET BY COUNTRY (THOUSAND UNITS) 2022-2029
TABLE 9 NORTH AMERICA AUGMENTED REALITY HEAD-UP DISPLAY MARKET BY TYPE (USD BILLION) 2022-2029
TABLE 10 NORTH AMERICA AUGMENTED REALITY HEAD-UP DISPLAY MARKET BY TYPE (THOUSAND UNITS) 2022-2029
TABLE 11 NORTH AMERICA AUGMENTED REALITY HEAD-UP DISPLAY MARKET BY APPLICATION (USD BILLION) 2022-2029
TABLE 12 NORTH AMERICA AUGMENTED REALITY HEAD-UP DISPLAY MARKET BY APPLICATION (THOUSAND UNITS) 2022-2029
TABLE 13 US AUGMENTED REALITY HEAD-UP DISPLAY MARKET BY TYPE (USD BILLION) 2022-2029
TABLE 14 US AUGMENTED REALITY HEAD-UP DISPLAY MARKET BY TYPE (THOUSAND UNITS) 2022-2029
TABLE 15 US AUGMENTED REALITY HEAD-UP DISPLAY MARKET BY APPLICATION (USD BILLION) 2022-2029
TABLE 16 US AUGMENTED REALITY HEAD-UP DISPLAY MARKET BY APPLICATION (THOUSAND UNITS) 2022-2029
TABLE 17 CANADA AUGMENTED REALITY HEAD-UP DISPLAY MARKET BY TYPE (USD BILLION) 2022-2029
TABLE 18 CANADA AUGMENTED REALITY HEAD-UP DISPLAY MARKET BY TYPE (THOUSAND UNITS) 2022-2029
TABLE 19 CANADA AUGMENTED REALITY HEAD-UP DISPLAY MARKET BY APPLICATION (USD BILLION) 2022-2029
TABLE 20 CANADA AUGMENTED REALITY HEAD-UP DISPLAY MARKET BY APPLICATION (THOUSAND UNITS) 2022-2029
TABLE 21 MEXICO AUGMENTED REALITY HEAD-UP DISPLAY MARKET BY TYPE (USD BILLION) 2022-2029
TABLE 22 MEXICO AUGMENTED REALITY HEAD-UP DISPLAY MARKET BY TYPE (THOUSAND UNITS) 2022-2029
TABLE 23 MEXICO AUGMENTED REALITY HEAD-UP DISPLAY MARKET BY APPLICATION (USD BILLION) 2022-2029
TABLE 24 MEXICO AUGMENTED REALITY HEAD-UP DISPLAY MARKET BY APPLICATION (THOUSAND UNITS) 2022-2029
TABLE 25 SOUTH AMERICA AUGMENTED REALITY HEAD-UP DISPLAY MARKET BY COUNTRY (USD BILLION) 2022-2029
TABLE 26 SOUTH AMERICA AUGMENTED REALITY HEAD-UP DISPLAY MARKET BY COUNTRY (THOUSAND UNITS) 2022-2029
TABLE 27 SOUTH AMERICA AUGMENTED REALITY HEAD-UP DISPLAY MARKET BY TYPE (USD BILLION) 2022-2029
TABLE 28 SOUTH AMERICA AUGMENTED REALITY HEAD-UP DISPLAY MARKET BY TYPE (THOUSAND UNITS) 2022-2029
TABLE 29 SOUTH AMERICA AUGMENTED REALITY HEAD-UP DISPLAY MARKET BY APPLICATION (USD BILLION) 2022-2029
TABLE 30 SOUTH AMERICA AUGMENTED REALITY HEAD-UP DISPLAY MARKET BY APPLICATION (THOUSAND UNITS) 2022-2029
TABLE 31 BRAZIL AUGMENTED REALITY HEAD-UP DISPLAY MARKET BY TYPE (USD BILLION) 2022-2029
TABLE 32 BRAZIL AUGMENTED REALITY HEAD-UP DISPLAY MARKET BY TYPE (THOUSAND UNITS) 2022-2029
TABLE 33 BRAZIL AUGMENTED REALITY HEAD-UP DISPLAY MARKET BY APPLICATION (USD BILLION) 2022-2029
TABLE 34 BRAZIL AUGMENTED REALITY HEAD-UP DISPLAY MARKET BY APPLICATION (THOUSAND UNITS) 2022-2029
TABLE 35 ARGENTINA AUGMENTED REALITY HEAD-UP DISPLAY MARKET BY TYPE (USD BILLION) 2022-2029
TABLE 36 ARGENTINA AUGMENTED REALITY HEAD-UP DISPLAY MARKET BY TYPE (THOUSAND UNITS) 2022-2029
TABLE 37 ARGENTINA AUGMENTED REALITY HEAD-UP DISPLAY MARKET BY APPLICATION (USD BILLION) 2022-2029
TABLE 38 ARGENTINA AUGMENTED REALITY HEAD-UP DISPLAY MARKET BY APPLICATION (THOUSAND UNITS) 2022-2029
TABLE 39 COLOMBIA AUGMENTED REALITY HEAD-UP DISPLAY MARKET BY TYPE (USD BILLION) 2022-2029
TABLE 40 COLOMBIA AUGMENTED REALITY HEAD-UP DISPLAY MARKET BY TYPE (THOUSAND UNITS) 2022-2029
TABLE 41 COLOMBIA AUGMENTED REALITY HEAD-UP DISPLAY MARKET BY APPLICATION (USD BILLION) 2022-2029
TABLE 42 COLOMBIA AUGMENTED REALITY HEAD-UP DISPLAY MARKET BY APPLICATION (THOUSAND UNITS) 2022-2029
TABLE 43 REST OF SOUTH AMERICA AUGMENTED REALITY HEAD-UP DISPLAY MARKET BY TYPE (USD BILLION) 2022-2029
TABLE 44 REST OF SOUTH AMERICA AUGMENTED REALITY HEAD-UP DISPLAY MARKET BY TYPE (THOUSAND UNITS) 2022-2029
TABLE 45 REST OF SOUTH AMERICA AUGMENTED REALITY HEAD-UP DISPLAY MARKET BY APPLICATION (USD BILLION) 2022-2029
TABLE 46 REST OF SOUTH AMERICA AUGMENTED REALITY HEAD-UP DISPLAY MARKET BY APPLICATION (THOUSAND UNITS) 2022-2029
TABLE 47 ASIA-PACIFIC AUGMENTED REALITY HEAD-UP DISPLAY MARKET BY COUNTRY (USD BILLION) 2022-2029
TABLE 48 ASIA-PACIFIC AUGMENTED REALITY HEAD-UP DISPLAY MARKET BY COUNTRY (THOUSAND UNITS) 2022-2029
TABLE 49 ASIA-PACIFIC AUGMENTED REALITY HEAD-UP DISPLAY MARKET BY TYPE (USD BILLION) 2022-2029
TABLE 50 ASIA-PACIFIC AUGMENTED REALITY HEAD-UP DISPLAY MARKET BY TYPE (THOUSAND UNITS) 2022-2029
TABLE 51 ASIA-PACIFIC AUGMENTED REALITY HEAD-UP DISPLAY MARKET BY APPLICATION (USD BILLION) 2022-2029
TABLE 52 ASIA-PACIFIC AUGMENTED REALITY HEAD-UP DISPLAY MARKET BY APPLICATION (THOUSAND UNITS) 2022-2029
TABLE 53 INDIA AUGMENTED REALITY HEAD-UP DISPLAY MARKET BY TYPE (USD BILLION) 2022-2029
TABLE 54 INDIA AUGMENTED REALITY HEAD-UP DISPLAY MARKET BY TYPE (THOUSAND UNITS) 2022-2029
TABLE 55 INDIA AUGMENTED REALITY HEAD-UP DISPLAY MARKET BY APPLICATION (USD BILLION) 2022-2029
TABLE 56 INDIA AUGMENTED REALITY HEAD-UP DISPLAY MARKET BY APPLICATION (THOUSAND UNITS) 2022-2029
TABLE 57 CHINA AUGMENTED REALITY HEAD-UP DISPLAY MARKET BY TYPE (USD BILLION) 2022-2029
TABLE 58 CHINA AUGMENTED REALITY HEAD-UP DISPLAY MARKET BY TYPE (THOUSAND UNITS) 2022-2029
TABLE 59 CHINA AUGMENTED REALITY HEAD-UP DISPLAY MARKET BY APPLICATION (USD BILLION) 2022-2029
TABLE 60 CHINA AUGMENTED REALITY HEAD-UP DISPLAY MARKET BY APPLICATION (THOUSAND UNITS) 2022-2029
TABLE 61 JAPAN AUGMENTED REALITY HEAD-UP DISPLAY MARKET BY TYPE (USD BILLION) 2022-2029
TABLE 62 JAPAN AUGMENTED REALITY HEAD-UP DISPLAY MARKET BY TYPE (THOUSAND UNITS) 2022-2029
TABLE 63 JAPAN AUGMENTED REALITY HEAD-UP DISPLAY MARKET BY APPLICATION (USD BILLION) 2022-2029
TABLE 64 JAPAN AUGMENTED REALITY HEAD-UP DISPLAY MARKET BY APPLICATION (THOUSAND UNITS) 2022-2029
TABLE 65 SOUTH KOREA AUGMENTED REALITY HEAD-UP DISPLAY MARKET BY TYPE (USD BILLION) 2022-2029
TABLE 66 SOUTH KOREA AUGMENTED REALITY HEAD-UP DISPLAY MARKET BY TYPE (THOUSAND UNITS) 2022-2029
TABLE 67 SOUTH KOREA AUGMENTED REALITY HEAD-UP DISPLAY MARKET BY APPLICATION (USD BILLION) 2022-2029
TABLE 68 SOUTH KOREA AUGMENTED REALITY HEAD-UP DISPLAY MARKET BY APPLICATION (THOUSAND UNITS) 2022-2029
TABLE 69 AUSTRALIA AUGMENTED REALITY HEAD-UP DISPLAY MARKET BY TYPE (USD BILLION) 2022-2029
TABLE 70 AUSTRALIA AUGMENTED REALITY HEAD-UP DISPLAY MARKET BY TYPE (THOUSAND UNITS) 2022-2029
TABLE 71 AUSTRALIA AUGMENTED REALITY HEAD-UP DISPLAY MARKET BY APPLICATION (USD BILLION) 2022-2029
TABLE 72 AUSTRALIA AUGMENTED REALITY HEAD-UP DISPLAY MARKET BY APPLICATION (THOUSAND UNITS) 2022-2029
TABLE 73 SOUTH-EAST ASIA AUGMENTED REALITY HEAD-UP DISPLAY MARKET BY TYPE (USD BILLION) 2022-2029
TABLE 74 SOUTH-EAST ASIA AUGMENTED REALITY HEAD-UP DISPLAY MARKET BY TYPE (THOUSAND UNITS) 2022-2029
TABLE 75 SOUTH-EAST ASIA AUGMENTED REALITY HEAD-UP DISPLAY MARKET BY APPLICATION (USD BILLION) 2022-2029
TABLE 76 SOUTH-EAST ASIA AUGMENTED REALITY HEAD-UP DISPLAY MARKET BY APPLICATION (THOUSAND UNITS) 2022-2029
TABLE 77 REST OF ASIA PACIFIC AUGMENTED REALITY HEAD-UP DISPLAY MARKET BY TYPE (USD BILLION) 2022-2029
TABLE 78 REST OF ASIA PACIFIC AUGMENTED REALITY HEAD-UP DISPLAY MARKET BY TYPE (THOUSAND UNITS) 2022-2029
TABLE 79 REST OF ASIA PACIFIC AUGMENTED REALITY HEAD-UP DISPLAY MARKET BY APPLICATION (USD BILLION) 2022-2029
TABLE 80 REST OF ASIA PACIFIC AUGMENTED REALITY HEAD-UP DISPLAY MARKET BY APPLICATION (THOUSAND UNITS) 2022-2029
TABLE 81 EUROPE AUGMENTED REALITY HEAD-UP DISPLAY MARKET BY COUNTRY (USD BILLION) 2022-2029
TABLE 82 EUROPE AUGMENTED REALITY HEAD-UP DISPLAY MARKET BY COUNTRY (THOUSAND UNITS) 2022-2029
TABLE 83 ASIA-PACIFIC AUGMENTED REALITY HEAD-UP DISPLAY MARKET BY TYPE (USD BILLION) 2022-2029
TABLE 84 ASIA-PACIFIC AUGMENTED REALITY HEAD-UP DISPLAY MARKET BY TYPE (THOUSAND UNITS) 2022-2029
TABLE 85 ASIA-PACIFIC AUGMENTED REALITY HEAD-UP DISPLAY MARKET BY APPLICATION (USD BILLION) 2022-2029
TABLE 86 ASIA-PACIFIC AUGMENTED REALITY HEAD-UP DISPLAY MARKET BY APPLICATION (THOUSAND UNITS) 2022-2029
TABLE 87 GERMANY AUGMENTED REALITY HEAD-UP DISPLAY MARKET BY TYPE (USD BILLION) 2022-2029
TABLE 88 GERMANY AUGMENTED REALITY HEAD-UP DISPLAY MARKET BY TYPE (THOUSAND UNITS) 2022-2029
TABLE 89 GERMANY AUGMENTED REALITY HEAD-UP DISPLAY MARKET BY APPLICATION (USD BILLION) 2022-2029
TABLE 90 GERMANY AUGMENTED REALITY HEAD-UP DISPLAY MARKET BY APPLICATION (THOUSAND UNITS) 2022-2029
TABLE 91 UK AUGMENTED REALITY HEAD-UP DISPLAY MARKET BY TYPE (USD BILLION) 2022-2029
TABLE 92 UK AUGMENTED REALITY HEAD-UP DISPLAY MARKET BY TYPE (THOUSAND UNITS) 2022-2029
TABLE 93 UK AUGMENTED REALITY HEAD-UP DISPLAY MARKET BY APPLICATION (USD BILLION) 2022-2029
TABLE 94 UK AUGMENTED REALITY HEAD-UP DISPLAY MARKET BY APPLICATION (THOUSAND UNITS) 2022-2029
TABLE 95 FRANCE AUGMENTED REALITY HEAD-UP DISPLAY MARKET BY TYPE (USD BILLION) 2022-2029
TABLE 96 FRANCE AUGMENTED REALITY HEAD-UP DISPLAY MARKET BY TYPE (THOUSAND UNITS) 2022-2029
TABLE 97 FRANCE AUGMENTED REALITY HEAD-UP DISPLAY MARKET BY APPLICATION (USD BILLION) 2022-2029
TABLE 98 FRANCE AUGMENTED REALITY HEAD-UP DISPLAY MARKET BY APPLICATION (THOUSAND UNITS) 2022-2029
TABLE 99 ITALY AUGMENTED REALITY HEAD-UP DISPLAY MARKET BY TYPE (USD BILLION) 2022-2029
TABLE 100 ITALY AUGMENTED REALITY HEAD-UP DISPLAY MARKET BY TYPE (THOUSAND UNITS) 2022-2029
TABLE 101 ITALY AUGMENTED REALITY HEAD-UP DISPLAY MARKET BY APPLICATION (USD BILLION) 2022-2029
TABLE 102 ITALY AUGMENTED REALITY HEAD-UP DISPLAY MARKET BY APPLICATION (THOUSAND UNITS) 2022-2029
TABLE 103 SPAIN AUGMENTED REALITY HEAD-UP DISPLAY MARKET BY TYPE (USD BILLION) 2022-2029
TABLE 104 SPAIN AUGMENTED REALITY HEAD-UP DISPLAY MARKET BY TYPE (THOUSAND UNITS) 2022-2029
TABLE 105 SPAIN AUGMENTED REALITY HEAD-UP DISPLAY MARKET BY APPLICATION (USD BILLION) 2022-2029
TABLE 106 SPAIN AUGMENTED REALITY HEAD-UP DISPLAY MARKET BY APPLICATION (THOUSAND UNITS) 2022-2029
TABLE 107 RUSSIA AUGMENTED REALITY HEAD-UP DISPLAY MARKET BY TYPE (USD BILLION) 2022-2029
TABLE 108 RUSSIA AUGMENTED REALITY HEAD-UP DISPLAY MARKET BY TYPE (THOUSAND UNITS) 2022-2029
TABLE 109 RUSSIA AUGMENTED REALITY HEAD-UP DISPLAY MARKET BY APPLICATION (USD BILLION) 2022-2029
TABLE 110 RUSSIA AUGMENTED REALITY HEAD-UP DISPLAY MARKET BY APPLICATION (THOUSAND UNITS) 2022-2029
TABLE 111 REST OF EUROPE AUGMENTED REALITY HEAD-UP DISPLAY MARKET BY TYPE (USD BILLION) 2022-2029
TABLE 112 REST OF EUROPE AUGMENTED REALITY HEAD-UP DISPLAY MARKET BY TYPE (THOUSAND UNITS) 2022-2029
TABLE 113 REST OF EUROPE AUGMENTED REALITY HEAD-UP DISPLAY MARKET BY APPLICATION (USD BILLION) 2022-2029
TABLE 114 REST OF EUROPE AUGMENTED REALITY HEAD-UP DISPLAY MARKET BY APPLICATION (THOUSAND UNITS) 2022-2029
TABLE 115 MIDDLE EAST AND AFRICA AUGMENTED REALITY HEAD-UP DISPLAY MARKET BY COUNTRY (USD BILLION) 2022-2029
TABLE 116 MIDDLE EAST AND AFRICA AUGMENTED REALITY HEAD-UP DISPLAY MARKET BY COUNTRY (THOUSAND UNITS) 2022-2029
TABLE 117 MIDDLE EAST AND AFRICA AUGMENTED REALITY HEAD-UP DISPLAY MARKET BY TYPE (USD BILLION) 2022-2029
TABLE 118 MIDDLE EAST AND AFRICA AUGMENTED REALITY HEAD-UP DISPLAY MARKET BY TYPE (THOUSAND UNITS) 2022-2029
TABLE 119 MIDDLE EAST AND AFRICA AUGMENTED REALITY HEAD-UP DISPLAY MARKET BY APPLICATION (USD BILLION) 2022-2029
TABLE 120 MIDDLE EAST AND AFRICA AUGMENTED REALITY HEAD-UP DISPLAY MARKET BY APPLICATION (THOUSAND UNITS) 2022-2029
TABLE 121 UAE AUGMENTED REALITY HEAD-UP DISPLAY MARKET BY TYPE (USD BILLION) 2022-2029
TABLE 122 UAE AUGMENTED REALITY HEAD-UP DISPLAY MARKET BY TYPE (THOUSAND UNITS) 2022-2029
TABLE 123 UAE AUGMENTED REALITY HEAD-UP DISPLAY MARKET BY APPLICATION (USD BILLION) 2022-2029
TABLE 124 UAE AUGMENTED REALITY HEAD-UP DISPLAY MARKET BY APPLICATION (THOUSAND UNITS) 2022-2029
TABLE 125 SAUDI ARABIA AUGMENTED REALITY HEAD-UP DISPLAY MARKET BY TYPE (USD BILLION) 2022-2029
TABLE 126 SAUDI ARABIA AUGMENTED REALITY HEAD-UP DISPLAY MARKET BY TYPE (THOUSAND UNITS) 2022-2029
TABLE 127 SAUDI ARABIA AUGMENTED REALITY HEAD-UP DISPLAY MARKET BY APPLICATION (USD BILLION) 2022-2029
TABLE 128 SAUDI ARABIA AUGMENTED REALITY HEAD-UP DISPLAY MARKET BY APPLICATION (THOUSAND UNITS) 2022-2029
TABLE 129 SOUTH AFRICA AUGMENTED REALITY HEAD-UP DISPLAY MARKET BY TYPE (USD BILLION) 2022-2029
TABLE 130 SOUTH AFRICA AUGMENTED REALITY HEAD-UP DISPLAY MARKET BY TYPE (THOUSAND UNITS) 2022-2029
TABLE 131 SOUTH AFRICA AUGMENTED REALITY HEAD-UP DISPLAY MARKET BY APPLICATION (USD BILLION) 2022-2029
TABLE 132 SOUTH AFRICA AUGMENTED REALITY HEAD-UP DISPLAY MARKET BY APPLICATION (THOUSAND UNITS) 2022-2029
TABLE 133 REST OF MIDDLE EAST AND AFRICA AUGMENTED REALITY HEAD-UP DISPLAY MARKET BY TYPE (USD BILLION) 2022-2029
TABLE 134 REST OF MIDDLE EAST AND AFRICA AUGMENTED REALITY HEAD-UP DISPLAY MARKET BY TYPE (THOUSAND UNITS) 2022-2029
TABLE 135 REST OF MIDDLE EAST AND AFRICA AUGMENTED REALITY HEAD-UP DISPLAY MARKET BY APPLICATION (USD BILLION) 2022-2029
TABLE 136 REST OF MIDDLE EAST AND AFRICA AUGMENTED REALITY HEAD-UP DISPLAY MARKET BY APPLICATION (THOUSAND UNITS) 2022-2029
LIST OF FIGURES
FIGURE 1 MARKET DYNAMICS
FIGURE 2 MARKET SEGMENTATION
FIGURE 3 REPORT TIMELINES: YEARS CONSIDERED
FIGURE 4 DATA TRIANGULATION
FIGURE 5 BOTTOM-UP APPROACH
FIGURE 6 TOP-DOWN APPROACH
FIGURE 7 RESEARCH FLOW
FIGURE 8 GLOBAL AUGMENTED REALITY HEAD-UP DISPLAY MARKET BY COMPONENT, USD BILLION, 2022-2029
FIGURE 9 GLOBAL AUGMENTED REALITY HEAD-UP DISPLAY MARKET BY APPLICATION, USD BILLION, 2022-2029
FIGURE 10 GLOBAL AUGMENTED REALITY HEAD-UP DISPLAY MARKET BY REGION, USD BILLION, 2022-2029
FIGURE 11 PORTER’S FIVE FORCES MODEL
FIGURE 13 GLOBAL AUGMENTED REALITY HEAD-UP DISPLAY MARKET BY COMPONENT, USD BILLION, 2021
FIGURE 14 GLOBAL AUGMENTED REALITY HEAD-UP DISPLAY MARKET BY APPLICATION, USD BILLION, 2021
FIGURE 15 GLOBAL AUGMENTED REALITY HEAD-UP DISPLAY MARKET BY REGION, USD BILLION, 2021
FIGURE 16 NORTH AMERICA AUGMENTED REALITY HEAD-UP DISPLAY MARKET SNAPSHOT
FIGURE 17 EUROPE AUGMENTED REALITY HEAD-UP DISPLAY MARKET SNAPSHOT
FIGURE 18 SOUTH AMERICA AUGMENTED REALITY HEAD-UP DISPLAY MARKET SNAPSHOT
FIGURE 19 ASIA PACIFIC AUGMENTED REALITY HEAD-UP DISPLAY MARKET SNAPSHOT
FIGURE 20 MIDDLE EAST ASIA AND AFRICA AUGMENTED REALITY HEAD-UP DISPLAY MARKET SNAPSHOT
FIGURE 21 MARKET SHARE ANALYSIS
FIGURE 22 CONTINENTAL AG: COMPANY SNAPSHOT
FIGURE 23 PANASONIC AUTOMOTIVE: COMPANY SNAPSHOT
FIGURE 24 NIPPON SEIKI: COMPANY SNAPSHOT
FIGURE 25 VISTEON CORPORATION: COMPANY SNAPSHOT
FIGURE 26 HUAWEI: COMPANY SNAPSHOT
FIGURE 27 CRYSTAL OPTECH: COMPANY SNAPSHOT
FIGURE 28 NEW VISION ELECTRONICS: COMPANY SNAPSHOT
FIGURE 29 SHENZHEN RAY THINK: COMPANY SNAPSHOT
FIGURE 30 FUTURUS: COMPANY SNAPSHOT
FIGURE 31 SHENZHEN 3-DRAGONS TECHNOLOGY: COMPANY SNAPSHOT
DOWNLOAD FREE SAMPLE REPORT
License Type
SPEAK WITH OUR ANALYST
Want to know more about the report or any specific requirement?
WANT TO CUSTOMIZE THE REPORT?
Our Clients Speak
We asked them to research ‘ Equipment market’ all over the world, and their whole arrangement was helpful to us. thehealthanalytics.com insightful analysis and reports contributed to our current analysis and in creating a future strategy. Besides, the te
Yosuke Mitsui
Senior Associate Construction Equipment Sales & Marketing
We asked them to research ‘Equipment market’ all over the world, and their whole arrangement was helpful to us. thehealthanalytics.com insightful analysis and reports contributed to our current analysis and in creating a future strategy. Besides, the te


