

Base Year Value ()
x.x %
x.x %
CAGR ()
x.x %
x.x %
Forecast Year Value ()
x.x %
x.x %
Historical Data Period
Largest Region
Forecast Period
DC High Power Charger Market by Power Output (10 KW to 100 KW, Less Than 10 KW, and More Than 100 KW), by Application (Industrial, Automotive, and Consumer Electronics) and Region, Global trends and forecast from 2023 to 2029
Instant access to hundreds of data points and trends
- Market estimates from 2014-2029
- Competitive analysis, industry segmentation, financial benchmarks
- Incorporates SWOT, Porter's Five Forces and risk management frameworks
- PDF report or online database with Word, Excel and PowerPoint export options
- 100% money back guarantee
DC High Power Charger Market Overview
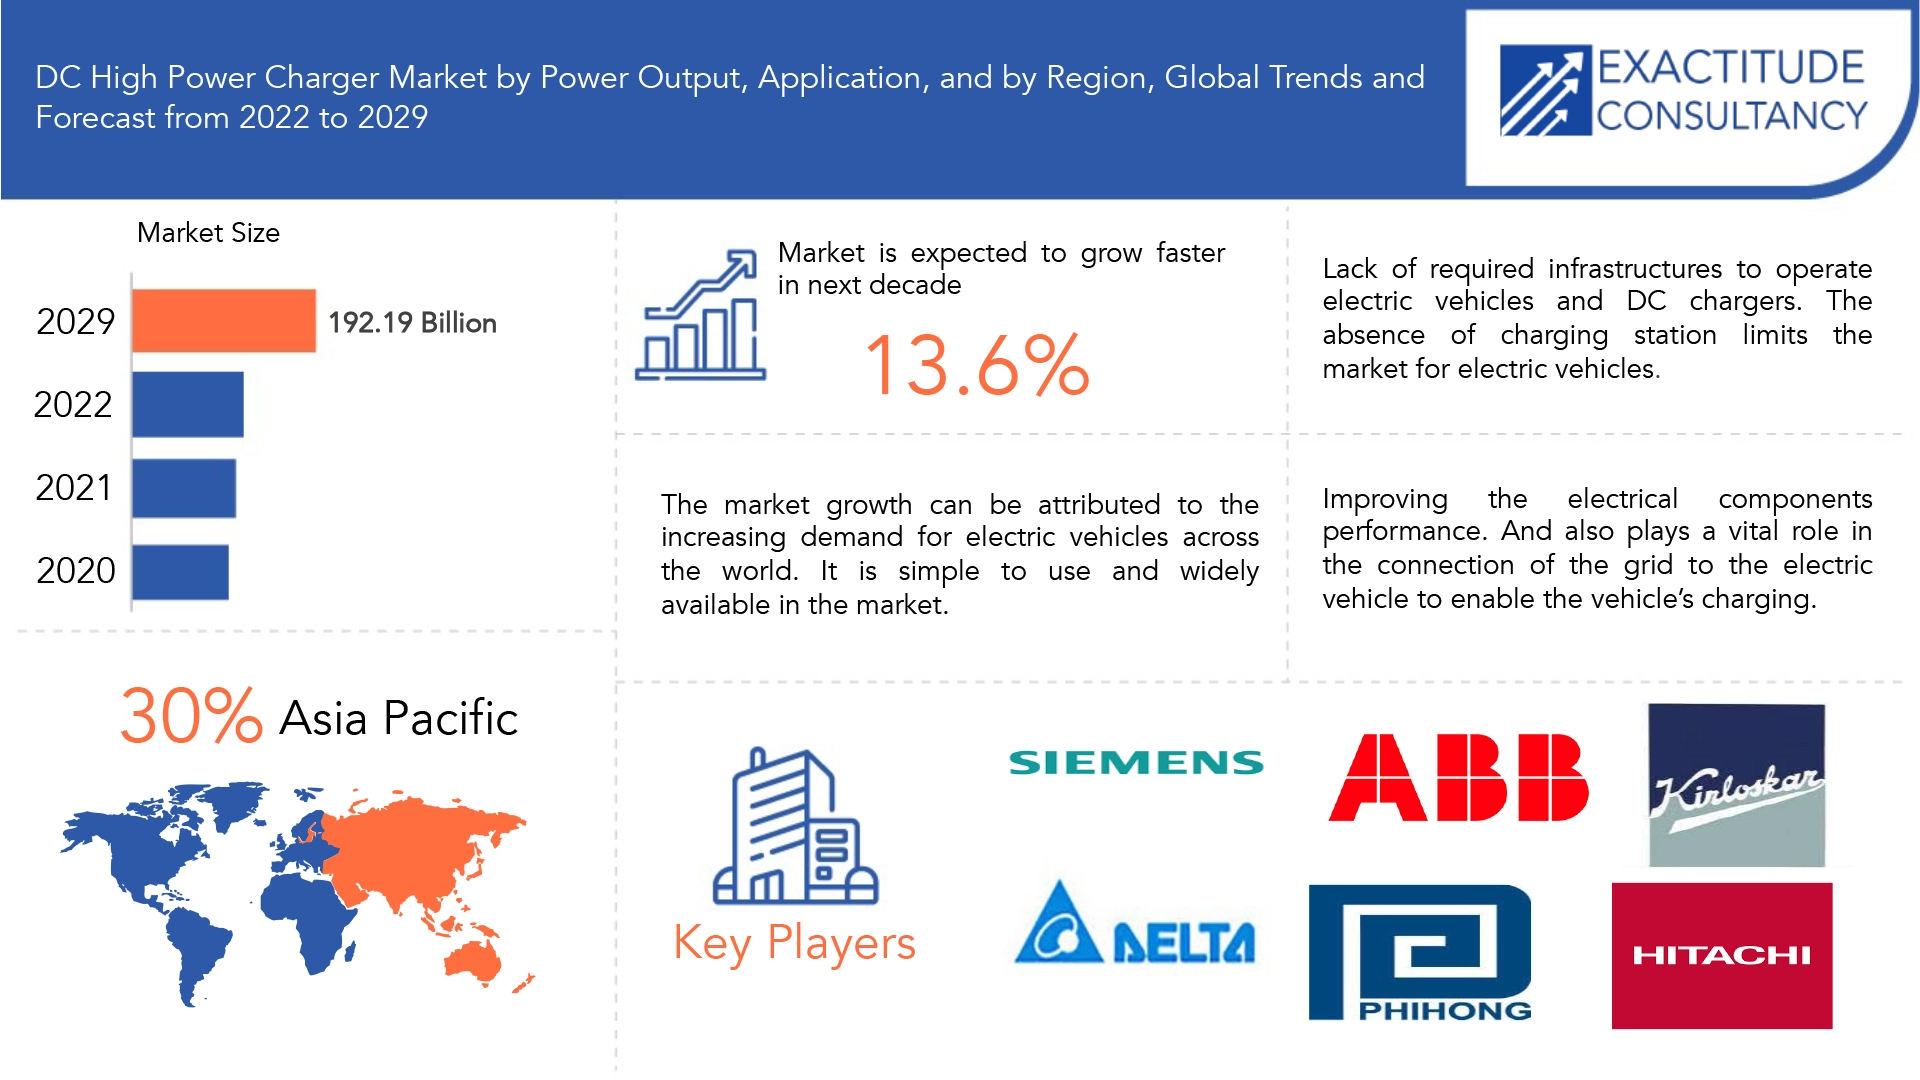
The DC high power charger market is expected to grow at 13.6% CAGR from 2023 to 2029. It is expected to reach above USD 192.19 Billion by 2029 from USD 61 Billion in 2022.
“DC” refers to “direct current” the type of power batteries uses. Level 2 charging stations use “AC” or “alternative current”, which you will easily find in typical household outlets. Electric vehicles have onboard chargers inside the car that convert AC power to DC for the battery. That means it can feed power directly to the car’s battery and doesn’t need the onboard charger to convert it. DC chargers are bigger, faster, and an exciting breakthrough when it comes to electric vehicles.
For this purpose, the EV incorporates an integrated charger. DC chargers provide DC power. DC batteries are employed in automotive and industrial applications in addition to charging batteries for electrical gadgets. They transform the input signal into a DC output signal. DC chargers are the preferred type of charger for most electronic equipment. One of the most major advantages of the DC charger is that it is very easy to deployed. But the absence of charging station limits the market for electric vehicles. A nation needs substantial number of charging stations. There are opportunities in improving the electrical components performance. And also plays a vital role in the connection of the grid to the electric vehicle to enable the vehicle’s charging.
| ATTRIBUTE | DETAILS |
| Study period | 2023-2029 |
| Base year | 2022 |
| Estimated year | 2023 |
| Forecasted year | 2023-2029 |
| Historical period | 2018-2022 |
| Unit | Value (USD BILLION), (THOUSAND UNITS). |
| Segmentation | By Power Output, By Application, By Region |
| By Power Output
|
|
| By Application
|
|
| By Region
|
|
The infrastructure for charging electric vehicles has evolved to keep pace with the growing number of automobile brands, models, and types with ever-larger battery packs. There are more alternatives now for fleet locations, commercial businesses, and public use.
Mobile phones, laptops, tablets, and other wearable electronics are among the portable electronics that are rapidly being charged using DC chargers. As demand for these portable gadgets rises, it is anticipated that the revenue generated by the worldwide DC charger market would increase significantly. Smartphones, computers, tablets, electric vehicles, and commercial machinery all need DC charges. DC chargers for electric vehicles is a latest innovation in the automotive industry. DC chargers for electric vehicles have made it possible to cover the distance of 350 km and more in a single charge.
One of the biggest risks to the world economy today is the continued spread of COVID-19, which is inflicting financial hardship for people, businesses, and communities everywhere. The "new normal" has made it difficult to manage everyday tasks, routine work, needs, and supplies, which has led to delayed projects and missed chances. The "new normal" also includes working from home and social isolation. The COVID-19 epidemic is having an effect on society and the global economy. The effects of this pandemic are spreading daily and are also having an effect on the supply chain. The stock market is becoming unclear, businesses are losing confidence, the supply chain is being hampered, and consumer anxiety is rising.
[caption id="attachment_13922" align="aligncenter" width="1920"]
Frequently Asked Questions
• What is the worth of DC High Power Charger Market?
The DC High Power Charger Market is expected to grow at 13.6% CAGR from 2023 to 2029. It is expected to reach above USD 192.19 Billion by 2029 from USD 61 Billion in 2022.
• What is the size of the Asia Pacific in DC High Power Charger Market?
Asia Pacific held more than 30% of the DC High Power Charger Market revenue share in 2022 and will witness expansion in the forecast period.
• What are some of the DC High Power Charger market's driving forces?
Increased sales of electric vehicles and an increase in the number of portable and wearable electronic devices are notable factors increasing the growth of the DC charger market. There is a significant demand for electronic products including smartphones, smartwatches, and headphones. Furthermore, the need for DC chargers is being fueled by the growing use of electric vehicles. The development of quick DC chargers that can quickly charge electric vehicles is what is driving the expansion of the global industry. In addition, the ongoing demand for DC chargers in industrial applications is anticipated to create development prospects for the market for DC fast chargers in the upcoming years.
• Which are the top companies to hold the market share in DC High Power Charger Market?
The Fiber Glass Market key players include ABB Group, Siemens AG, Delta Electronics, Inc., Phihong Technology Co. Ltd., Kirloskar Electric Co. Ltd., Hitachi, Ltd., Legrand S.A., Helios Power Solutions, AEG Power Solutions B.V., and Statron AG.
• Which is the largest regional market for DC high Power Charger Market?
The DC chargers market's greatest revenue share in 2022 belonged to Asia-Pacific. The high growth rate of this market segment is primarily attributable to increased government initiatives to instal DC chargers in nations like China and Japan, rising investments in the construction of infrastructure for DC fast-charging stations, and the faster charging speeds of DC fast chargers when compared to other chargers.
DC High Power Charger Market Segment Analysis
The DC high power charger market is segmented based on Power Output, Application and Region, Global trends and forecast.
By Power Output (10 KW to 100 KW, Less Than 10 KW, and More Than 100 KW), by Application (Industrial, Automotive, Consumer Electronics and others) and Region, Global trends and forecast.
The DC charger market is divided into three categories based on power output: less than 10 KW, 10 KW to 100 KW, and more than 10 KW. The 10 KW market category accounted for a sizeable portion of the DC charger industry's sales in 2021. The increased use of consumer electronics with small batteries, such as smartphones and laptops, is responsible for the segment's increased growth. The demand for faster charging to cut down on wait times is growing as people's lifestyles become more chaotic and busy.
The DC charger market is segmented into three categories, including Automotive, Consumer Electronics, and Industrial. Consumer electronics recorded a sizable sales proportion of the DC charger market in 2021. Due to the fact that more market participants worldwide are putting more of an emphasis on satisfying consumers' need for better charging alternatives, the segment's growth is accelerating quite quickly.
[caption id="attachment_13927" align="aligncenter" width="1920"]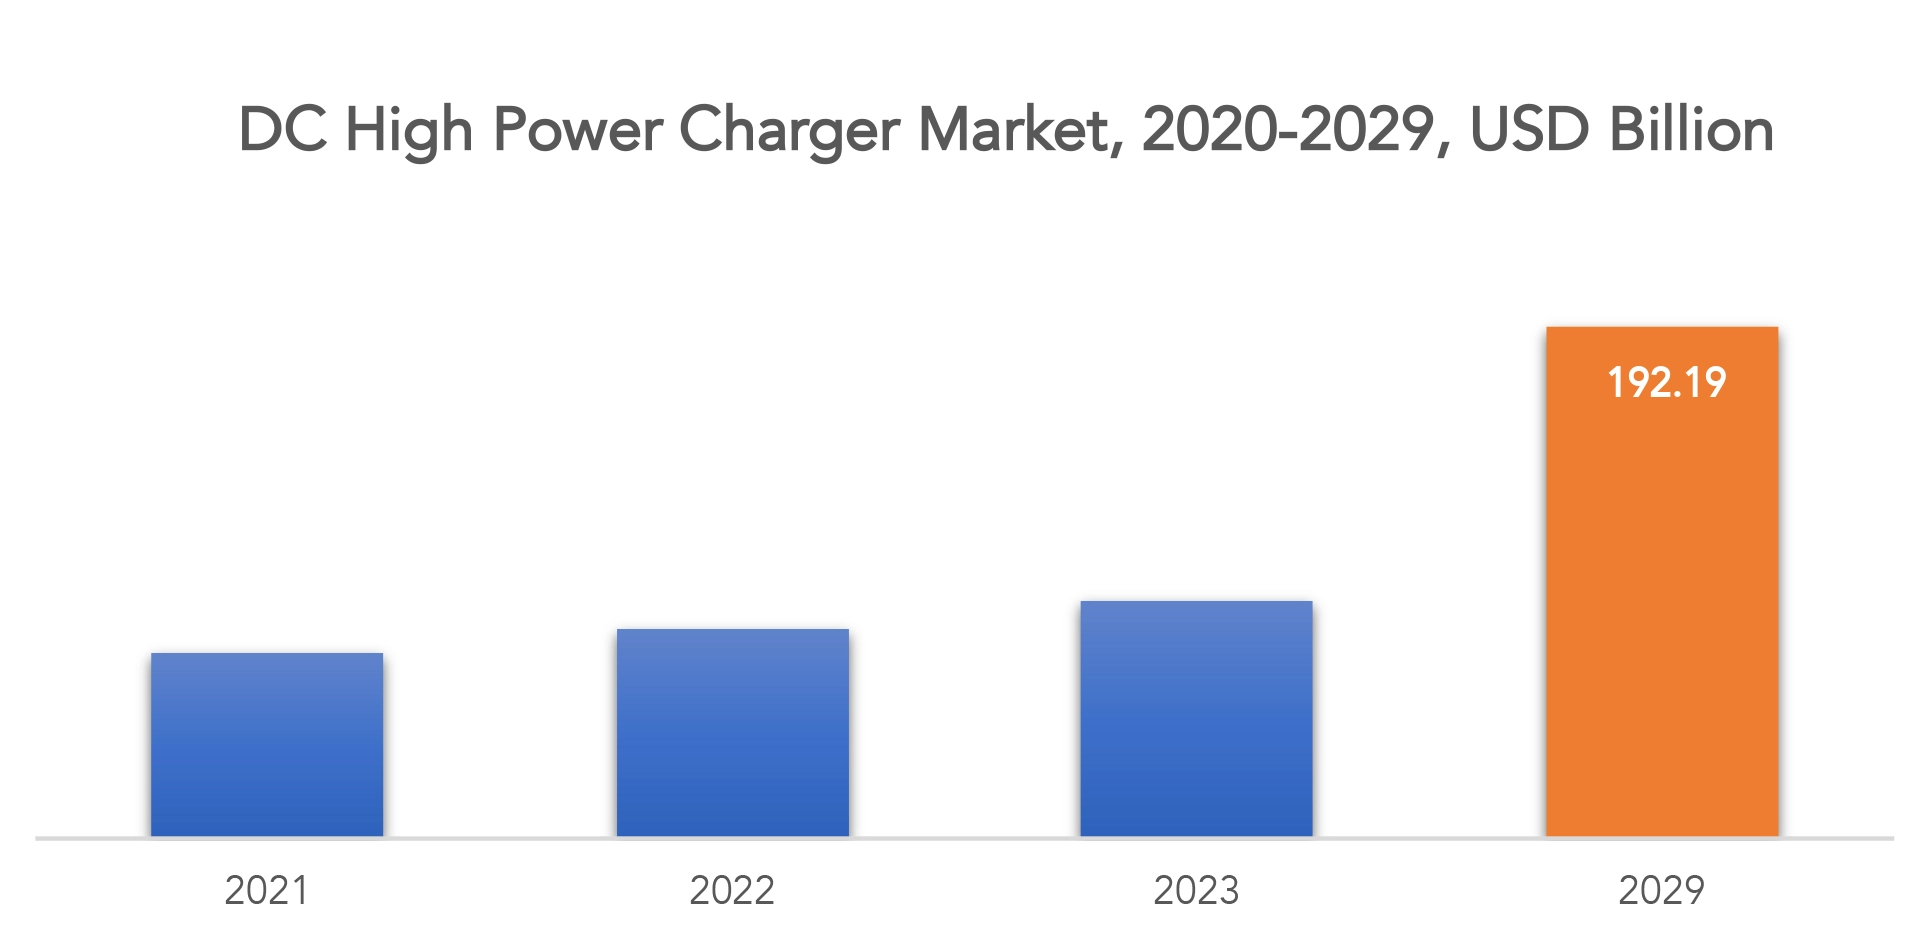
DC High Power Charger Market Players
The market research report covers the analysis of market players. Key companies profiled in the report include ABB Group, Siemens AG, Delta Electronics, Inc., Phihong Technology Co. Ltd., Kirloskar Electric Co. Ltd., Hitachi, Ltd., Legrand S.A., Helios Power Solutions, AEG Power Solutions B.V., and Statron AG.
Aug-2022: Delta Electronics came into an agreement with EVgo, the Largest EV Fast Charging Network in America. Under this agreement, Delta would provide its 1,000 ultra-fast chargers to EVgo in order to reduce the supply chain risk and streamline fast charging deployment targets within the US.
Jul-2022: Siemens partnered with ConnectDER, a plug-and-play grid integration solution provider. Following this partnership, the company aimed to offer Plug-in Home EV Charging Solution. This solution would allow EV owners to charge their vehicles EVs by connecting chargers directly via the meter socket.
Apr-2022: ABB teamed up with Shell, a multinational oil and gas company. Following this collaboration, the companies would offer high-quality and flexible charging solutions to owners of electric vehicles across the world.
Who Should Buy? Or Key Stakeholders
- Manufacturers of Electric Vehicle Charging Stations Component.
- Technology/system providers of Electric Vehicle Charging Stations
- Automobile Companies.
- Government and regional agencies and research organizations
- Investment research firms
- Others
DC High Power Charger Market Regional Analysis
The DC High Power Charger Market by region includes North America, Asia-Pacific (APAC), Europe, South America, and Middle East & Africa (MEA).
- North America: includes the US, Canada, Mexico
- Asia Pacific: includes China, Japan, South Korea, India, Australia, ASEAN and Rest of APAC
- Europe: includes UK, Germany, France, Italy, Spain, Russia, and Rest of Europe
- South America: includes Brazil, Argentina and Rest of South America
- Middle East & Africa: includes Turkey, UAE, Saudi Arabia, South Africa, and Rest of MEA
The DC Chargers Market is examined regionally throughout LAMEA, Asia-Pacific, Europe, and North America. The DC chargers market's greatest revenue share in 2021 belonged to Asia-Pacific. The high growth rate of this market segment is primarily attributable to increased government initiatives to instal DC chargers in nations like China and Japan, rising investments in the construction of infrastructure for DC fast-charging stations, and the faster charging speeds of DC fast chargers when compared to other chargers. DC chargers deliver DC electricity. In addition to being used to charge batteries for electronic devices, DC batteries are also used in automotive and industrial applications.
[caption id="attachment_13928" align="aligncenter" width="1920"]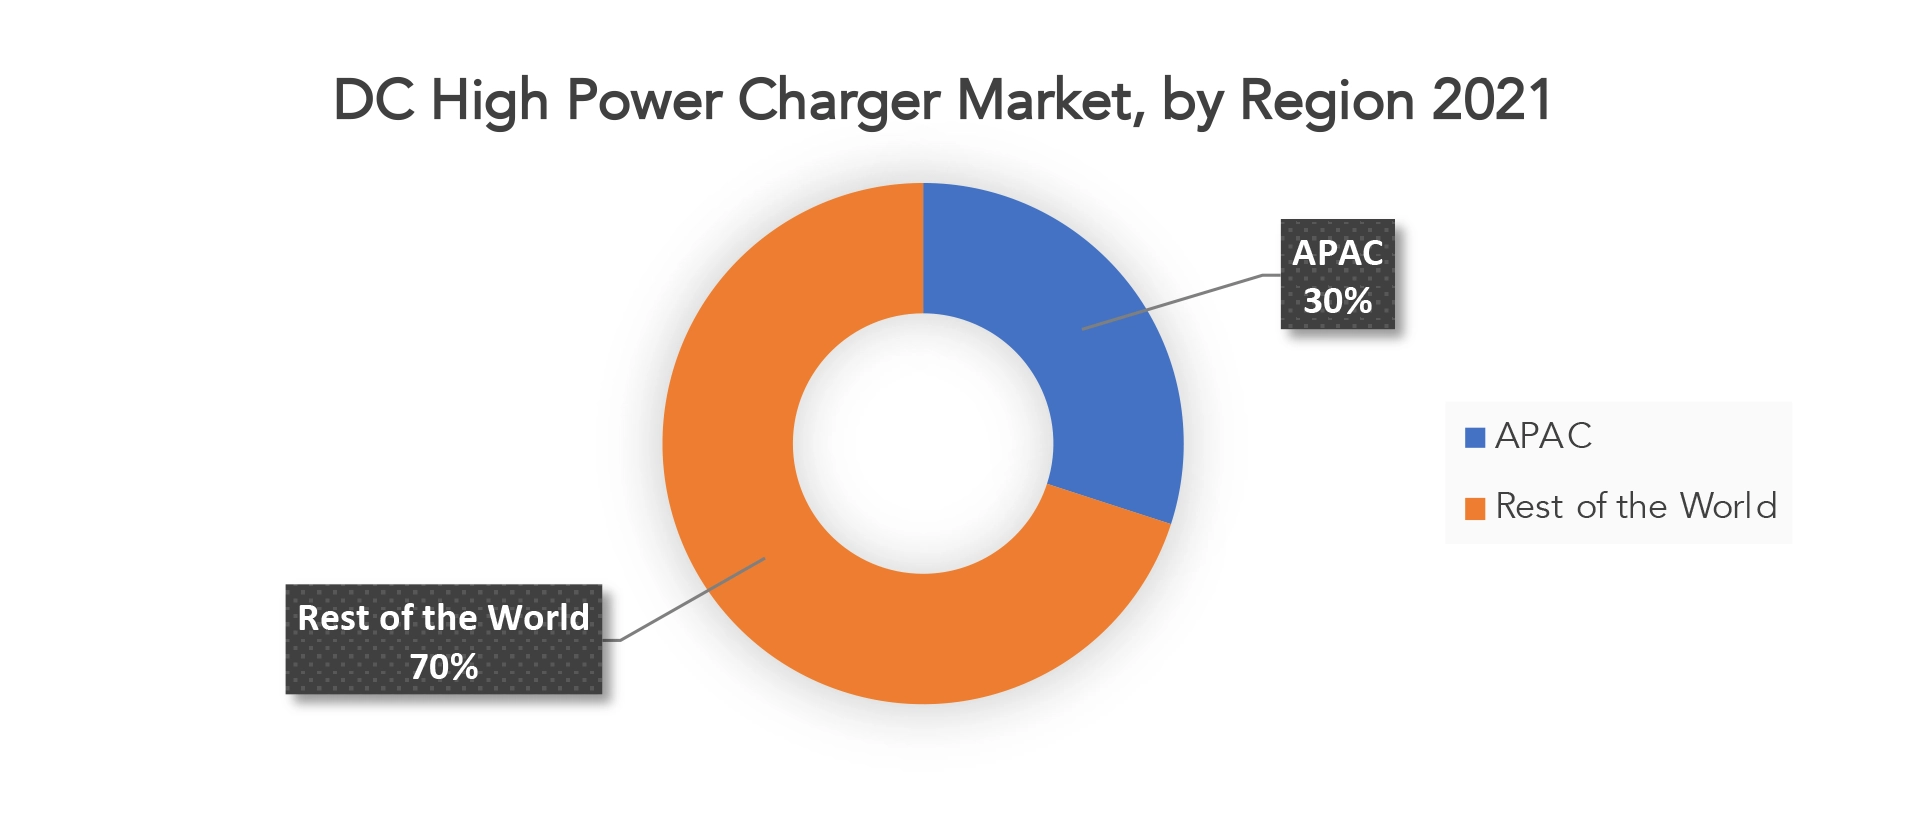
Key Market Segments: DC High Power Charger Market
DC High Power Charger Market By Power Output, 2023-2029, (USD Billion), (Thousand Units).- 10 Kw To 100 Kw
- Less Than 10 Kw
- More Than 100 Kw
- Industrial
- Automotive
- Consumer Electronics
- North America
- Asia Pacific
- Europe
- South America
- Middle East and Africa
Key Question Answered
- What is the current size of the DC High Power Charge Market?
- What are the key factors influencing the growth of DC High power Charger Market?
- What are the major applications for DC charger?
- Who are the major key players in the DC High Power Charge Market?
- Which region will provide more business opportunities for DC High Power Charger Market in future?
- Which segment holds the maximum share of the DC High Power Charge Market?
- Introduction
- Market Definition
- Market Segmentation
- Research Timelines
- Assumptions and Limitations
- Research Methodology
- Data Mining
- Secondary Research
- Primary Research
- Subject-Matter Experts’ Advice
- Quality Checks
- Final Review
- Data Triangulation
- Bottom-Up Approach
- Top-Down Approach
- Research Flow
- Data Sources
- Data Mining
- Executive Summary
- Market Overview
- Global DC High Power charger Market outlook
- Market Drivers
- Market Restraints
- Market Opportunities
- Impact of Covid-19 on DC High Power Charger Market
- Porter’s five forces model
- Threat from new entrants
- Threat from substitutes
- Bargaining power of suppliers
- Bargaining power of customers
- Degree of competition
- Industry value chain Analysis
- Global DC High Power charger Market outlook
- Global DC High Power Charger Market by Power Output, 2023-2029, (USD Billion, Thousand Units)
- 10 KW to 100 KW
- Less Than 10 KW
- More Than 100 KW
- Global DC High Power Charger Market by Application, 2023-2029, (USD Billion, Thousand Units)
- Industrial
- Automotive
- Consumer Electronics
- Global Dc High Power Charger Market by Region, 2023-2029, (USD Billion, Thousand Units)
- North America
- US
- Canada
- Mexico
- South America
- Brazil
- Argentina
- Colombia
- Rest Of South America
- Europe
- Germany
- UK
- France
- Italy
- Spain
- Russia
- Rest Of Europe
- Asia Pacific
- India
- China
- Japan
- South Korea
- Australia
- South-East Asia
- Rest Of Asia Pacific
- Middle East and Africa
- UAE
- Saudi Arabia
- South Africa
- Rest Of Middle East and Africa
- North America
- Company Profiles*
(Business Overview, Company Snapshot, Products Offered, Recent Developments)
- ABB Group
- Delta Electronics, Inc.
- Phihong Technology Co. Ltd.
- Kirloskar Electric Co. Ltd.
- Hitachi
- Legrand S.A.
- Helios Power Solutions
- AEG Power Solutions B.V.
- Statron Ltd.
- Siemens AG
*The Company List Is Indicative
LIST OF TABLES
TABLE 1 GLOBAL DC HIGH POWER CHARGER MARKET BY POWER OUTPUT (USD BILLION) 2020-2029
TABLE 2 GLOBAL DC HIGH POWER CHARGER MARKET BY POWER OUTPUT (THOUSAND UNITS) 2020-2029
TABLE 3 GLOBAL DC HIGH POWER CHARGER MARKET BY APPLICATION (USD BILLION) 2020-2029
TABLE 4 GLOBAL DC HIGH POWER CHARGER MARKET BY APPLICATION (THOUSAND UNITS) 2020-2029
TABLE 5 GLOBAL DC HIGH POWER CHARGER MARKET BY REGION (USD BILLION) 2020-2029
TABLE 6 GLOBAL DC HIGH POWER CHARGER MARKET BY REGION (THOUSAND UNITS) 2020-2029
TABLE 7 NORTH AMERICA DC HIGH POWER CHARGER MARKET BY COUNTRY (USD BILLION) 2020-2029
TABLE 8 NORTH AMERICA DC HIGH POWER CHARGER MARKET BY COUNTRY (THOUSAND UNITS) 2020-2029
TABLE 9 NORTH AMERICA DC HIGH POWER CHARGER MARKET BY POWER OUTPUT (USD BILLION) 2020-2029
TABLE 10 NORTH AMERICA DC HIGH POWER CHARGER MARKET BY POWER OUTPUT (THOUSAND UNITS) 2020-2029
TABLE 11 NORTH AMERICA DC HIGH POWER CHARGER MARKET BY APPLICATION (USD BILLION) 2020-2029
TABLE 12 NORTH AMERICA DC HIGH POWER CHARGER MARKET BY APPLICATION (THOUSAND UNITS) 2020-2029
TABLE 13 US DC HIGH POWER CHARGER MARKET BY POWER OUTPUT (USD BILLION) 2020-2029
TABLE 14 US DC HIGH POWER CHARGER MARKET BY POWER OUTPUT (THOUSAND UNITS) 2020-2029
TABLE 15 US DC HIGH POWER CHARGER MARKET BY APPLICATION (USD BILLION) 2020-2029
TABLE 16 US DC HIGH POWER CHARGER MARKET BY APPLICATION (THOUSAND UNITS) 2020-2029
TABLE 17 CANADA DC HIGH POWER CHARGER MARKET BY POWER OUTPUT (USD BILLION) 2020-2029
TABLE 18 CANADA DC HIGH POWER CHARGER MARKET BY POWER OUTPUT (THOUSAND UNITS) 2020-2029
TABLE 19 CANADA DC HIGH POWER CHARGER MARKET BY APPLICATION (USD BILLION) 2020-2029
TABLE 20 CANADA DC HIGH POWER CHARGER MARKET BY APPLICATION (THOUSAND UNITS) 2020-2029
TABLE 21 MEXICO DC HIGH POWER CHARGER MARKET BY POWER OUTPUT (USD BILLION) 2020-2029
TABLE 22 MEXICO DC HIGH POWER CHARGER MARKET BY POWER OUTPUT (THOUSAND UNITS) 2020-2029
TABLE 23 MEXICO DC HIGH POWER CHARGER MARKET BY APPLICATION (USD BILLION) 2020-2029
TABLE 24 MEXICO DC HIGH POWER CHARGER MARKET BY APPLICATION (THOUSAND UNITS) 2020-2029
TABLE 25 SOUTH AMERICA DC HIGH POWER CHARGER MARKET BY COUNTRY (USD BILLION) 2020-2029
TABLE 26 SOUTH AMERICA DC HIGH POWER CHARGER MARKET BY COUNTRY (THOUSAND UNITS) 2020-2029
TABLE 27 SOUTH AMERICA DC HIGH POWER CHARGER MARKET BY POWER OUTPUT (USD BILLION) 2020-2029
TABLE 28 SOUTH AMERICA DC HIGH POWER CHARGER MARKET BY POWER OUTPUT (THOUSAND UNITS) 2020-2029
TABLE 29 SOUTH AMERICA DC HIGH POWER CHARGER MARKET BY APPLICATION (USD BILLION) 2020-2029
TABLE 30 SOUTH AMERICA DC HIGH POWER CHARGER MARKET BY APPLICATION (THOUSAND UNITS) 2020-2029
TABLE 31 BRAZIL DC HIGH POWER CHARGER MARKET BY POWER OUTPUT (USD BILLION) 2020-2029
TABLE 32 BRAZIL DC HIGH POWER CHARGER MARKET BY POWER OUTPUT (THOUSAND UNITS) 2020-2029
TABLE 33 BRAZIL DC HIGH POWER CHARGER MARKET BY APPLICATION (USD BILLION) 2020-2029
TABLE 34 BRAZIL DC HIGH POWER CHARGER MARKET BY APPLICATION (THOUSAND UNITS) 2020-2029
TABLE 35 ARGENTINA DC HIGH POWER CHARGER MARKET BY POWER OUTPUT (USD BILLION) 2020-2029
TABLE 36 ARGENTINA DC HIGH POWER CHARGER MARKET BY POWER OUTPUT (THOUSAND UNITS) 2020-2029
TABLE 37 ARGENTINA DC HIGH POWER CHARGER MARKET BY APPLICATION (USD BILLION) 2020-2029
TABLE 38 ARGENTINA DC HIGH POWER CHARGER MARKET BY APPLICATION (THOUSAND UNITS) 2020-2029
TABLE 39 COLOMBIA DC HIGH POWER CHARGER MARKET BY POWER OUTPUT (USD BILLION) 2020-2029
TABLE 40 COLOMBIA DC HIGH POWER CHARGER MARKET BY POWER OUTPUT (THOUSAND UNITS) 2020-2029
TABLE 41 COLOMBIA DC HIGH POWER CHARGER MARKET BY APPLICATION (USD BILLION) 2020-2029
TABLE 42 COLOMBIA DC HIGH POWER CHARGER MARKET BY APPLICATION (THOUSAND UNITS) 2020-2029
TABLE 43 REST OF SOUTH AMERICA DC HIGH POWER CHARGER MARKET BY POWER OUTPUT (USD BILLION) 2020-2029
TABLE 44 REST OF SOUTH AMERICA DC HIGH POWER CHARGER MARKET BY POWER OUTPUT (THOUSAND UNITS) 2020-2029
TABLE 45 REST OF SOUTH AMERICA DC HIGH POWER CHARGER MARKET BY APPLICATION (USD BILLION) 2020-2029
TABLE 46 REST OF SOUTH AMERICA DC HIGH POWER CHARGER MARKET BY APPLICATION (THOUSAND UNITS) 2020-2029
TABLE 47 ASIA-PACIFIC DC HIGH POWER CHARGER MARKET BY COUNTRY (USD BILLION) 2020-2029
TABLE 48 ASIA-PACIFIC DC HIGH POWER CHARGER MARKET BY COUNTRY (THOUSAND UNITS) 2020-2029
TABLE 49 ASIA-PACIFIC DC HIGH POWER CHARGER MARKET BY POWER OUTPUT (USD BILLION) 2020-2029
TABLE 50 ASIA-PACIFIC DC HIGH POWER CHARGER MARKET BY POWER OUTPUT (THOUSAND UNITS) 2020-2029
TABLE 51 ASIA-PACIFIC DC HIGH POWER CHARGER MARKET BY APPLICATION (USD BILLION) 2020-2029
TABLE 52 ASIA-PACIFIC DC HIGH POWER CHARGER MARKET BY APPLICATION (THOUSAND UNITS) 2020-2029
TABLE 53 INDIA DC HIGH POWER CHARGER MARKET BY POWER OUTPUT (USD BILLION) 2020-2029
TABLE 54 INDIA DC HIGH POWER CHARGER MARKET BY POWER OUTPUT (THOUSAND UNITS) 2020-2029
TABLE 55 INDIA DC HIGH POWER CHARGER MARKET BY APPLICATION (USD BILLION) 2020-2029
TABLE 56 INDIA DC HIGH POWER CHARGER MARKET BY APPLICATION (THOUSAND UNITS) 2020-2029
TABLE 57 CHINA DC HIGH POWER CHARGER MARKET BY POWER OUTPUT (USD BILLION) 2020-2029
TABLE 58 CHINA DC HIGH POWER CHARGER MARKET BY POWER OUTPUT (THOUSAND UNITS) 2020-2029
TABLE 59 CHINA DC HIGH POWER CHARGER MARKET BY APPLICATION (USD BILLION) 2020-2029
TABLE 60 CHINA DC HIGH POWER CHARGER MARKET BY APPLICATION (THOUSAND UNITS) 2020-2029
TABLE 61 JAPAN DC HIGH POWER CHARGER MARKET BY POWER OUTPUT (USD BILLION) 2020-2029
TABLE 62 JAPAN DC HIGH POWER CHARGER MARKET BY POWER OUTPUT (THOUSAND UNITS) 2020-2029
TABLE 63 JAPAN DC HIGH POWER CHARGER MARKET BY APPLICATION (USD BILLION) 2020-2029
TABLE 64 JAPAN DC HIGH POWER CHARGER MARKET BY APPLICATION (THOUSAND UNITS) 2020-2029
TABLE 65 SOUTH KOREA DC HIGH POWER CHARGER MARKET BY POWER OUTPUT (USD BILLION) 2020-2029
TABLE 66 SOUTH KOREA DC HIGH POWER CHARGER MARKET BY POWER OUTPUT (THOUSAND UNITS) 2020-2029
TABLE 67 SOUTH KOREA DC HIGH POWER CHARGER MARKET BY APPLICATION (USD BILLION) 2020-2029
TABLE 68 SOUTH KOREA DC HIGH POWER CHARGER MARKET BY APPLICATION (THOUSAND UNITS) 2020-2029
TABLE 69 AUSTRALIA DC HIGH POWER CHARGER MARKET BY POWER OUTPUT (USD BILLION) 2020-2029
TABLE 70 AUSTRALIA DC HIGH POWER CHARGER MARKET BY POWER OUTPUT (THOUSAND UNITS) 2020-2029
TABLE 71 AUSTRALIA DC HIGH POWER CHARGER MARKET BY APPLICATION (USD BILLION) 2020-2029
TABLE 72 AUSTRALIA DC HIGH POWER CHARGER MARKET BY APPLICATION (THOUSAND UNITS) 2020-2029
TABLE 73 SOUTH-EAST ASIA DC HIGH POWER CHARGER MARKET BY POWER OUTPUT (USD BILLION) 2020-2029
TABLE 74 SOUTH-EAST ASIA DC HIGH POWER CHARGER MARKET BY POWER OUTPUT (THOUSAND UNITS) 2020-2029
TABLE 75 SOUTH-EAST ASIA DC HIGH POWER CHARGER MARKET BY APPLICATION (USD BILLION) 2020-2029
TABLE 76 SOUTH-EAST ASIA DC HIGH POWER CHARGER MARKET BY APPLICATION (THOUSAND UNITS) 2020-2029
TABLE 77 REST OF ASIA PACIFIC DC HIGH POWER CHARGER MARKET BY POWER OUTPUT (USD BILLION) 2020-2029
TABLE 78 REST OF ASIA PACIFIC DC HIGH POWER CHARGER MARKET BY POWER OUTPUT (THOUSAND UNITS) 2020-2029
TABLE 79 REST OF ASIA PACIFIC DC HIGH POWER CHARGER MARKET BY APPLICATION (USD BILLION) 2020-2029
TABLE 80 REST OF ASIA PACIFIC DC HIGH POWER CHARGER MARKET BY APPLICATION (THOUSAND UNITS) 2020-2029
TABLE 81 EUROPE DC HIGH POWER CHARGER MARKET BY COUNTRY (USD BILLION) 2020-2029
TABLE 82 EUROPE DC HIGH POWER CHARGER MARKET BY COUNTRY (THOUSAND UNITS) 2020-2029
TABLE 83 ASIA-PACIFIC DC HIGH POWER CHARGER MARKET BY POWER OUTPUT (USD BILLION) 2020-2029
TABLE 84 ASIA-PACIFIC DC HIGH POWER CHARGER MARKET BY POWER OUTPUT (THOUSAND UNITS) 2020-2029
TABLE 85 ASIA-PACIFIC DC HIGH POWER CHARGER MARKET BY APPLICATION (USD BILLION) 2020-2029
TABLE 86 ASIA-PACIFIC DC HIGH POWER CHARGER MARKET BY APPLICATION (THOUSAND UNITS) 2020-2029
TABLE 87 GERMANY DC HIGH POWER CHARGER MARKET BY POWER OUTPUT (USD BILLION) 2020-2029
TABLE 88 GERMANY DC HIGH POWER CHARGER MARKET BY POWER OUTPUT (THOUSAND UNITS) 2020-2029
TABLE 89 GERMANY DC HIGH POWER CHARGER MARKET BY APPLICATION (USD BILLION) 2020-2029
TABLE 90 GERMANY DC HIGH POWER CHARGER MARKET BY APPLICATION (THOUSAND UNITS) 2020-2029
TABLE 91 UK DC HIGH POWER CHARGER MARKET BY POWER OUTPUT (USD BILLION) 2020-2029
TABLE 92 UK DC HIGH POWER CHARGER MARKET BY POWER OUTPUT (THOUSAND UNITS) 2020-2029
TABLE 93 UK DC HIGH POWER CHARGER MARKET BY APPLICATION (USD BILLION) 2020-2029
TABLE 94 UK DC HIGH POWER CHARGER MARKET BY APPLICATION (THOUSAND UNITS) 2020-2029
TABLE 95 FRANCE DC HIGH POWER CHARGER MARKET BY POWER OUTPUT (USD BILLION) 2020-2029
TABLE 96 FRANCE DC HIGH POWER CHARGER MARKET BY POWER OUTPUT (THOUSAND UNITS) 2020-2029
TABLE 97 FRANCE DC HIGH POWER CHARGER MARKET BY APPLICATION (USD BILLION) 2020-2029
TABLE 98 FRANCE DC HIGH POWER CHARGER MARKET BY APPLICATION (THOUSAND UNITS) 2020-2029
TABLE 99 ITALY DC HIGH POWER CHARGER MARKET BY POWER OUTPUT (USD BILLION) 2020-2029
TABLE 100 ITALY DC HIGH POWER CHARGER MARKET BY POWER OUTPUT (THOUSAND UNITS) 2020-2029
TABLE 101 ITALY DC HIGH POWER CHARGER MARKET BY APPLICATION (USD BILLION) 2020-2029
TABLE 102 ITALY DC HIGH POWER CHARGER MARKET BY APPLICATION (THOUSAND UNITS) 2020-2029
TABLE 103 SPAIN DC HIGH POWER CHARGER MARKET BY POWER OUTPUT (USD BILLION) 2020-2029
TABLE 104 SPAIN DC HIGH POWER CHARGER MARKET BY POWER OUTPUT (THOUSAND UNITS) 2020-2029
TABLE 105 SPAIN DC HIGH POWER CHARGER MARKET BY APPLICATION (USD BILLION) 2020-2029
TABLE 106 SPAIN DC HIGH POWER CHARGER MARKET BY APPLICATION (THOUSAND UNITS) 2020-2029
TABLE 107 RUSSIA DC HIGH POWER CHARGER MARKET BY POWER OUTPUT (USD BILLION) 2020-2029
TABLE 108 RUSSIA DC HIGH POWER CHARGER MARKET BY POWER OUTPUT (THOUSAND UNITS) 2020-2029
TABLE 109 RUSSIA DC HIGH POWER CHARGER MARKET BY APPLICATION (USD BILLION) 2020-2029
TABLE 110 RUSSIA DC HIGH POWER CHARGER MARKET BY APPLICATION (THOUSAND UNITS) 2020-2029
TABLE 111 REST OF EUROPE DC HIGH POWER CHARGER MARKET BY POWER OUTPUT (USD BILLION) 2020-2029
TABLE 112 REST OF EUROPE DC HIGH POWER CHARGER MARKET BY POWER OUTPUT (THOUSAND UNITS) 2020-2029
TABLE 113 REST OF EUROPE DC HIGH POWER CHARGER MARKET BY APPLICATION (USD BILLION) 2020-2029
TABLE 114 REST OF EUROPE DC HIGH POWER CHARGER MARKET BY APPLICATION (THOUSAND UNITS) 2020-2029
TABLE 115 MIDDLE EAST AND AFRICA DC HIGH POWER CHARGER MARKET BY COUNTRY (USD BILLION) 2020-2029
TABLE 116 MIDDLE EAST AND AFRICA DC HIGH POWER CHARGER MARKET BY COUNTRY (THOUSAND UNITS) 2020-2029
TABLE 117 MIDDLE EAST AND AFRICA DC HIGH POWER CHARGER MARKET BY POWER OUTPUT (USD BILLION) 2020-2029
TABLE 118 MIDDLE EAST AND AFRICA DC HIGH POWER CHARGER MARKET BY POWER OUTPUT (THOUSAND UNITS) 2020-2029
TABLE 119 MIDDLE EAST AND AFRICA DC HIGH POWER CHARGER MARKET BY APPLICATION (USD BILLION) 2020-2029
TABLE 120 MIDDLE EAST AND AFRICA DC HIGH POWER CHARGER MARKET BY APPLICATION (THOUSAND UNITS) 2020-2029
TABLE 121 UAE DC HIGH POWER CHARGER MARKET BY POWER OUTPUT (USD BILLION) 2020-2029
TABLE 122 UAE DC HIGH POWER CHARGER MARKET BY POWER OUTPUT (THOUSAND UNITS) 2020-2029
TABLE 123 UAE DC HIGH POWER CHARGER MARKET BY APPLICATION (USD BILLION) 2020-2029
TABLE 124 UAE DC HIGH POWER CHARGER MARKET BY APPLICATION (THOUSAND UNITS) 2020-2029
TABLE 125 SAUDI ARABIA DC HIGH POWER CHARGER MARKET BY POWER OUTPUT (USD BILLION) 2020-2029
TABLE 126 SAUDI ARABIA DC HIGH POWER CHARGER MARKET BY POWER OUTPUT (THOUSAND UNITS) 2020-2029
TABLE 127 SAUDI ARABIA DC HIGH POWER CHARGER MARKET BY APPLICATION (USD BILLION) 2020-2029
TABLE 128 SAUDI ARABIA DC HIGH POWER CHARGER MARKET BY APPLICATION (THOUSAND UNITS) 2020-2029
TABLE 129 SOUTH AFRICA DC HIGH POWER CHARGER MARKET BY POWER OUTPUT (USD BILLION) 2020-2029
TABLE 130 SOUTH AFRICA DC HIGH POWER CHARGER MARKET BY POWER OUTPUT (THOUSAND UNITS) 2020-2029
TABLE 131 SOUTH AFRICA DC HIGH POWER CHARGER MARKET BY APPLICATION (USD BILLION) 2020-2029
TABLE 132 SOUTH AFRICA DC HIGH POWER CHARGER MARKET BY APPLICATION (THOUSAND UNITS) 2020-2029
TABLE 133 REST OF MIDDLE EAST AND AFRICA DC HIGH POWER CHARGER MARKET BY POWER OUTPUT (USD BILLION) 2020-2029
TABLE 134 REST OF MIDDLE EAST AND AFRICA DC HIGH POWER CHARGER MARKET BY POWER OUTPUT (THOUSAND UNITS) 2020-2029
TABLE 135 REST OF MIDDLE EAST AND AFRICA DC HIGH POWER CHARGER MARKET BY APPLICATION (USD BILLION) 2020-2029
TABLE 136 REST OF MIDDLE EAST AND AFRICA DC HIGH POWER CHARGER MARKET BY APPLICATION (THOUSAND UNITS) 2020-2029
LIST OF FIGURES
FIGURE 1 MARKET DYNAMICS
FIGURE 2 MARKET SEGMENTATION
FIGURE 3 REPORT TIMELINES: YEARS CONSIDERED
FIGURE 4 DATA TRIANGULATION
FIGURE 5 BOTTOM-UP APPROACH
FIGURE 6 TOP-DOWN APPROACH
FIGURE 7 RESEARCH FLOW
FIGURE 8 GLOBAL DC HIGH POWER CHARGER MARKET BY POWER OUTPUT, USD BILLION, 2020- 2029
FIGURE 9 GLOBAL DC HIGH POWER CHARGER MARKET BY APPLICATION, USD BILLION, 2020-2029
FIGURE 10 GLOBAL DC HIGH POWER CHARGER MARKET BY REGION, USD BILLION, 2020-2029
FIGURE 11 PORTER’S FIVE FORCES MODEL
FIGURE 12 GLOBAL DC HIGH POWER CHARGER MARKET BY POWER OUTPUT, USD BILLION, 2021
FIGURE 13 GLOBAL DC HIGH POWER CHARGER MARKET BY APPLICATION, USD BILLION, 2021
FIGURE 14 GLOBAL DC HIGH POWER CHARGER MARKET BY REGION, USD BILLION, 2021
FIGURE 15 MARKET SHARE ANALYSIS
FIGURE 16 ABB GROUP: COMPANY SNAPSHOT
FIGURE 17 DELTA ELECTRONICS: COMPANY SNAPSHOT
FIGURE 18 PHIHONG TECHNOLOGY CO. LTD.: COMPANY SNAPSHOT
FIGURE 19 KIRLOSKAR ELECTRIC CO. LTD.: COMPANY SNAPSHOT
FIGURE 20 HITACHI: COMPANY SNAPSHOT
FIGURE 21 LEGRAND S.A.: COMPANY SNAPSHOT
FIGURE 22 HELIOS POWER SOLUTIONS: COMPANY SNAPSHOT
FIGURE 23 AEG POWER SOLUTIONS B.V.: COMPANY SNAPSHOT
FIGURE 24 STATRON LTD.: COMPANY SNAPSHOT
FIGURE 25 SIEMENS AG: COMPANY SNAPSHOT
DOWNLOAD FREE SAMPLE REPORT
License Type
SPEAK WITH OUR ANALYST
Want to know more about the report or any specific requirement?
WANT TO CUSTOMIZE THE REPORT?
Our Clients Speak
We asked them to research ‘ Equipment market’ all over the world, and their whole arrangement was helpful to us. thehealthanalytics.com insightful analysis and reports contributed to our current analysis and in creating a future strategy. Besides, the te
Yosuke Mitsui
Senior Associate Construction Equipment Sales & Marketing
We asked them to research ‘Equipment market’ all over the world, and their whole arrangement was helpful to us. thehealthanalytics.com insightful analysis and reports contributed to our current analysis and in creating a future strategy. Besides, the te


