

Base Year Value ()
x.x %
x.x %
CAGR ()
x.x %
x.x %
Forecast Year Value ()
x.x %
x.x %
Historical Data Period
Largest Region
Forecast Period
Global Immunotherapy Drugs Market by Type (Monoclonal Antibodies, Immunomodulators, Interlukins, Vaccines), by Therapy Area (Cancer, Autoimmune Disease, Inflammatory Disease, Infectious Disease), by End User (Hospital, Clinic) and by Region, Global trends and forecast from 2022 to 2029.
Instant access to hundreds of data points and trends
- Market estimates from 2014-2029
- Competitive analysis, industry segmentation, financial benchmarks
- Incorporates SWOT, Porter's Five Forces and risk management frameworks
- PDF report or online database with Word, Excel and PowerPoint export options
- 100% money back guarantee
Global Immunotherapy Drugs Market Overview
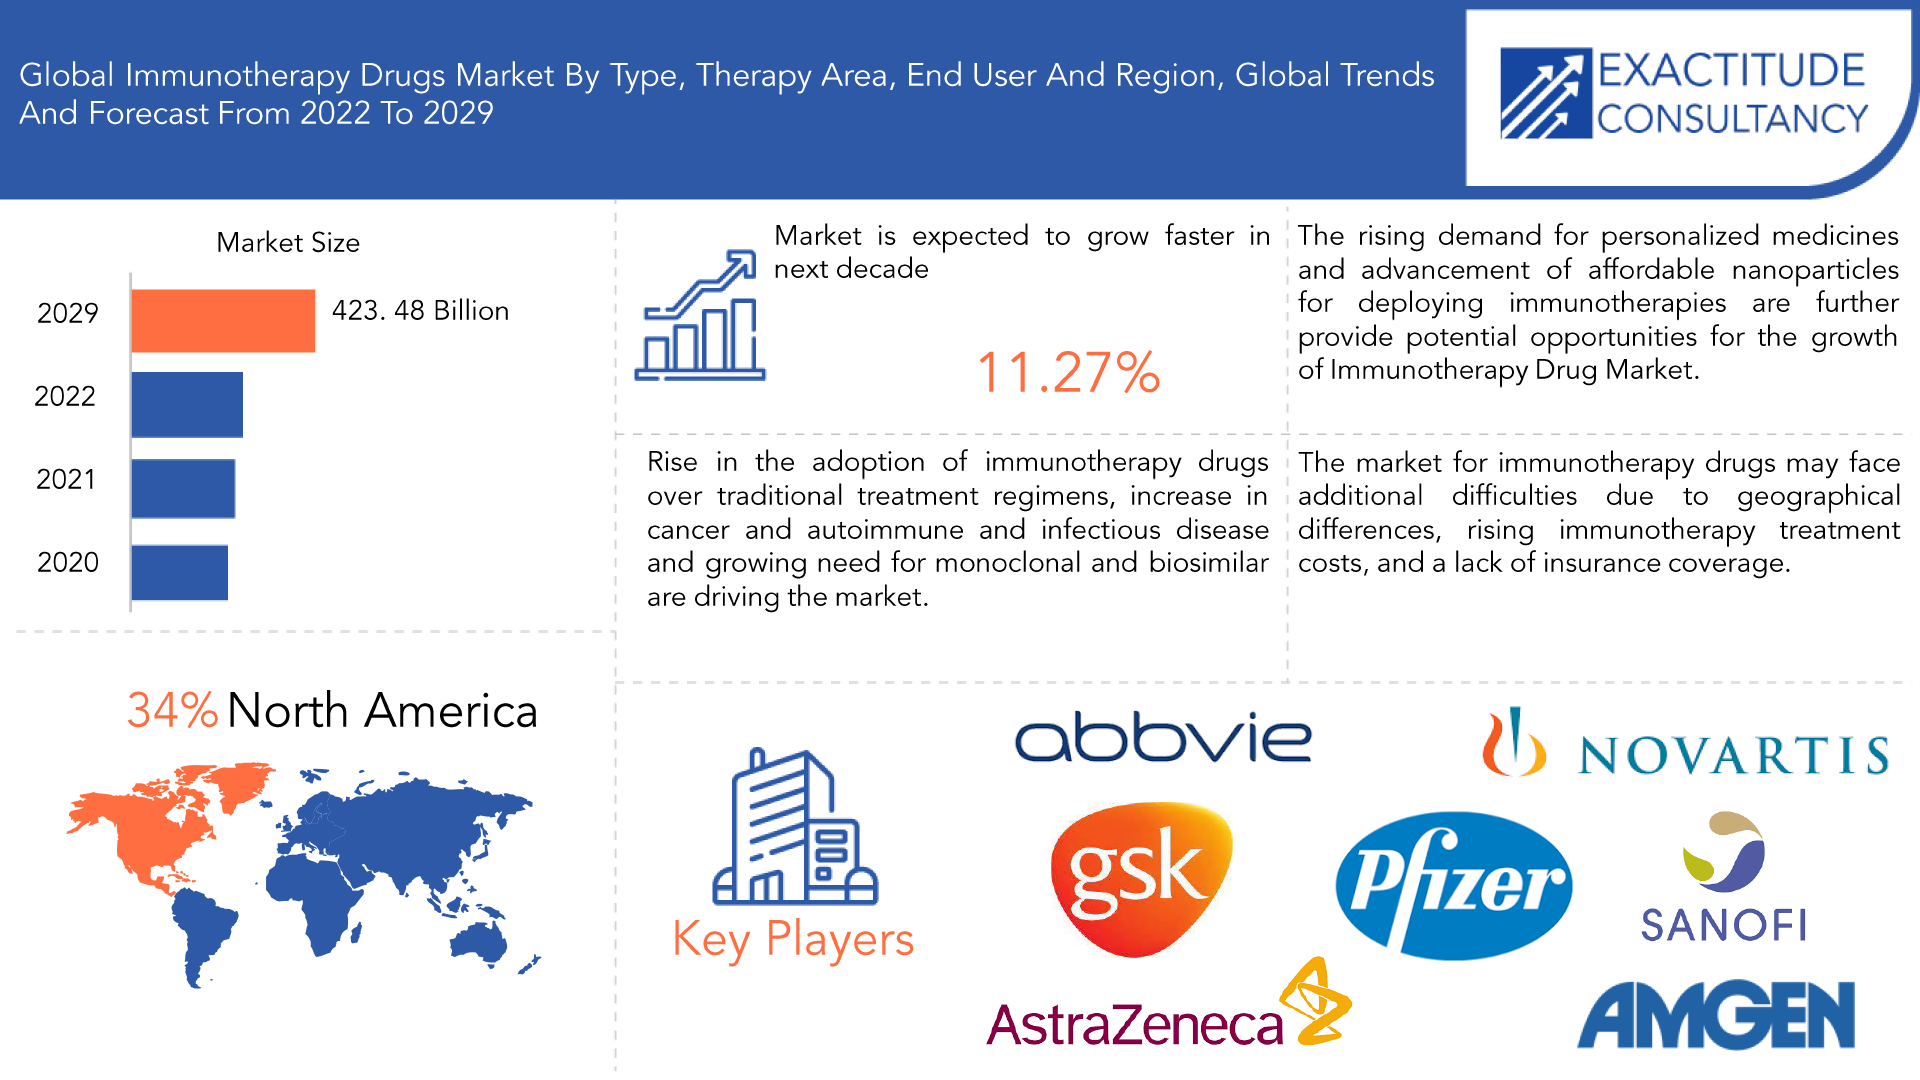
The global Immunotherapy drugs market size is expected to grow at more than 11.27% CAGR from 2021 to 2029. It is expected to reach above USD 423.48 billion by 2029 from a little above USD 161.97 billion in 2020.
Drugs used in immunotherapy are used to either strengthen or weaken the immune system of the body. They primarily fight cancer by boosting the immune system and causing an immunological reaction that promotes the production of antibodies. Malignant or tumor cells are destroyed by antibodies that are produced in response to an antigen. The market's revenue growth is primarily being driven by an increase in the number of successful Research & Development (R&D) outcomes in the field of immunotherapy used to treat cancer, autoimmune diseases, neurodegenerative diseases, adenocarcinomas, cardiovascular diseases, and other diseases, as well as rising adoption of targeted therapy over traditional therapy and an increase in the prevalence of chronic diseases and lifestyle disorders. Immunotherapy is a form of biological therapy used to treat cancer patients. It works by enhancing the patient's immune system's capacity to find and destroy cancer cells within the body.
| ATTRIBUTE | DETAILS |
| Study period | 2020-2029 |
| Base year | 2021 |
| Estimated year | 2022 |
| Forecasted year | 2022-2029 |
| Historical period | 2018-2020 |
| Unit | Value (USD Billion), (Thousand Units) |
| Segmentation | By Type, By Therapy Area, By End User, By Region |
| By Type |
|
| By Therapy Area |
|
| By End User |
|
| By Region |
|
Immunotherapies that focus on immunomodulation, passive viral neutralization, and inflammatory cytokine neutralization can lower viral load, prevent ICU admission, and reduce inflammation-related lung damage while also reducing inflammation itself. This will help the market expand more quickly. Because they enable the development of antibodies that specifically target a particular tumor antigen, monoclonal antibodies are advantageous. The antibodies can be produced in large quantities using in vitro methods in the lab. Another factor that will support the expansion of the market is the necessity of biosimilars in the treatment of cancer. In addition, the future growth of the market for immunotherapy pharmaceuticals may be influenced by the rising desire for customized treatment and the development of more accessible nanoparticles for immunotherapies.
COVID-19 had significant positive impact on the immunotherapy drug market. Market share for immunotherapy drugs increased as a result of COVID-19. The impact of COVID-19 on the industry for immunotherapy treatments is favorable due to the fact that multiple companies are actively working on developing immunotherapy-based drugs or vaccines for COVID-19. In collaboration with Pfizer Inc., BioNTech SE is presently conducting phase III clinical research in healthy volunteers to evaluate the safety, tolerability, and immunogenicity of BNT162b2 against COVID-19.
[caption id="attachment_15053" align="aligncenter" width="1920"]
Frequently Asked Questions
• Who are the key players in the global immunotherapy drugs market?
Some key players operating in the global immunotherapy drugs market include Amgen Inc., Novartis AG, AbbVie Inc., Pfizer Inc., Nextera AS, Johnson & Johnson Services Inc., AstraZeneca, GSK, Sanofi, Biomunex Pharmaceuticals.
• What are the factors driving the global immunotherapy drugs market?
The market's revenue growth is primarily being driven by an increase in the number of successful Research & Development (R&D) outcomes in the field of immunotherapy used to treat cancer, autoimmune diseases, neurodegenerative diseases, adenocarcinomas, cardiovascular diseases, and other diseases, as well as rising adoption of targeted therapy over traditional therapy and an increase in the prevalence of chronic diseases and lifestyle disorders.
• How big is the global immunotherapy drugs market?
The global Immunotherapy Drugs market size was estimated at USD 161.97 billion in 2021 and is expected to reach USD 423.48 billion in 2029.
• What is the global immunotherapy drugs market growth?
The global immunotherapy drugs market is expected to grow at a compound annual growth rate of 11.27 % from 2022 to 2029 to reach USD 423.48 billion by 2029.
• Which region accounted for the largest global immunotherapy drugs market share?
The North America dominated the global immunotherapy drugs market with a share of 34% in 2021.
Global Immunotherapy Drugs Market Segment Analysis
Based on the type, market is segmented into monoclonal antibodies, immunomodulators, interlukins, vaccines. The monoclonal antibodies segment account for the maximum share of market revenue due to its improved implementation in cancer immunotherapy. It frequently has fewer side effects than other cancer treatments and helps the immune system fight cancer. Revenue growth in this market is being driven by immunomodulators' notable accuracy in preventing cancer when compared to other techniques. These are substances that either stimulate newly developed immune responses or boost already existing ones in order to identify and eradicate cancer cells.
Based on the therapy area, market is segmented into cancer, autoimmune disease, inflammatory disease, infectious disease. Cancer treatment accounted for largest use of immunotherapy drugs. One of the main factors influencing this segment's revenue growth is the rising incidence of cancer around the world, which is being accompanied by a shift away from chemotherapy due to its adverse effects. An enormous increase in the quantity of successful R&D (Research and Development) efforts is being caused by the rising prevalence of autoimmune illnesses.
By end user, market is segmented into hospital and clinic. Hospitals account for the major share for the use of immunotherapy drugs.
[caption id="attachment_15054" align="aligncenter" width="1920"]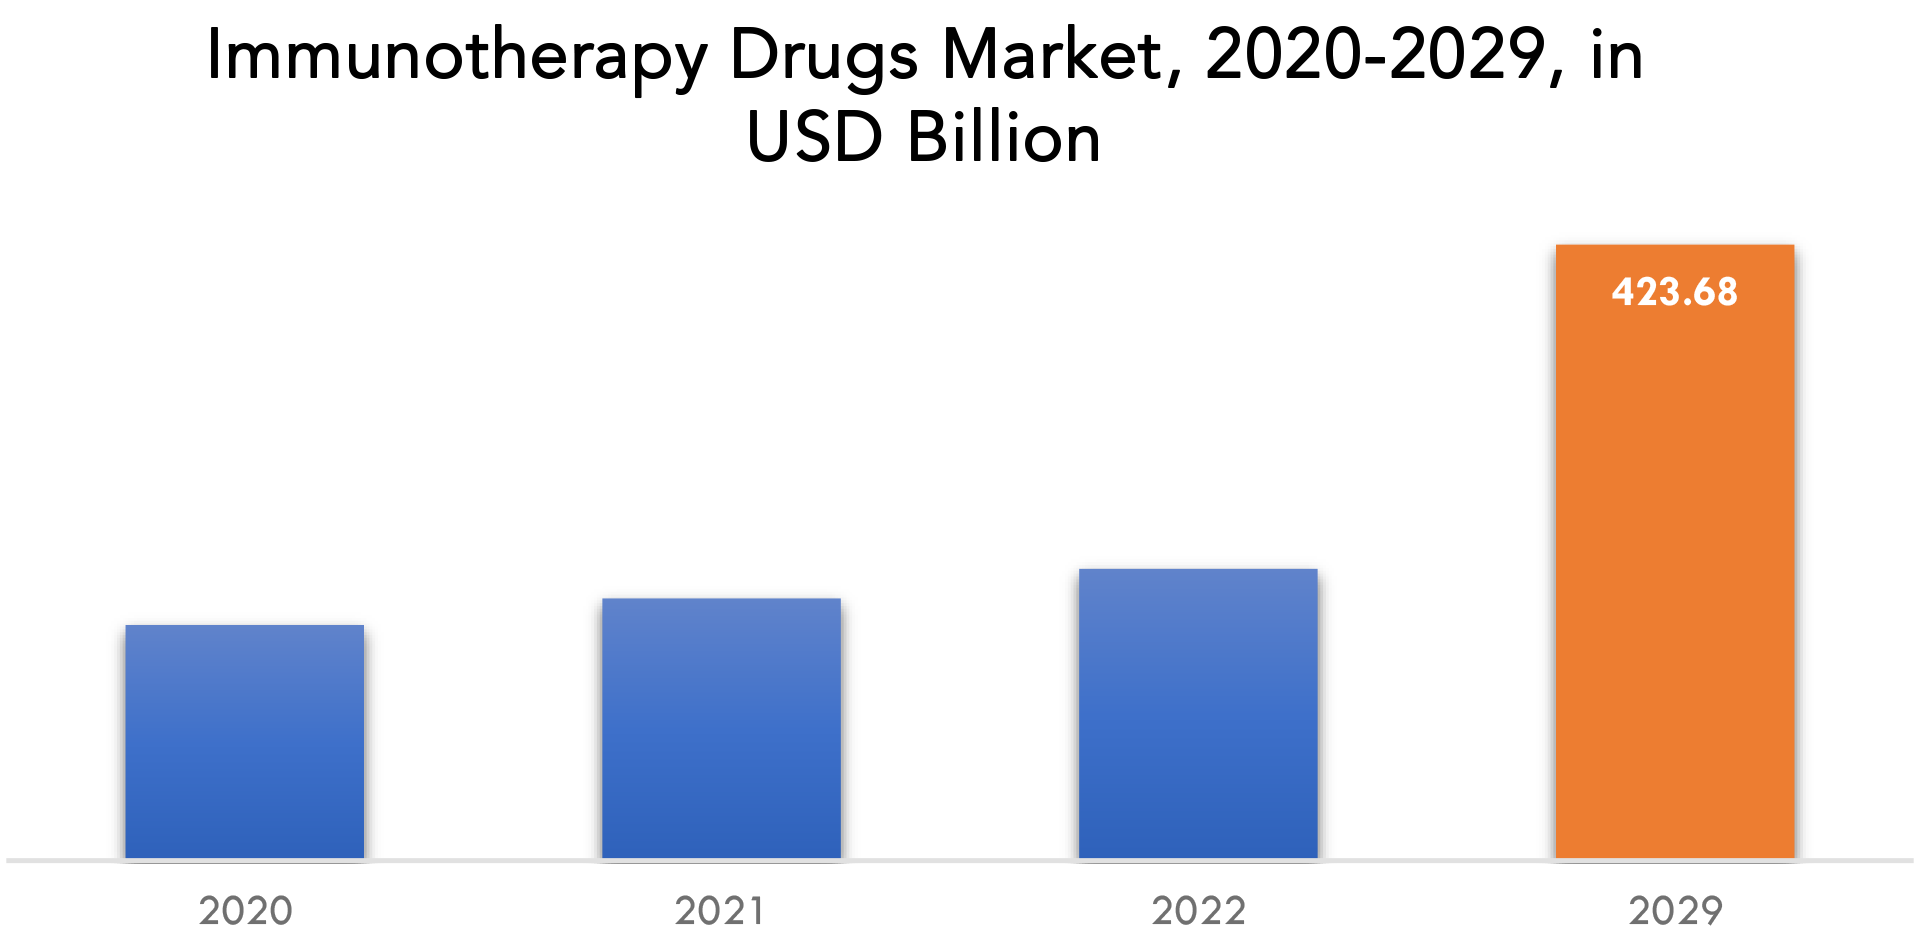
Global Immunotherapy Drugs Market Players
Key competitors from both domestic and international markets compete fiercely in the worldwide global Immunotherapy Drugs industry include Amgen Inc., Novartis AG, AbbVie Inc., Pfizer Inc., Nextera AS, Johnson & Johnson Services Inc., AstraZeneca, GSK, Sanofi, Biomunex Pharmaceuticals. Recent News:- 20th March 2022: Nextera AS strategically collaborated with Zelluna Immunotherapy AS for the development of optimized TCRs for cancer immunotherapy.
- February 2022: Biomunex Pharmaceuticals collaborated with Institut Curie to develop an immunotherapy drug candidate to treat hematological malignancies using Biomunex’ BiXAR technology.
Who Should Buy? Or Key stakeholders
- Immunotherapy Drugs Providers
- Research and Development Organizations
- Regulatory Agencies
- Specialties Pharmacy
- Cancer Clinics
- Pharmaceutical Manufactures
- Investors
- Others
Global Immunotherapy Drugs Market Regional Analysis
The Global Immunotherapy Drugs Market by region includes North America, Asia-Pacific (APAC), Europe, South America, and Middle East & Africa (MEA).
- North America: includes the US, Canada, Mexico
- Asia Pacific: includes China, Japan, South Korea, India, Australia, ASEAN and Rest of APAC
- Europe: includes UK, Germany, France, Italy, Spain, Russia, and Rest of Europe
- South America: includes Brazil, Argentina and Rest of South America
- Middle East & Africa: includes Turkey, UAE, Saudi Arabia, South Africa, and Rest of MEA
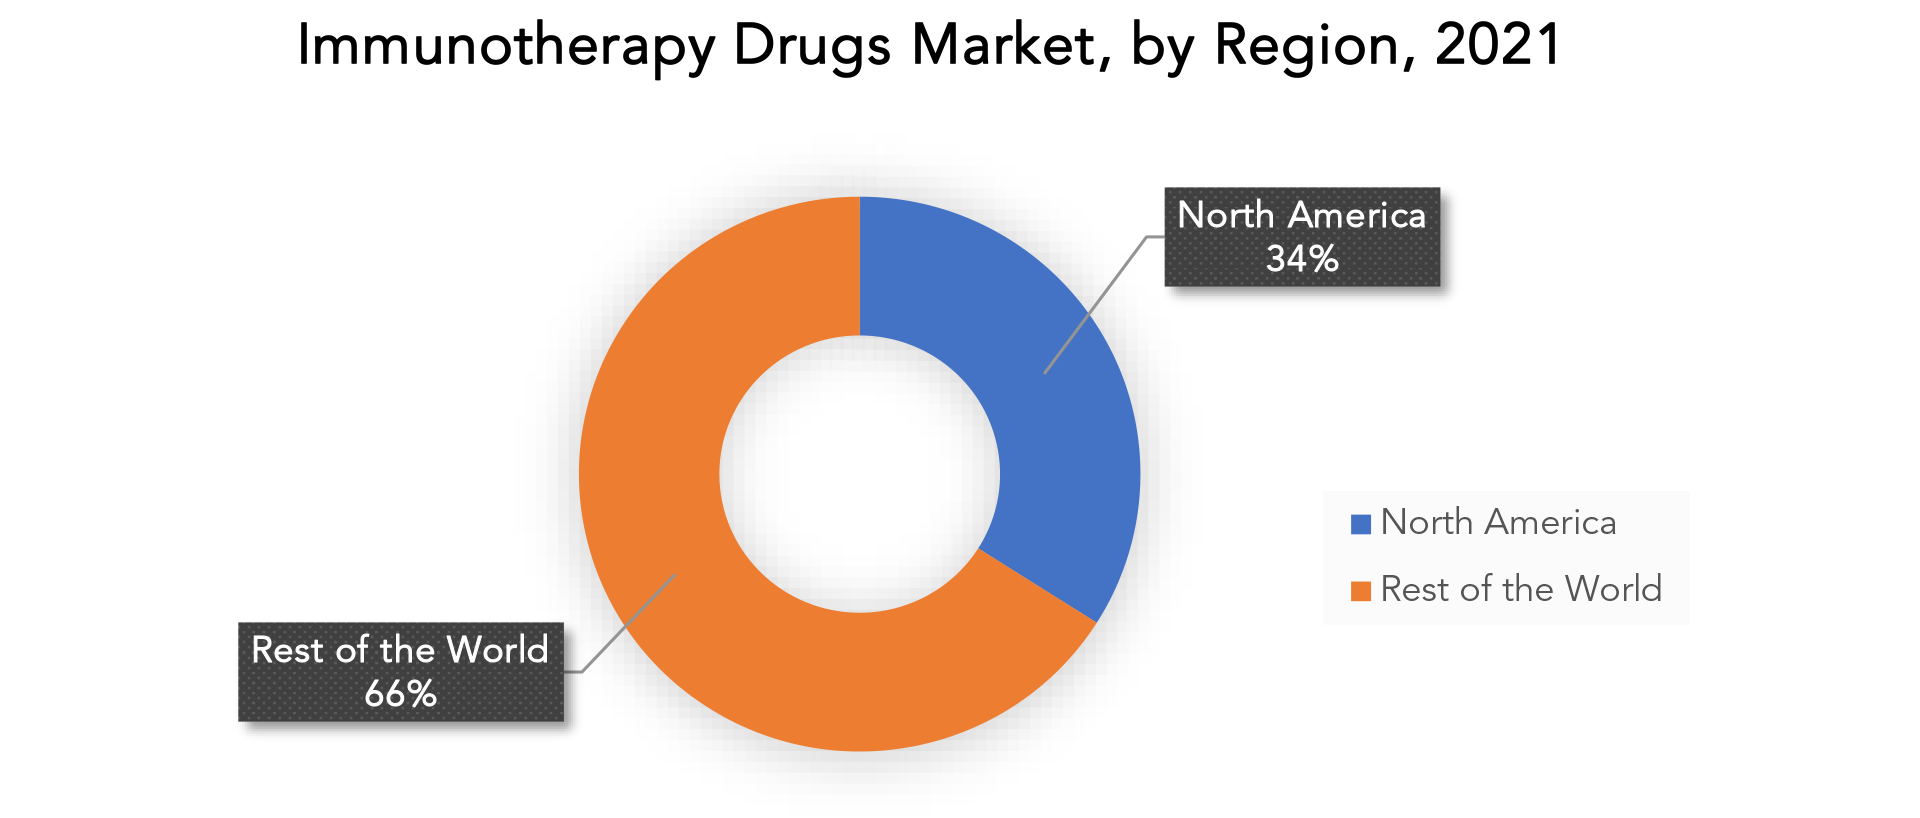
Due to an increase in FDA approvals, North America currently holds a monopoly on the market for immunotherapy medications. Additionally, throughout the projected period, the prevalence of autoimmune disorders and cancer will increase, which will further support the expansion of the market for immunotherapy drugs in the area. Due to the rising costs of building a healthcare infrastructure, the immunotherapy medicine market in Asia-Pacific is expected to grow significantly throughout this period. Furthermore, it is projected that in the upcoming years, the market for immunotherapy medications in the region will rise significantly due to the large patient pool and rising cancer incidence.
Key Market Segments: Global Immunotherapy Drugs Market
Global Immunotherapy Drugs Market By Type, 2020-2029, (USD Billion), (Thousand Units)- Monoclonal Antibodies
- Immunomodulators
- Interlukins
- Vaccines
- Cancer
- Autoimmune Disease
- Inflammatory Disease
- Infectious Disease
- Hospital
- Clinic
- North America
- Europe
- Asia Pacific
- South America
- Middle East And Africa
Exactitude Consultancy Services Key Objectives
- Increasing sales and market share
- Developing new technology
- Improving profitability
- Entering new market
- Enhancing brand reputation
Key Question Answered
- What is the expected growth rate of the immunotherapy drugs market over the next 7 years?
- Who are the major players in the immunotherapy drugs market and what is their market share?
- What are the end-user industries driving demand for market and what is their outlook?
- What are the opportunities for growth in emerging markets such as Asia-Pacific, Middle East, and Africa?
- How is the economic environment affecting the immunotherapy drugs market, including factors such as interest rates, inflation, and exchange rates?
- What is the expected impact of government policies and regulations on the immunotherapy drugs market?
- What is the current and forecasted size and growth rate of the global immunotherapy drugs market?
- What are the key drivers of growth in the immunotherapy drugs market?
- What are the distribution channels and supply chain dynamics in the immunotherapy drugs market?
- What are the technological advancements and innovations in the immunotherapy drugs market and their impact on product development and growth?
- What are the regulatory considerations and their impact on the market?
- What are the challenges faced by players in the immunotherapy drugs market and how are they addressing these challenges?
- What are the opportunities for growth and expansion in the immunotherapy drugs market?
- What are the product offerings and specifications of leading players in the market?
- What is the pricing trend of immunotherapy drugs’ in the market and what is the impact of raw material prices on the price trend?
- INTRODUCTION
- MARKET DEFINITION
- MARKET SEGMENTATION
- RESEARCH TIMELINES
- ASSUMPTIONS AND LIMITATIONS
- RESEARCH METHODOLOGY
- DATA MINING
- SECONDARY RESEARCH
- PRIMARY RESEARCH
- SUBJECT-MATTER EXPERTS’ ADVICE
- QUALITY CHECKS
- FINAL REVIEW
- DATA TRIANGULATION
- BOTTOM-UP APPROACH
- TOP-DOWN APPROACH
- RESEARCH FLOW
- DATA SOURCES
- DATA MINING
- EXECUTIVE SUMMARY
- MARKET OVERVIEW
- GLOBAL IMMUNOTHERAPY DRUGS MARKET OUTLOOK
- MARKET DRIVERS
- MARKET RESTRAINTS
- MARKET OPPORTUNITIES
- IMPACT OF COVID-19 ON IMMUNOTHERAPY DRUGS MARKET
- PORTER’S FIVE FORCES MODEL
- THREAT FROM NEW ENTRANTS
- THREAT FROM SUBSTITUTES
- BARGAINING POWER OF SUPPLIERS
- BARGAINING POWER OF CUSTOMERS
- DEGREE OF COMPETITION
- INDUSTRY VALUE CHAIN ANALYSIS
- GLOBAL IMMUNOTHERAPY DRUGS MARKET OUTLOOK
- GLOBAL IMMUNOTHERAPY DRUGS MARKET BY TYPE, 2020-2029, (USD BILLION), (THOUSAND UNITS)
- MONOCLONAL ANTIBODIES
- IMMUNOMODULATORS
- INTERLUKINS
- VACCINES
- GLOBAL IMMUNOTHERAPY DRUGS MARKET BY THERAPY AREA, 2020-2029, (USD BILLION), (THOUSAND UNITS)
- CANCER
- AUTOIMMUNE DISEASE
- INFLAMMATORY DISEASE
- INFECTIOUS DISEASE
- GLOBAL IMMUNOTHERAPY DRUGS MARKET BY END USER, 2020-2029, (USD BILLION), (THOUSAND UNITS)
- HOSPITAL
- CLINIC
- GLOBAL IMMUNOTHERAPY DRUGS MARKET BY REGION, 2020-2029, (USD BILLION), (THOUSAND UNITS)
- NORTH AMERICA
- US
- CANADA
- MEXICO
- SOUTH AMERICA
- BRAZIL
- ARGENTINA
- COLOMBIA
- REST OF SOUTH AMERICA
- EUROPE
- GERMANY
- UK
- FRANCE
- ITALY
- SPAIN
- RUSSIA
- REST OF EUROPE
- ASIA PACIFIC
- INDIA
- CHINA
- JAPAN
- SOUTH KOREA
- AUSTRALIA
- SOUTH-EAST ASIA
- REST OF ASIA PACIFIC
- MIDDLE EAST AND AFRICA
- UAE
- SAUDI ARABIA
- SOUTH AFRICA
- REST OF MIDDLE EAST AND AFRICA
- NORTH AMERICA
9. COMPANY PROFILES* (BUSINESS OVERVIEW, COMPANY SNAPSHOT, PRODUCTS OFFERED, RECENT DEVELOPMENTS)
- AMGEN INC.
- NOVARTIS AG
- ABBVIE INC.
- PFIZER INC.
- NEXTERA AS
- JOHNSON & JOHNSON SERVICES INC.
- ASTRAZENECA
- GSK
- SANOFI
- BIOMUNEX PHARMACEUTICALS *THE COMPANY LIST IS INDICATIVE
LIST OF TABLES
TABLE 1 GLOBAL IMMUNOTHERAPY DRUGS MARKET BY TYPE (USD BILLION) 2020-2029
TABLE 2 GLOBAL IMMUNOTHERAPY DRUGS MARKET BY TYPE (THOUSAND UNITS) 2020-2029
TABLE 3 GLOBAL IMMUNOTHERAPY DRUGS MARKET BY THERAPY AREA (USD BILLION) 2020-2029
TABLE 4 GLOBAL IMMUNOTHERAPY DRUGS MARKET BY THERAPY AREA (THOUSAND UNITS) 2020-2029
TABLE 5 GLOBAL IMMUNOTHERAPY DRUGS MARKET BY END USER (USD BILLION) 2020-2029
TABLE 6 GLOBAL IMMUNOTHERAPY DRUGS MARKET BY END USER (THOUSAND UNITS) 2020-2029
TABLE 7 GLOBAL IMMUNOTHERAPY DRUGS MARKET BY REGION (USD BILLION) 2020-2029
TABLE 8 GLOBAL IMMUNOTHERAPY DRUGS MARKET BY REGION (THOUSAND UNITS) 2020-2029
TABLE 9 NORTH AMERICA IMMUNOTHERAPY DRUGS MARKET BY COUNTRY (USD BILLION) 2020-2029
TABLE 10 NORTH AMERICA IMMUNOTHERAPY DRUGS MARKET BY COUNTRY (THOUSAND UNITS) 2020-2029
TABLE 11 NORTH AMERICA IMMUNOTHERAPY DRUGS MARKET BY TYPE (USD BILLION) 2020-2029
TABLE 12 NORTH AMERICA IMMUNOTHERAPY DRUGS MARKET BY TYPE (THOUSAND UNITS) 2020-2029
TABLE 13 NORTH AMERICA IMMUNOTHERAPY DRUGS MARKET BY THERAPY AREA (USD BILLION) 2020-2029
TABLE 14 NORTH AMERICA IMMUNOTHERAPY DRUGS MARKET BY THERAPY AREA (THOUSAND UNITS) 2020-2029
TABLE 15 NORTH AMERICA IMMUNOTHERAPY DRUGS MARKET BY END USER (USD BILLION) 2020-2029
TABLE 16 NORTH AMERICA IMMUNOTHERAPY DRUGS MARKET BY END USER (THOUSAND UNITS) 2020-2029
TABLE 17 US IMMUNOTHERAPY DRUGS MARKET BY TYPE (USD BILLION) 2020-2029
TABLE 18 US IMMUNOTHERAPY DRUGS MARKET BY TYPE (THOUSAND UNITS) 2020-2029
TABLE 19 US IMMUNOTHERAPY DRUGS MARKET BY THERAPY AREA (USD BILLION) 2020-2029
TABLE 20 US IMMUNOTHERAPY DRUGS MARKET BY THERAPY AREA (THOUSAND UNITS) 2020-2029
TABLE 21 US IMMUNOTHERAPY DRUGS MARKET BY END USER (USD BILLION) 2020-2029
TABLE 22 US IMMUNOTHERAPY DRUGS MARKET BY END USER (THOUSAND UNITS) 2020-2029
TABLE 23 CANADA IMMUNOTHERAPY DRUGS MARKET BY TYPE (USD BILLION) 2020-2029
TABLE 24 CANADA IMMUNOTHERAPY DRUGS MARKET BY TYPE (THOUSAND UNITS) 2020-2029
TABLE 25 CANADA IMMUNOTHERAPY DRUGS MARKET BY THERAPY AREA (USD BILLION) 2020-2029
TABLE 26 CANADA IMMUNOTHERAPY DRUGS MARKET BY THERAPY AREA (THOUSAND UNITS) 2020-2029
TABLE 27 CANADA IMMUNOTHERAPY DRUGS MARKET BY END USER (USD BILLION) 2020-2029
TABLE 28 CANADA IMMUNOTHERAPY DRUGS MARKET BY END USER (THOUSAND UNITS) 2020-2029
TABLE 29 MEXICO IMMUNOTHERAPY DRUGS MARKET BY TYPE (USD BILLION) 2020-2029
TABLE 30 MEXICO IMMUNOTHERAPY DRUGS MARKET BY TYPE (THOUSAND UNITS) 2020-2029
TABLE 31 MEXICO IMMUNOTHERAPY DRUGS MARKET BY THERAPY AREA (USD BILLION) 2020-2029
TABLE 32 MEXICO IMMUNOTHERAPY DRUGS MARKET BY THERAPY AREA (THOUSAND UNITS) 2020-2029
TABLE 33 MEXICO IMMUNOTHERAPY DRUGS MARKET BY END USER (USD BILLION) 2020-2029
TABLE 34 MEXICO IMMUNOTHERAPY DRUGS MARKET BY END USER (THOUSAND UNITS) 2020-2029
TABLE 35 SOUTH AMERICA IMMUNOTHERAPY DRUGS MARKET BY COUNTRY (USD BILLION) 2020-2029
TABLE 36 SOUTH AMERICA IMMUNOTHERAPY DRUGS MARKET BY COUNTRY (THOUSAND UNITS) 2020-2029
TABLE 37 SOUTH AMERICA IMMUNOTHERAPY DRUGS MARKET BY TYPE (USD BILLION) 2020-2029
TABLE 38 SOUTH AMERICA IMMUNOTHERAPY DRUGS MARKET BY TYPE (THOUSAND UNITS) 2020-2029
TABLE 39 SOUTH AMERICA IMMUNOTHERAPY DRUGS MARKET BY THERAPY AREA (USD BILLION) 2020-2029
TABLE 40 SOUTH AMERICA IMMUNOTHERAPY DRUGS MARKET BY THERAPY AREA (THOUSAND UNITS) 2020-2029
TABLE 41 SOUTH AMERICA IMMUNOTHERAPY DRUGS MARKET BY END USER (USD BILLION) 2020-2029
TABLE 42 SOUTH AMERICA IMMUNOTHERAPY DRUGS MARKET BY END USER (THOUSAND UNITS) 2020-2029
TABLE 43 BRAZIL IMMUNOTHERAPY DRUGS MARKET BY TYPE (USD BILLION) 2020-2029
TABLE 44 BRAZIL IMMUNOTHERAPY DRUGS MARKET BY TYPE (THOUSAND UNITS) 2020-2029
TABLE 45 BRAZIL IMMUNOTHERAPY DRUGS MARKET BY THERAPY AREA (USD BILLION) 2020-2029
TABLE 46 BRAZIL IMMUNOTHERAPY DRUGS MARKET BY THERAPY AREA (THOUSAND UNITS) 2020-2029
TABLE 47 BRAZIL IMMUNOTHERAPY DRUGS MARKET BY END USER (USD BILLION) 2020-2029
TABLE 48 BRAZIL IMMUNOTHERAPY DRUGS MARKET BY END USER (THOUSAND UNITS) 2020-2029
TABLE 49 ARGENTINA IMMUNOTHERAPY DRUGS MARKET BY TYPE (USD BILLION) 2020-2029
TABLE 50 ARGENTINA IMMUNOTHERAPY DRUGS MARKET BY TYPE (THOUSAND UNITS) 2020-2029
TABLE 51 ARGENTINA IMMUNOTHERAPY DRUGS MARKET BY THERAPY AREA (USD BILLION) 2020-2029
TABLE 52 ARGENTINA IMMUNOTHERAPY DRUGS MARKET BY THERAPY AREA (THOUSAND UNITS) 2020-2029
TABLE 53 ARGENTINA IMMUNOTHERAPY DRUGS MARKET BY END USER (USD BILLION) 2020-2029
TABLE 54 ARGENTINA IMMUNOTHERAPY DRUGS MARKET BY END USER (THOUSAND UNITS) 2020-2029
TABLE 55 COLOMBIA IMMUNOTHERAPY DRUGS MARKET BY TYPE (USD BILLION) 2020-2029
TABLE 56 COLOMBIA IMMUNOTHERAPY DRUGS MARKET BY TYPE (THOUSAND UNITS) 2020-2029
TABLE 57 COLOMBIA IMMUNOTHERAPY DRUGS MARKET BY THERAPY AREA (USD BILLION) 2020-2029
TABLE 58 COLOMBIA IMMUNOTHERAPY DRUGS MARKET BY THERAPY AREA (THOUSAND UNITS) 2020-2029
TABLE 59 COLOMBIA IMMUNOTHERAPY DRUGS MARKET BY END USER (USD BILLION) 2020-2029
TABLE 60 COLOMBIA IMMUNOTHERAPY DRUGS MARKET BY END USER (THOUSAND UNITS) 2020-2029
TABLE 61 REST OF SOUTH AMERICA IMMUNOTHERAPY DRUGS MARKET BY TYPE (USD BILLION) 2020-2029
TABLE 62 REST OF SOUTH AMERICA IMMUNOTHERAPY DRUGS MARKET BY TYPE (THOUSAND UNITS) 2020-2029
TABLE 63 REST OF SOUTH AMERICA IMMUNOTHERAPY DRUGS MARKET BY THERAPY AREA (USD BILLION) 2020-2029
TABLE 64 REST OF SOUTH AMERICA IMMUNOTHERAPY DRUGS MARKET BY THERAPY AREA (THOUSAND UNITS) 2020-2029
TABLE 65 REST OF SOUTH AMERICA IMMUNOTHERAPY DRUGS MARKET BY END USER (USD BILLION) 2020-2029
TABLE 66 REST OF SOUTH AMERICA IMMUNOTHERAPY DRUGS MARKET BY END USER (THOUSAND UNITS) 2020-2029
TABLE 67 ASIA-PACIFIC IMMUNOTHERAPY DRUGS MARKET BY COUNTRY (USD BILLION) 2020-2029
TABLE 68 ASIA-PACIFIC IMMUNOTHERAPY DRUGS MARKET BY COUNTRY (THOUSAND UNITS) 2020-2029
TABLE 69 ASIA-PACIFIC IMMUNOTHERAPY DRUGS MARKET BY TYPE (USD BILLION) 2020-2029
TABLE 70 ASIA-PACIFIC IMMUNOTHERAPY DRUGS MARKET BY TYPE (THOUSAND UNITS) 2020-2029
TABLE 71 ASIA-PACIFIC IMMUNOTHERAPY DRUGS MARKET BY THERAPY AREA (USD BILLION) 2020-2029
TABLE 72 ASIA-PACIFIC IMMUNOTHERAPY DRUGS MARKET BY THERAPY AREA (THOUSAND UNITS) 2020-2029
TABLE 73 ASIA-PACIFIC IMMUNOTHERAPY DRUGS MARKET BY END USER (USD BILLION) 2020-2029
TABLE 74 ASIA-PACIFIC IMMUNOTHERAPY DRUGS MARKET BY END USER (THOUSAND UNITS) 2020-2029
TABLE 75 INDIA IMMUNOTHERAPY DRUGS MARKET BY TYPE (USD BILLION) 2020-2029
TABLE 76 INDIA IMMUNOTHERAPY DRUGS MARKET BY TYPE (THOUSAND UNITS) 2020-2029
TABLE 77 INDIA IMMUNOTHERAPY DRUGS MARKET BY THERAPY AREA (USD BILLION) 2020-2029
TABLE 78 INDIA IMMUNOTHERAPY DRUGS MARKET BY THERAPY AREA (THOUSAND UNITS) 2020-2029
TABLE 79 INDIA IMMUNOTHERAPY DRUGS MARKET BY END USER (USD BILLION) 2020-2029
TABLE 80 INDIA IMMUNOTHERAPY DRUGS MARKET BY END USER (THOUSAND UNITS) 2020-2029
TABLE 81 CHINA IMMUNOTHERAPY DRUGS MARKET BY TYPE (USD BILLION) 2020-2029
TABLE 82 CHINA IMMUNOTHERAPY DRUGS MARKET BY TYPE (THOUSAND UNITS) 2020-2029
TABLE 83 CHINA IMMUNOTHERAPY DRUGS MARKET BY THERAPY AREA (USD BILLION) 2020-2029
TABLE 84 CHINA IMMUNOTHERAPY DRUGS MARKET BY THERAPY AREA (THOUSAND UNITS) 2020-2029
TABLE 85 CHINA IMMUNOTHERAPY DRUGS MARKET BY END USER (USD BILLION) 2020-2029
TABLE 86 CHINA IMMUNOTHERAPY DRUGS MARKET BY END USER (THOUSAND UNITS) 2020-2029
TABLE 87 JAPAN IMMUNOTHERAPY DRUGS MARKET BY TYPE (USD BILLION) 2020-2029
TABLE 88 JAPAN IMMUNOTHERAPY DRUGS MARKET BY TYPE (THOUSAND UNITS) 2020-2029
TABLE 89 JAPAN IMMUNOTHERAPY DRUGS MARKET BY THERAPY AREA (USD BILLION) 2020-2029
TABLE 90 JAPAN IMMUNOTHERAPY DRUGS MARKET BY THERAPY AREA (THOUSAND UNITS) 2020-2029
TABLE 91 JAPAN IMMUNOTHERAPY DRUGS MARKET BY END USER (USD BILLION) 2020-2029
TABLE 92 JAPAN IMMUNOTHERAPY DRUGS MARKET BY END USER (THOUSAND UNITS) 2020-2029
TABLE 93 SOUTH KOREA IMMUNOTHERAPY DRUGS MARKET BY TYPE (USD BILLION) 2020-2029
TABLE 94 SOUTH KOREA IMMUNOTHERAPY DRUGS MARKET BY TYPE (THOUSAND UNITS) 2020-2029
TABLE 95 SOUTH KOREA IMMUNOTHERAPY DRUGS MARKET BY THERAPY AREA (USD BILLION) 2020-2029
TABLE 96 SOUTH KOREA IMMUNOTHERAPY DRUGS MARKET BY THERAPY AREA (THOUSAND UNITS) 2020-2029
TABLE 97 SOUTH KOREA IMMUNOTHERAPY DRUGS MARKET BY END USER (USD BILLION) 2020-2029
TABLE 98 SOUTH KOREA IMMUNOTHERAPY DRUGS MARKET BY END USER (THOUSAND UNITS) 2020-2029
TABLE 99 AUSTRALIA IMMUNOTHERAPY DRUGS MARKET BY TYPE (USD BILLION) 2020-2029
TABLE 100 AUSTRALIA IMMUNOTHERAPY DRUGS MARKET BY TYPE (THOUSAND UNITS) 2020-2029
TABLE 101 AUSTRALIA IMMUNOTHERAPY DRUGS MARKET BY THERAPY AREA (USD BILLION) 2020-2029
TABLE 102 AUSTRALIA IMMUNOTHERAPY DRUGS MARKET BY THERAPY AREA (THOUSAND UNITS) 2020-2029
TABLE 103 AUSTRALIA IMMUNOTHERAPY DRUGS MARKET BY END USER (USD BILLION) 2020-2029
TABLE 104 AUSTRALIA IMMUNOTHERAPY DRUGS MARKET BY END USER (THOUSAND UNITS) 2020-2029
TABLE 105 SOUTH-EAST ASIA IMMUNOTHERAPY DRUGS MARKET BY TYPE (USD BILLION) 2020-2029
TABLE 106 SOUTH-EAST ASIA IMMUNOTHERAPY DRUGS MARKET BY TYPE (THOUSAND UNITS) 2020-2029
TABLE 107 SOUTH-EAST ASIA IMMUNOTHERAPY DRUGS MARKET BY THERAPY AREA (USD BILLION) 2020-2029
TABLE 108 SOUTH-EAST ASIA IMMUNOTHERAPY DRUGS MARKET BY THERAPY AREA (THOUSAND UNITS) 2020-2029
TABLE 109 SOUTH-EAST ASIA IMMUNOTHERAPY DRUGS MARKET BY END USER (USD BILLION) 2020-2029
TABLE 110 SOUTH-EAST ASIA IMMUNOTHERAPY DRUGS MARKET BY END USER (THOUSAND UNITS) 2020-2029
TABLE 111 REST OF ASIA PACIFIC IMMUNOTHERAPY DRUGS MARKET BY TYPE (USD BILLION) 2020-2029
TABLE 112 REST OF ASIA PACIFIC IMMUNOTHERAPY DRUGS MARKET BY TYPE (THOUSAND UNITS) 2020-2029
TABLE 113 REST OF ASIA PACIFIC IMMUNOTHERAPY DRUGS MARKET BY THERAPY AREA (USD BILLION) 2020-2029
TABLE 114 REST OF ASIA PACIFIC IMMUNOTHERAPY DRUGS MARKET BY THERAPY AREA (THOUSAND UNITS) 2020-2029
TABLE 115 REST OF ASIA PACIFIC IMMUNOTHERAPY DRUGS MARKET BY END USER (USD BILLION) 2020-2029
TABLE 116 REST OF ASIA PACIFIC IMMUNOTHERAPY DRUGS MARKET BY END USER (THOUSAND UNITS) 2020-2029
TABLE 117 EUROPE IMMUNOTHERAPY DRUGS MARKET BY COUNTRY (USD BILLION) 2020-2029
TABLE 118 EUROPE IMMUNOTHERAPY DRUGS MARKET BY COUNTRY (THOUSAND UNITS) 2020-2029
TABLE 119 ASIA-PACIFIC IMMUNOTHERAPY DRUGS MARKET BY TYPE (USD BILLION) 2020-2029
TABLE 120 ASIA-PACIFIC IMMUNOTHERAPY DRUGS MARKET BY TYPE (THOUSAND UNITS) 2020-2029
TABLE 121 ASIA-PACIFIC IMMUNOTHERAPY DRUGS MARKET BY THERAPY AREA (USD BILLION) 2020-2029
TABLE 122 ASIA-PACIFIC IMMUNOTHERAPY DRUGS MARKET BY THERAPY AREA (THOUSAND UNITS) 2020-2029
TABLE 123 ASIA-PACIFIC IMMUNOTHERAPY DRUGS MARKET BY END USER (USD BILLION) 2020-2029
TABLE 124 ASIA-PACIFIC IMMUNOTHERAPY DRUGS MARKET BY END USER (THOUSAND UNITS) 2020-2029
TABLE 125 GERMANY IMMUNOTHERAPY DRUGS MARKET BY TYPE (USD BILLION) 2020-2029
TABLE 126 GERMANY IMMUNOTHERAPY DRUGS MARKET BY TYPE (THOUSAND UNITS) 2020-2029
TABLE 127 GERMANY IMMUNOTHERAPY DRUGS MARKET BY THERAPY AREA (USD BILLION) 2020-2029
TABLE 128 GERMANY IMMUNOTHERAPY DRUGS MARKET BY THERAPY AREA (THOUSAND UNITS) 2020-2029
TABLE 129 GERMANY IMMUNOTHERAPY DRUGS MARKET BY END USER (USD BILLION) 2020-2029
TABLE 130 GERMANY IMMUNOTHERAPY DRUGS MARKET BY END USER (THOUSAND UNITS) 2020-2029
TABLE 131 UK IMMUNOTHERAPY DRUGS MARKET BY TYPE (USD BILLION) 2020-2029
TABLE 132 UK IMMUNOTHERAPY DRUGS MARKET BY TYPE (THOUSAND UNITS) 2020-2029
TABLE 133 UK IMMUNOTHERAPY DRUGS MARKET BY THERAPY AREA (USD BILLION) 2020-2029
TABLE 134 UK IMMUNOTHERAPY DRUGS MARKET BY THERAPY AREA (THOUSAND UNITS) 2020-2029
TABLE 135 UK IMMUNOTHERAPY DRUGS MARKET BY END USER (USD BILLION) 2020-2029
TABLE 136 UK IMMUNOTHERAPY DRUGS MARKET BY END USER (THOUSAND UNITS) 2020-2029
TABLE 137 FRANCE IMMUNOTHERAPY DRUGS MARKET BY TYPE (USD BILLION) 2020-2029
TABLE 138 FRANCE IMMUNOTHERAPY DRUGS MARKET BY TYPE (THOUSAND UNITS) 2020-2029
TABLE 139 FRANCE IMMUNOTHERAPY DRUGS MARKET BY THERAPY AREA (USD BILLION) 2020-2029
TABLE 140 FRANCE IMMUNOTHERAPY DRUGS MARKET BY THERAPY AREA (THOUSAND UNITS) 2020-2029
TABLE 141 FRANCE IMMUNOTHERAPY DRUGS MARKET BY END USER (USD BILLION) 2020-2029
TABLE 142 FRANCE IMMUNOTHERAPY DRUGS MARKET BY END USER (THOUSAND UNITS) 2020-2029
TABLE 143 ITALY IMMUNOTHERAPY DRUGS MARKET BY TYPE (USD BILLION) 2020-2029
TABLE 144 ITALY IMMUNOTHERAPY DRUGS MARKET BY TYPE (THOUSAND UNITS) 2020-2029
TABLE 145 ITALY IMMUNOTHERAPY DRUGS MARKET BY THERAPY AREA (USD BILLION) 2020-2029
TABLE 146 ITALY IMMUNOTHERAPY DRUGS MARKET BY THERAPY AREA (THOUSAND UNITS) 2020-2029
TABLE 147 ITALY IMMUNOTHERAPY DRUGS MARKET BY END USER (USD BILLION) 2020-2029
TABLE 148 ITALY IMMUNOTHERAPY DRUGS MARKET BY END USER (THOUSAND UNITS) 2020-2029
TABLE 149 SPAIN IMMUNOTHERAPY DRUGS MARKET BY TYPE (USD BILLION) 2020-2029
TABLE 150 SPAIN IMMUNOTHERAPY DRUGS MARKET BY TYPE (THOUSAND UNITS) 2020-2029
TABLE 151 SPAIN IMMUNOTHERAPY DRUGS MARKET BY THERAPY AREA (USD BILLION) 2020-2029
TABLE 152 SPAIN IMMUNOTHERAPY DRUGS MARKET BY THERAPY AREA (THOUSAND UNITS) 2020-2029
TABLE 153 SPAIN IMMUNOTHERAPY DRUGS MARKET BY END USER (USD BILLION) 2020-2029
TABLE 154 SPAIN IMMUNOTHERAPY DRUGS MARKET BY END USER (THOUSAND UNITS) 2020-2029
TABLE 155 RUSSIA IMMUNOTHERAPY DRUGS MARKET BY TYPE (USD BILLION) 2020-2029
TABLE 156 RUSSIA IMMUNOTHERAPY DRUGS MARKET BY TYPE (THOUSAND UNITS) 2020-2029
TABLE 157 RUSSIA IMMUNOTHERAPY DRUGS MARKET BY THERAPY AREA (USD BILLION) 2020-2029
TABLE 158 RUSSIA IMMUNOTHERAPY DRUGS MARKET BY THERAPY AREA (THOUSAND UNITS) 2020-2029
TABLE 159 RUSSIA IMMUNOTHERAPY DRUGS MARKET BY END USER (USD BILLION) 2020-2029
TABLE 160 RUSSIA IMMUNOTHERAPY DRUGS MARKET BY END USER (THOUSAND UNITS) 2020-2029
TABLE 161 REST OF EUROPE IMMUNOTHERAPY DRUGS MARKET BY TYPE (USD BILLION) 2020-2029
TABLE 162 REST OF EUROPE IMMUNOTHERAPY DRUGS MARKET BY TYPE (THOUSAND UNITS) 2020-2029
TABLE 163 REST OF EUROPE IMMUNOTHERAPY DRUGS MARKET BY THERAPY AREA (USD BILLION) 2020-2029
TABLE 164 REST OF EUROPE IMMUNOTHERAPY DRUGS MARKET BY THERAPY AREA (THOUSAND UNITS) 2020-2029
TABLE 165 REST OF EUROPE IMMUNOTHERAPY DRUGS MARKET BY END USER (USD BILLION) 2020-2029
TABLE 166 REST OF EUROPE IMMUNOTHERAPY DRUGS MARKET BY END USER (THOUSAND UNITS) 2020-2029
TABLE 167 MIDDLE EAST AND AFRICA IMMUNOTHERAPY DRUGS MARKET BY COUNTRY (USD BILLION) 2020-2029
TABLE 168 MIDDLE EAST AND AFRICA IMMUNOTHERAPY DRUGS MARKET BY COUNTRY (THOUSAND UNITS) 2020-2029
TABLE 169 MIDDLE EAST AND AFRICA IMMUNOTHERAPY DRUGS MARKET BY TYPE (USD BILLION) 2020-2029
TABLE 170 MIDDLE EAST AND AFRICA IMMUNOTHERAPY DRUGS MARKET BY TYPE (THOUSAND UNITS) 2020-2029
TABLE 171 MIDDLE EAST AND AFRICA IMMUNOTHERAPY DRUGS MARKET BY THERAPY AREA (USD BILLION) 2020-2029
TABLE 172 MIDDLE EAST AND AFRICA IMMUNOTHERAPY DRUGS MARKET BY THERAPY AREA (THOUSAND UNITS) 2020-2029
TABLE 173 MIDDLE EAST AND AFRICA IMMUNOTHERAPY DRUGS MARKET BY END USER (USD BILLION) 2020-2029
TABLE 174 MIDDLE EAST AND AFRICA IMMUNOTHERAPY DRUGS MARKET BY END USER (THOUSAND UNITS) 2020-2029
TABLE 175 UAE IMMUNOTHERAPY DRUGS MARKET BY TYPE (USD BILLION) 2020-2029
TABLE 176 UAE IMMUNOTHERAPY DRUGS MARKET BY TYPE (THOUSAND UNITS) 2020-2029
TABLE 177 UAE IMMUNOTHERAPY DRUGS MARKET BY THERAPY AREA (USD BILLION) 2020-2029
TABLE 178 UAE IMMUNOTHERAPY DRUGS MARKET BY THERAPY AREA (THOUSAND UNITS) 2020-2029
TABLE 179 UAE IMMUNOTHERAPY DRUGS MARKET BY END USER (USD BILLION) 2020-2029
TABLE 180 UAE IMMUNOTHERAPY DRUGS MARKET BY END USER (THOUSAND UNITS) 2020-2029
TABLE 181 SAUDI ARABIA IMMUNOTHERAPY DRUGS MARKET BY TYPE (USD BILLION) 2020-2029
TABLE 182 SAUDI ARABIA IMMUNOTHERAPY DRUGS MARKET BY TYPE (THOUSAND UNITS) 2020-2029
TABLE 183 SAUDI ARABIA IMMUNOTHERAPY DRUGS MARKET BY THERAPY AREA (USD BILLION) 2020-2029
TABLE 184 SAUDI ARABIA IMMUNOTHERAPY DRUGS MARKET BY THERAPY AREA (THOUSAND UNITS) 2020-2029
TABLE 185 SAUDI ARABIA IMMUNOTHERAPY DRUGS MARKET BY END USER (USD BILLION) 2020-2029
TABLE 186 SAUDI ARABIA IMMUNOTHERAPY DRUGS MARKET BY END USER (THOUSAND UNITS) 2020-2029
TABLE 187 SOUTH AFRICA IMMUNOTHERAPY DRUGS MARKET BY TYPE (USD BILLION) 2020-2029
TABLE 188 SOUTH AFRICA IMMUNOTHERAPY DRUGS MARKET BY TYPE (THOUSAND UNITS) 2020-2029
TABLE 189 SOUTH AFRICA IMMUNOTHERAPY DRUGS MARKET BY THERAPY AREA (USD BILLION) 2020-2029
TABLE 190 SOUTH AFRICA IMMUNOTHERAPY DRUGS MARKET BY THERAPY AREA (THOUSAND UNITS) 2020-2029
TABLE 191 SOUTH AFRICA IMMUNOTHERAPY DRUGS MARKET BY END USER (USD BILLION) 2020-2029
TABLE 192 SOUTH AFRICA IMMUNOTHERAPY DRUGS MARKET BY END USER (THOUSAND UNITS) 2020-2029
TABLE 193 REST OF MIDDLE EAST AND AFRICA IMMUNOTHERAPY DRUGS MARKET BY TYPE (USD BILLION) 2020-2029
TABLE 194 REST OF MIDDLE EAST AND AFRICA IMMUNOTHERAPY DRUGS MARKET BY TYPE (THOUSAND UNITS) 2020-2029
TABLE 195 REST OF MIDDLE EAST AND AFRICA IMMUNOTHERAPY DRUGS MARKET BY THERAPY AREA (USD BILLION) 2020-2029
TABLE 196 REST OF MIDDLE EAST AND AFRICA IMMUNOTHERAPY DRUGS MARKET BY THERAPY AREA (THOUSAND UNITS) 2020-2029
TABLE 197 REST OF MIDDLE EAST AND AFRICA IMMUNOTHERAPY DRUGS MARKET BY END USER (USD BILLION) 2020-2029
TABLE 198 REST OF MIDDLE EAST AND AFRICA IMMUNOTHERAPY DRUGS MARKET BY END USER (THOUSAND UNITS) 2020-2029
LIST OF FIGURES
FIGURE 1 MARKET DYNAMICS
FIGURE 2 MARKET SEGMENTATION
FIGURE 3 REPORT TIMELINES: YEARS CONSIDERED
FIGURE 4 DATA TRIANGULATION
FIGURE 5 BOTTOM-UP APPROACH
FIGURE 6 TOP-DOWN APPROACH
FIGURE 7 RESEARCH FLOW
FIGURE 8 GLOBAL IMMUNOTHERAPY DRUGS MARKET BY TYPE, USD BILLION, 2020-2029
FIGURE 9 GLOBAL IMMUNOTHERAPY DRUGS MARKET BY THERAPY AREA, USD BILLION, 2020-2029
FIGURE 10 GLOBAL IMMUNOTHERAPY DRUGS MARKET BY END USER, USD BILLION, 2020-2029
FIGURE 11 GLOBAL IMMUNOTHERAPY DRUGS MARKET BY REGION, USD BILLION, 2020-2029
FIGURE 12 PORTER’S FIVE FORCES MODEL
FIGURE 13 GLOBAL IMMUNOTHERAPY DRUGS MARKET BY TYPE, USD BILLION, 2021
FIGURE 14 GLOBAL IMMUNOTHERAPY DRUGS MARKET BY THERAPY AREA, USD BILLION, 2021
FIGURE 15 GLOBAL IMMUNOTHERAPY DRUGS MARKET BY END USER, USD BILLION, 2021
FIGURE 16 GLOBAL IMMUNOTHERAPY DRUGS MARKET BY REGION, USD BILLION, 2021
FIGURE 17 NORTH AMERICA IMMUNOTHERAPY DRUGS MARKET SNAPSHOT
FIGURE 18 EUROPE IMMUNOTHERAPY DRUGS MARKET SNAPSHOT
FIGURE 19 SOUTH AMERICA IMMUNOTHERAPY DRUGS MARKET SNAPSHOT
FIGURE 20 ASIA PACIFIC IMMUNOTHERAPY DRUGS MARKET SNAPSHOT
FIGURE 21 MIDDLE EAST ASIA AND AFRICA IMMUNOTHERAPY DRUGS MARKET SNAPSHOT
FIGURE 22 MARKET SHARE ANALYSIS
FIGURE 23 AMGEN: COMPANY SNAPSHOT
FIGURE 24 NOVARTIS AG: COMPANY SNAPSHOT
FIGURE 25 ABBVIE INC.: COMPANY SNAPSHOT
FIGURE 26 PFIZER INC.: COMPANY SNAPSHOT
FIGURE 27 F. HOFFMAN-LA ROCHE LTD.: COMPANY SNAPSHOT
FIGURE 28 JOHNSON & JOHNSON SERVICES INC.: COMPANY SNAPSHOT
FIGURE 29 ASTAZENECA: COMPANY SNAPSHOT
FIGURE 30 GSK: COMPANY SNAPSHOT
FIGURE 31 SANOFI: COMPANY SNAPSHOT
FIGURE 32 BAYER AG: COMPANY SNAPSHOT
DOWNLOAD FREE SAMPLE REPORT
License Type
SPEAK WITH OUR ANALYST
Want to know more about the report or any specific requirement?
WANT TO CUSTOMIZE THE REPORT?
Our Clients Speak
We asked them to research ‘ Equipment market’ all over the world, and their whole arrangement was helpful to us. thehealthanalytics.com insightful analysis and reports contributed to our current analysis and in creating a future strategy. Besides, the te
Yosuke Mitsui
Senior Associate Construction Equipment Sales & Marketing
We asked them to research ‘Equipment market’ all over the world, and their whole arrangement was helpful to us. thehealthanalytics.com insightful analysis and reports contributed to our current analysis and in creating a future strategy. Besides, the te


