

Base Year Value ()
x.x %
x.x %
CAGR ()
x.x %
x.x %
Forecast Year Value ()
x.x %
x.x %
Historical Data Period
Largest Region
Forecast Period
Spiral membrane Market By Polymer Type (Polyamide, PS & PES, Fluoropolymers), By Technology (Reverse Osmosis, Microfiltration, Ultrafiltration, Nanofiltration), By End User Industry (Water & Wastewater Treatment, Industry Processing, Food & Beverage Processing, Pharmaceutical & Medical, Others) and Region, Global trends and forecast from 2022 to 2029
Instant access to hundreds of data points and trends
- Market estimates from 2014-2029
- Competitive analysis, industry segmentation, financial benchmarks
- Incorporates SWOT, Porter's Five Forces and risk management frameworks
- PDF report or online database with Word, Excel and PowerPoint export options
- 100% money back guarantee
Spiral membrane Market Overview
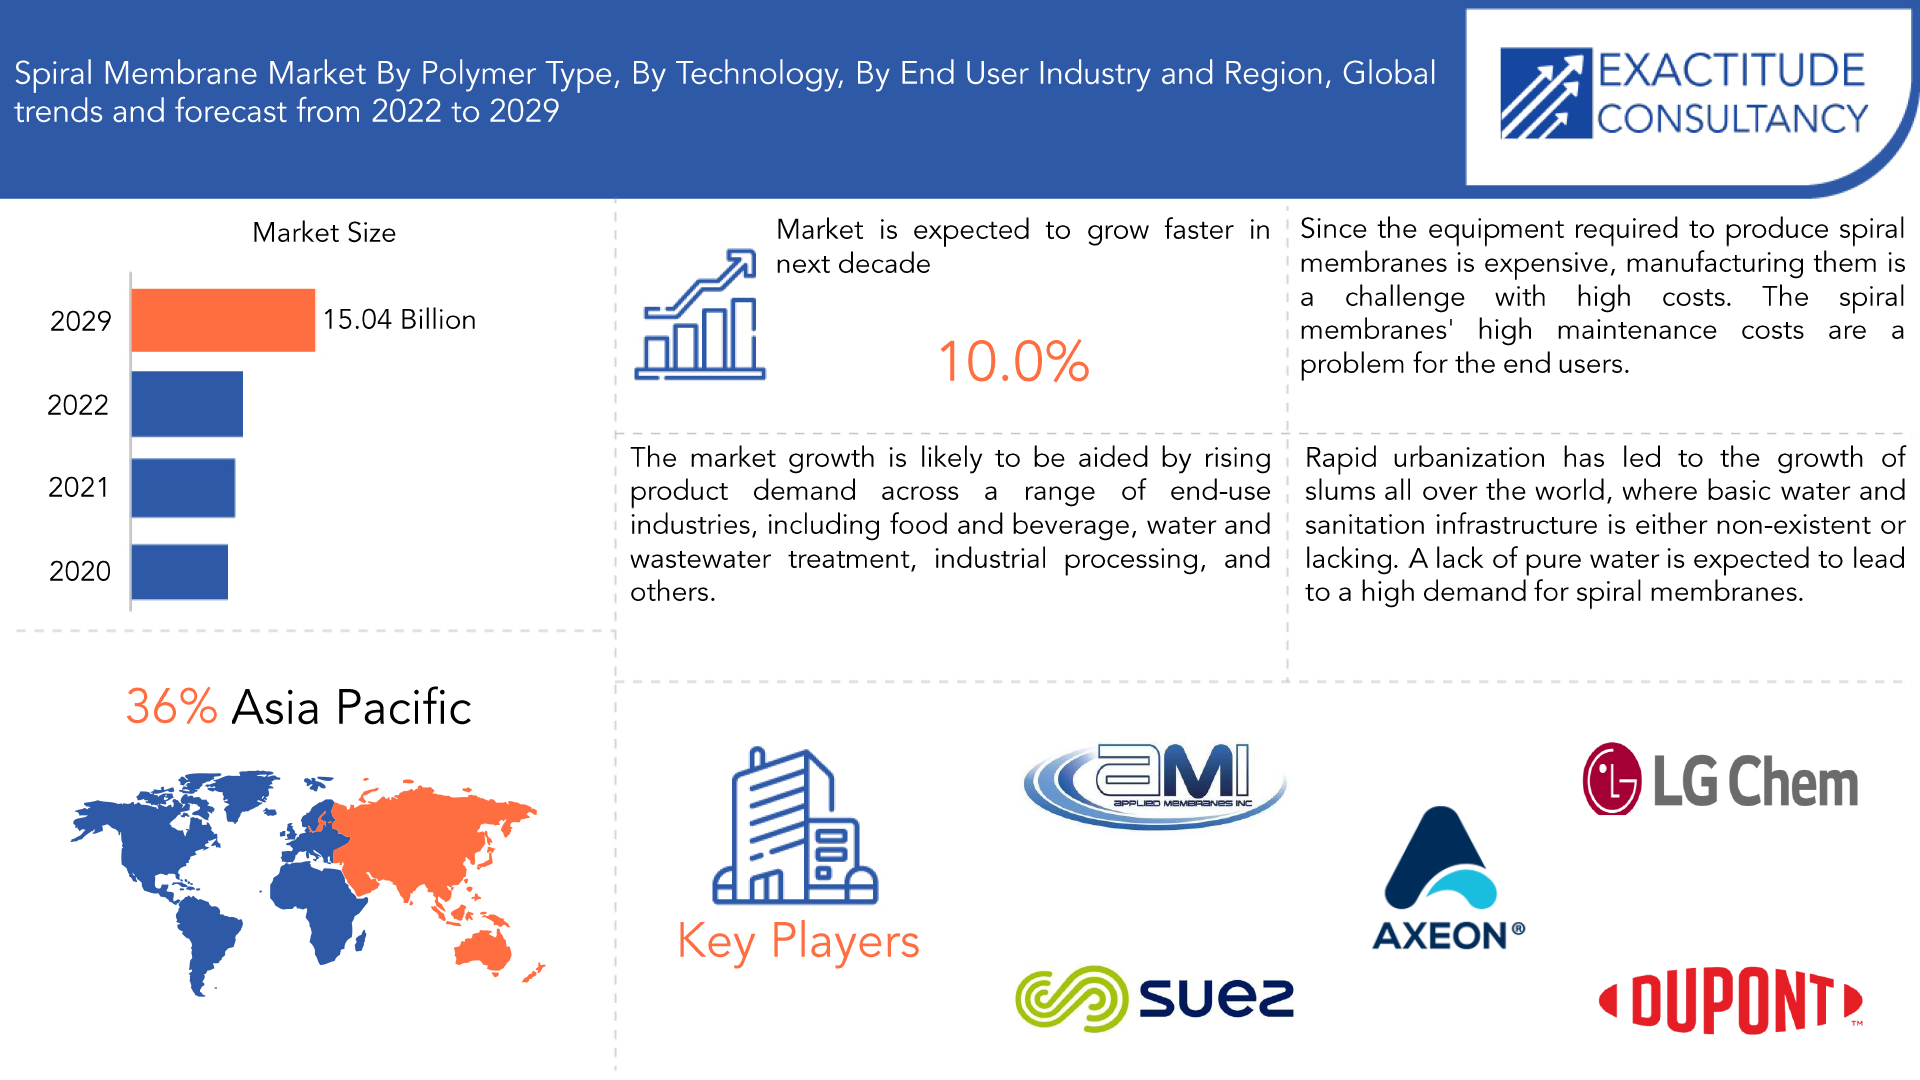
The Spiral membrane market is expected to grow at 10% CAGR from 2022 to 2029. It is expected to reach above USD 15.04 billion by 2029 from USD 6.38 billion in 2020.
Spiral membrane is curve around a central core in a filter media known as circular membrane, which is densely packed. A spacer material is used to seal and close the filter's edges so that liquids can flow through them. Due to its high membrane and compact design, it is perfect for applications involving high-flow liquids. Filtration occurs when lower back pressure is applied to force clean water through the membrane surface. Water to be filtered enters the spiral membrane module from one end. Membranes, feed spacers, permeate spacers, and a permeate tube are all components of the spiral element. A feed spacer's function is to create a passageway for water to pass through between membrane surfaces and to enable even flow between membrane leaves.
The increasing adoption of spiral membranes is what is fueling the expansion of the global market for spiral membranes. Growing public awareness of water and wastewater treatment is driving this adoption. One of the key factors driving the growth of the global spiral membranes market is the necessity of selective separation for meeting water quality standards. The developing nations are enforcing strict environmental regulations, which may contribute to the positive growth of the global spiral membranes market.
| ATTRIBUTE | DETAILS |
| Study period | 2020-2029 |
| Base year | 2021 |
| Estimated year | 2022 |
| Forecasted year | 2022-2029 |
| Historical period | 2018-2020 |
| Unit | Value (USD BILLION) |
| Segmentation | By Polymer Type, By Technology, By End User Industry, By Region |
| By Polymer Type
|
|
| By Technology
|
|
| By End User Industry
|
|
| By Region
|
|
Over the past few years, a sizable portion of the market was made up by the food and beverage sector. The sector is anticipated to grow quickly over the course of the forecast period. For the concentration of whey protein, the concentration of lactose, the purification of sugar and water, the clarification of juice, and the treatment of wastewater, spiral membranes are used in more than 60% of applications in the food and beverage sector. In order to create premium juices, ultra- and nano-filtration is frequently used. Starch, pectin, proteins, and polyphenolic compounds can all be removed using ultra- and nanofiltration membranes. Microfiltration is a technique that can be used to get rid of microbes.
Since the equipment required to produce spiral membranes is expensive, manufacturing them is a challenge with high costs. Numerous end-use industries, primarily those dealing with water and wastewater treatment, food and beverage production, chemical production, and others, use spiral membranes. The high level of spiral element fouling in spiral membranes necessitates routine treatment, eradication, and cleaning. Due to additional expenses for handling, pre-treatment, foulant removal, and cleaning, spiral membranes have high operating costs for end users.
The spiral membrane market was hampered by the COVID-19 outbreak, which also affected global demand and production. The market's expansion was hampered by the lockdown restriction, manufacturing setbacks, supply chain issues, and logistical challenges. The food and beverage industries were troubled by the declining consumption brought on by the closure of hotels, grocery stores, and retail outlets, the disruption of the supply chain, and lockdown restrictions. The wastewater treatment industry was slowed down by the water sector's slow investments and reduced operations. As a result, the initial phase of COVID saw a short-term disturbance and declining growth in the global spiral membrane market.
One of the main factors propelling the market's expansion is the combination of rapid industrialization and the growing need for efficient water treatment solutions. Additionally, growing environmental worries about the discharge of untreated wastewater and rising water body contamination are driving market expansion.
[caption id="attachment_15358" align="aligncenter" width="1920"]
Frequently Asked Questions
• What is the worth of Spiral membrane market?
The Spiral membrane market size had crossed USD 6.38 billion in 2020 and will observe a CAGR of more than 10% up to 2029.
• What is the size of the Asia Pacific Spiral membrane industry?
Asia Pacific held more than 36% of the Spiral membrane market revenue share in 2021 and will witness expansion in the forecast period.
• What are some of the market's driving forces?
Drivers such as the presence of major rising product demand across a range of end-use industries, including food and beverage, water and wastewater treatment, industrial processing, and others
• Which are the top companies to hold the market share in Spiral membrane market?
Key players profiled in the report Alfa Laval AB, Applied Membranes Inc., Axeon Water Technologies, Dow Inc., DuPont de Nemours, Inc., Fileder Filter Systems Ltd., GEA Group Aktiengesellschaft, Hydranautics, Koch Separation Solutions Inc etc.
• What is the leading application of Spiral membrane market?
One of the key trends is the reverse osmosis technology. Polyamide nanofiltration membranes are frequently used in industrial processes like desalination, food processing, water purification, wastewater treatment, and bio-separation.
• Which is the largest regional market for Spiral membrane market?
The region's largest share is in Europe. Multiple manufacturers' presence in Europe has led to a sizable market share for the continent.
Spiral membrane Market Segment Analysis
The Spiral membrane market is segmented based on vehicle type, form type, application and Region, Global trends and forecast.By type, the market is bifurcated into polymer type (polyamide, PS & PES, fluoropolymers), by technology (reverse osmosis, microfiltration, ultrafiltration, nanofiltration) and by end-user industry (water & wastewater treatment, industry processing, food & beverage processing, pharmaceutical &, medical, others).
With more than 41% of the market share, polyamide was the most popular type of polymer in 2019. This polymer is expected to be in high demand for applications like water and wastewater treatment, industrial processing, and food and beverage processing due to its wide availability and low cost. Reverse osmosis and polyamide nanofiltration membranes are frequently used in industrial processes like desalination, food processing, water purification, wastewater treatment, and bio-separation. Superior strength and high resistance to oxidation are two features of PS and PES polymers. Furthermore, they are mainly employed in microfiltration and ultrafiltration techniques.
With a market share of more than 40% in 2019, the reverse osmosis technology segment is expected to continue to grow at a constant CAGR from 2020 to 2027. Water and wastewater are mainly purified using reverse osmosis. Additionally, it is employed in the creation of Ultrapure Water (UPW), the treatment of landfill leachates, and the desalination of seawater and brine water. In comparison to more conventional thermal desalination methods like Multistage Flash Distillation (MSF) and Multiple Effect Distillation (MED), reverse osmosis technology has a significantly higher recovery rate. As a result, this technology is quickly taking over at saltwater desalination plants around the globe from the thermal desalination method. Organic materials, such as polymer-based membranes, are used to create microfiltration membranes.
[caption id="attachment_15359" align="aligncenter" width="1920"]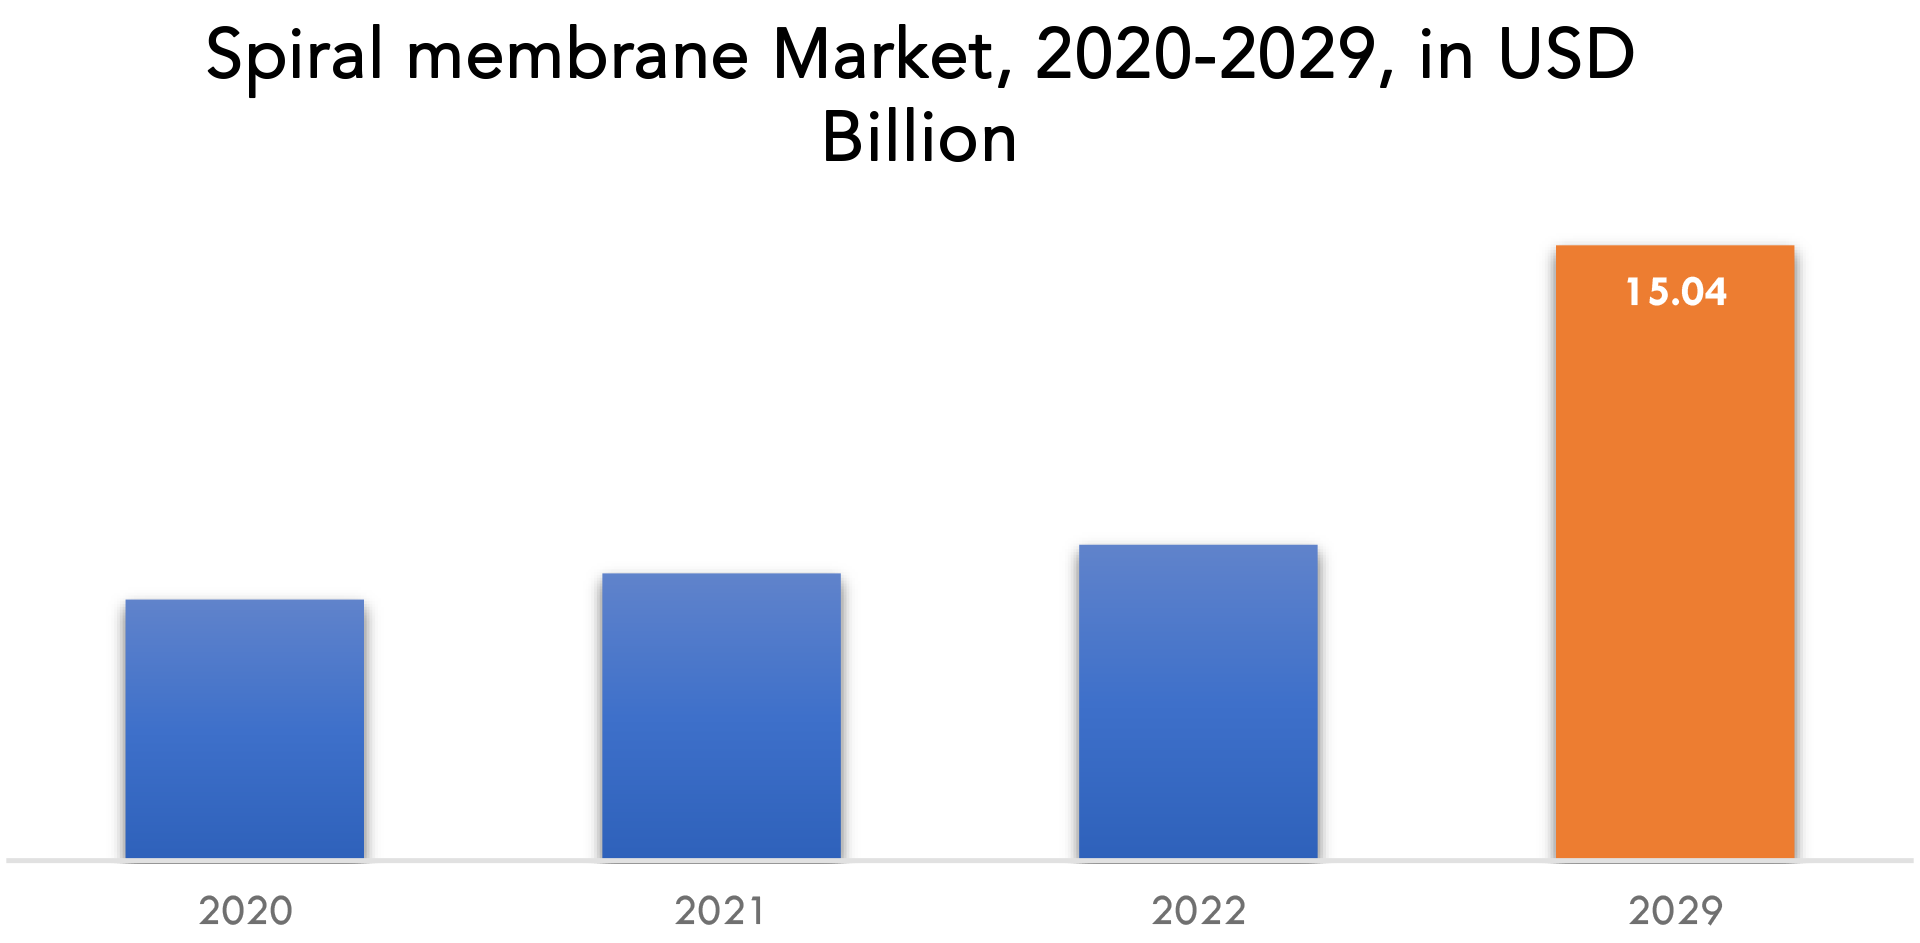
Spiral membrane Market Players
The Spiral membrane market key players include Alfa Laval AB, Applied Membranes Inc., Axeon Water Technologies, Dow Inc., DuPont de Nemours, Inc., Fileder Filter Systems Ltd., GEA Group Aktiengesellschaft, Hydranautics, Koch Separation Solutions Inc., LG Chem Ltd., Merck KGaA, Pall Corporation, Pentair Plc, SUEZ Water Technologies & Solutions and Toray Industries Inc. News: 24th January 2022: Alfa Laval membrane system generates value from waste. 24th January 2022: Hydrofarm and AXEON Water Technologies Enter Strategic Partnership. California-based water filtration manufacturer to distribute systems through Hydrofarm.Who Should Buy? Or Key stakeholders
- Spiral membrane Suppliers
- Raw Materials Manufacturers
- Research Organizations
- Investors
- End-users
- Government Authorities
- Consulting and Research Firm
- Others
Spiral membrane Regional Analysis
The Spiral membrane market by region includes North America, Asia-Pacific (APAC), Europe, South America, and Middle East & Africa (MEA).- North America: includes the US, Canada, Mexico
- Asia Pacific: includes China, Japan, South Korea, India, Australia, ASEAN and Rest of APAC
- Europe: includes UK, Germany, France, Italy, Spain, Russia, and Rest of Europe
- South America: includes Brazil, Argentina and Rest of South America
- Middle East & Africa: includes Turkey, UAE, Saudi Arabia, South Africa, and Rest of MEA
Asia Pacific dominated the global market, contributing more than 36% of global revenue. Due to its rapid industrialization and the escalating environmental concerns in its emerging economies, the region is predicted to continue to grow at the fastest CAGR from 2020 to 2027. Additionally, expanding government initiatives to build water and wastewater treatment facilities are anticipated to fuel market expansion.
Multiple manufacturers' presence in Europe has led to a sizable market share for the continent. Over the forecast period, it is anticipated that growth in Europe's water and wastewater treatment, food and beverage, and pharmaceutical industries will boost product demand. To better serve the larger customer base, distributors and industry players are working together.
Environmental pollution is anticipated to increase as a result of the expansion of industries like mining, metal processing, and chemicals. Thus, it is anticipated that rising environmental concerns and water pollution will encourage the adoption of wastewater treatment procedures, fueling market expansion.
[caption id="attachment_15360" align="aligncenter" width="1920"]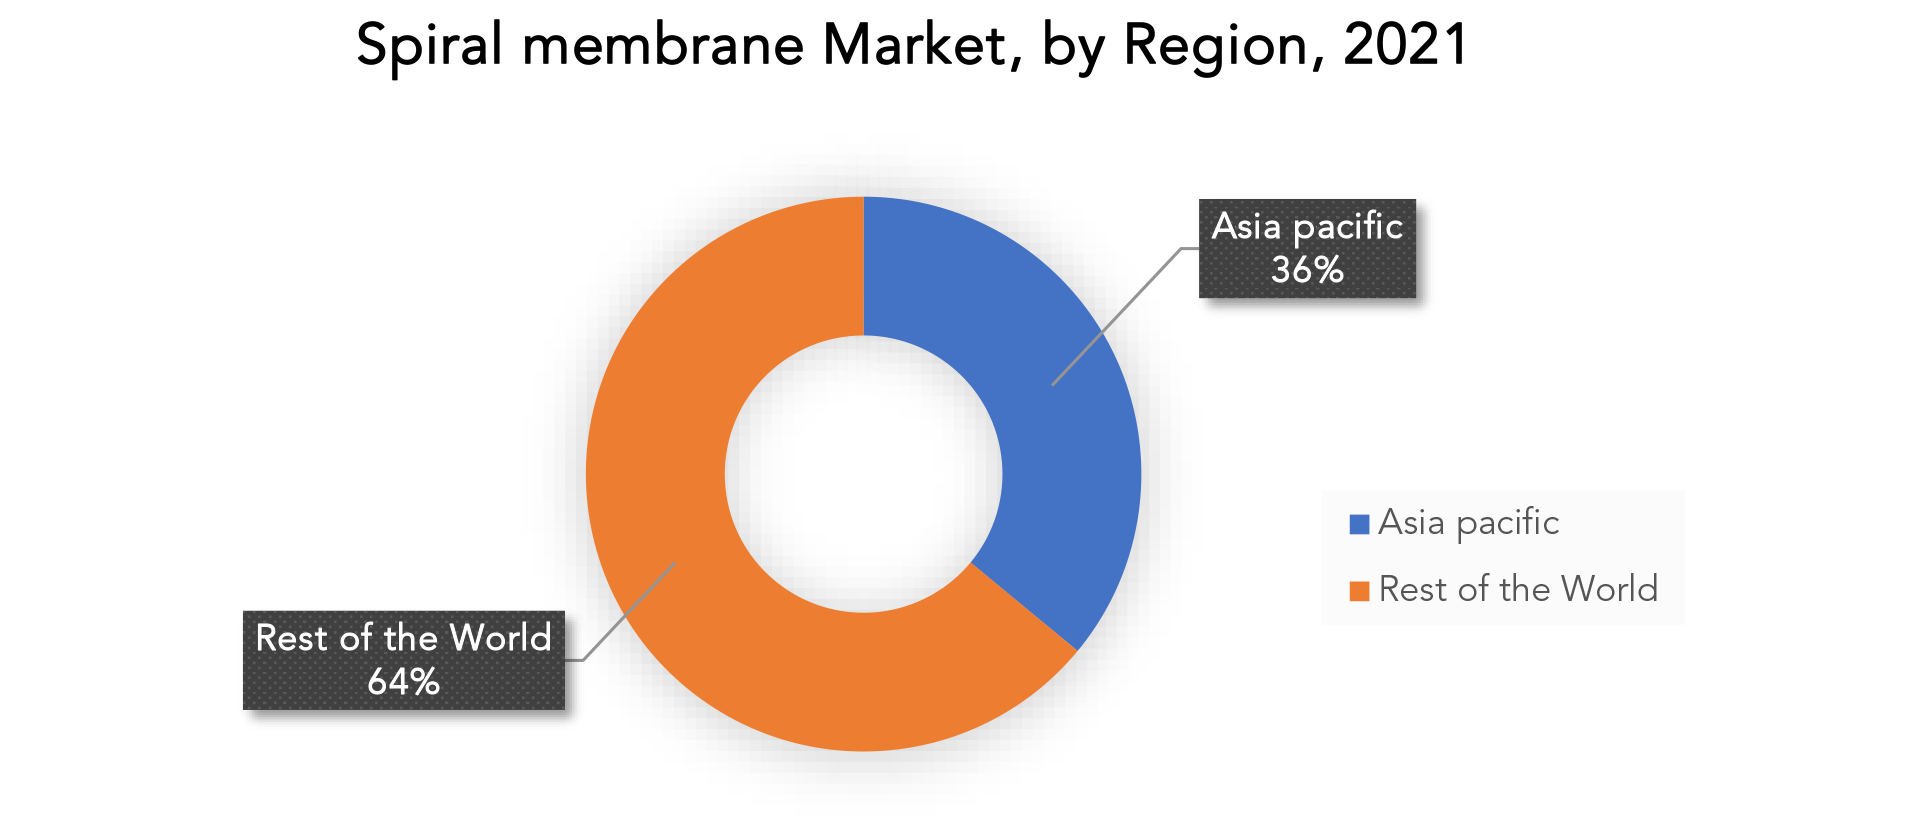
Key Market Segments: Spiral membrane Market
Spiral Membrane Market By Polymer Type, 2020-2029, (Usd Billion)- Polyamide
- Ps & Pes
- Fluoropolymers
- Reverse Osmosis
- Microfiltration
- Ultrafiltration
- Nanofiltration
- Water & Wastewater Treatment
- Industry Processing
- Food & Beverage Processing
- Pharmaceutical & Medical
- Other
- North America
- Asia Pacific
- Europe
- South America
- Middle East And Africa
Exactitude Consultancy Services Key Objectives:
- Increasing sales and market share
- Developing new technology
- Improving profitability
- Entering new markets
- Enhancing brand reputation
Key Question Answered
- What is the expected growth rate of the spiral membrane market over the next 7 years?
- Who are the major players in the spiral membrane market and what is their market share?
- What are the end-user industries driving demand for market and what is their outlook?
- What are the opportunities for growth in emerging markets such as Asia-Pacific, Middle East, and Africa?
- How is the economic environment affecting the spiral membrane market, including factors such as interest rates, inflation, and exchange rates?
- What is the expected impact of government policies and regulations on the spiral membrane market?
- What is the current and forecasted size and growth rate of the global spiral membrane market?
- What are the key drivers of growth in the spiral membrane market?
- What are the distribution channels and supply chain dynamics in the spiral membrane market?
- What are the technological advancements and innovations in the spiral membrane market and their impact on product development and growth?
- What are the regulatory considerations and their impact on the market?
- What are the challenges faced by players in the spiral membrane market and how are they addressing these challenges?
- What are the opportunities for growth and expansion in the spiral membrane market?
- What are the product offerings and specifications of leading players in the market?
- INTRODUCTION
- MARKET DEFINITION
- MARKET SEGMENTATION
- RESEARCH TIMELINES
- ASSUMPTIONS AND LIMITATIONS
- RESEARCH METHODOLOGY
- DATA MINING
- SECONDARY RESEARCH
- PRIMARY RESEARCH
- SUBJECT-MATTER EXPERTS’ ADVICE
- QUALITY CHECKS
- FINAL REVIEW
- DATA TRIANGULATION
- BOTTOM-UP APPROACH
- TOP-DOWN APPROACH
- RESEARCH FLOW
- DATA SOURCES
- DATA MINING
- EXECUTIVE SUMMARY
- MARKET OVERVIEW
- GLOBAL SPIRAL MEMBRANE MARKET OUTLOOK
- MARKET DRIVERS
- MARKET RESTRAINTS
- MARKET OPPORTUNITIES
- IMPACT OF COVID-19 ON SPIRAL MEMBRANE MARKET
- PORTER’S FIVE FORCES MODEL
- THREAT FROM NEW ENTRANTS
- THREAT FROM SUBSTITUTES
- BARGAINING POWER OF SUPPLIERS
- BARGAINING POWER OF CUSTOMERS
- DEGREE OF COMPETITION
- INDUSTRY VALUE CHAIN ANALYSIS
- GLOBAL SPIRAL MEMBRANE MARKET OUTLOOK
- GLOBAL SPIRAL MEMBRANE MARKET BY POLYMER TYPE, 2020-2029, (USD BILLION)
- POLYAMIDE
- PS & PES
- FLUOROPOLYMERS
- GLOBAL SPIRAL MEMBRANE MARKET BY TECHNOLOGY, 2020-2029, (USD BILLION)
- REVERSE OSMOSIS
- MICROFILTRATION
- ULTRAFILTRATION
- NANOFILTRATION
- GLOBAL SPIRAL MEMBRANE MARKET BY END USER INDUSTRY, 2020-2029, (USD BILLION)
- WATER & WASTEWATER TREATMENT
- INDUSTRY PROCESSING
- FOOD & BEVERAGE PROCESSING
- PHARMACEUTICAL & MEDICAL
- OTHERS
- GLOBAL SPIRAL MEMBRANE MARKET BY REGION, 2020-2029, (USD BILLION)
- NORTH AMERICA
- US
- CANADA
- MEXICO
- SOUTH AMERICA
- BRAZIL
- ARGENTINA
- COLOMBIA
- REST OF SOUTH AMERICA
- EUROPE
- GERMANY
- UK
- FRANCE
- ITALY
- SPAIN
- RUSSIA
- REST OF EUROPE
- ASIA PACIFIC
- INDIA
- CHINA
- JAPAN
- SOUTH KOREA
- AUSTRALIA
- SOUTH-EAST ASIA
- REST OF ASIA PACIFIC
- MIDDLE EAST AND AFRICA
- UAE
- SAUDI ARABIA
- SOUTH AFRICA
- REST OF MIDDLE EAST AND AFRICA
- NORTH AMERICA
- COMPANY PROFILES* (BUSINESS OVERVIEW, COMPANY SNAPSHOT, PRODUCTS OFFERED, RECENT DEVELOPMENTS)
- MIX TELEMATICS
- ALFA LAVAL AB
- APPLIED MEMBRANES INC
- AXEON WATER TECHNOLOGIES
- DOW INC
- DUPONT DE NEMOURS, INC.
- FILEDER FILTER SYSTEMS LTD.
- GEA GROUP
- AKTIENGESELLSCHAFT HYDRANAUTICS
- KOCH SEPARATION SOLUTIONS INC.
- LG CHEM LTD.
- MERCK KGAA
- PALL CORPORATION
- PENTAIR PLC
- SUEZ WATER TECHNOLOGIES & SOLUTIONS
- TORAY INDUSTRIES INC. *THE COMPANY LIST IS INDICATIVE
LIST OF TABLES
TABLE 1 GLOBAL SPIRAL MEMBRANE MARKET BY POLYMER TYPE (USD BILLION), 2020-2029
TABLE 2 GLOBAL SPIRAL MEMBRANE MARKET BY TECHNOLOGY (USD BILLION), 2020-2029
TABLE 3 GLOBAL SPIRAL MEMBRANE MARKET BY END USER INDUSTRY (USD BILLION), 2020-2029
TABLE 4 GLOBAL SPIRAL MEMBRANE MARKET BY REGION (USD BILLION), 2020-2029
TABLE 5 NORTH AMERICA SPIRAL MEMBRANE MARKET BY POLYMER TYPE (USD BILLION), 2020-2029
TABLE 6 NORTH AMERICA SPIRAL MEMBRANE MARKET BY TECHNOLOGY (USD BILLION), 2020-2029
TABLE 7 NORTH AMERICA SPIRAL MEMBRANE MARKET BY END USER INDUSTRY (USD BILLION), 2020-2029
TABLE 8 NORTH AMERICA SPIRAL MEMBRANE MARKET BY COUNTRY (USD BILLION), 2020-2029
TABLE 9 US SPIRAL MEMBRANE MARKET BY POLYMER TYPE (USD BILLION), 2020-2029
TABLE 10 US SPIRAL MEMBRANE MARKET BY TECHNOLOGY (USD BILLION), 2020-2029
TABLE 11 US SPIRAL MEMBRANE MARKET BY END USER INDUSTRY (USD BILLION), 2020-2029
TABLE 12 CANADA SPIRAL MEMBRANE MARKET BY POLYMER TYPE (BILLION), 2020-2029
TABLE 13 CANADA SPIRAL MEMBRANE MARKET BY TECHNOLOGY (USD BILLION), 2020-2029
TABLE 14 CANADA SPIRAL MEMBRANE MARKET BY END USER INDUSTRY (USD BILLION), 2020-2029
TABLE 15 MEXICO SPIRAL MEMBRANE MARKET BY POLYMER TYPE (USD BILLION), 2020-2029
TABLE 16 MEXICO SPIRAL MEMBRANE MARKET BY TECHNOLOGY (USD BILLION), 2020-2029
TABLE 17 MEXICO SPIRAL MEMBRANE MARKET BY END USER INDUSTRY (USD BILLION), 2020-2029
TABLE 18 SOUTH AMERICA SPIRAL MEMBRANE MARKET BY POLYMER TYPE (USD BILLION), 2020-2029
TABLE 19 SOUTH AMERICA SPIRAL MEMBRANE MARKET BY TECHNOLOGY (USD BILLION), 2020-2029
TABLE 20 SOUTH AMERICA SPIRAL MEMBRANE MARKET BY END USER INDUSTRY (USD BILLION), 2020-2029
TABLE 21 SOUTH AMERICA SPIRAL MEMBRANE MARKET BY COUNTRY (USD BILLION), 2020-2029
TABLE 22 BRAZIL SPIRAL MEMBRANE MARKET BY POLYMER TYPE (USD BILLION), 2020-2029
TABLE 23 BRAZIL SPIRAL MEMBRANE MARKET BY TECHNOLOGY (USD BILLION), 2020-2029
TABLE 24 BRAZIL SPIRAL MEMBRANE MARKET BY END USER INDUSTRY (USD BILLION), 2020-2029
TABLE 25 ARGENTINA SPIRAL MEMBRANE MARKET BY POLYMER TYPE (USD BILLION), 2020-2029
TABLE 26 ARGENTINA SPIRAL MEMBRANE MARKET BY TECHNOLOGY (USD BILLION), 2020-2029
TABLE 27 ARGENTINA SPIRAL MEMBRANE MARKET BY END USER INDUSTRY (USD BILLION), 2020-2029
TABLE 28 COLOMBIA SPIRAL MEMBRANE MARKET BY POLYMER TYPE (USD BILLION), 2020-2029
TABLE 29 COLOMBIA SPIRAL MEMBRANE MARKET BY TECHNOLOGY (USD BILLION), 2020-2029
TABLE 30 COLOMBIA SPIRAL MEMBRANE MARKET BY END USER INDUSTRY (USD BILLION), 2020-2029
TABLE 31 REST OF SOUTH AMERICA SPIRAL MEMBRANE MARKET BY POLYMER TYPE (USD BILLION), 2020-2029
TABLE 32 REST OF SOUTH AMERICA SPIRAL MEMBRANE MARKET BY TECHNOLOGY (USD BILLION), 2020-2029
TABLE 33 REST OF SOUTH AMERICA SPIRAL MEMBRANE MARKET BY END USER INDUSTRY (USD BILLION), 2020-2029
TABLE 34 ASIA-PACIFIC SPIRAL MEMBRANE MARKET BY POLYMER TYPE (USD BILLION), 2020-2029
TABLE 35 ASIA-PACIFIC SPIRAL MEMBRANE MARKET BY TECHNOLOGY (USD BILLION), 2020-2029
TABLE 36 ASIA-PACIFIC SPIRAL MEMBRANE MARKET BY END USER INDUSTRY (USD BILLION), 2020-2029
TABLE 37 ASIA-PACIFIC SPIRAL MEMBRANE MARKET BY COUNTRY (USD BILLION), 2020-2029
TABLE 38 INDIA SPIRAL MEMBRANE MARKET BY POLYMER TYPE (USD BILLION), 2020-2029
TABLE 39 INDIA SPIRAL MEMBRANE MARKET BY TECHNOLOGY (USD BILLION), 2020-2029
TABLE 40 INDIA SPIRAL MEMBRANE MARKET BY END USER INDUSTRY (USD BILLION), 2020-2029
TABLE 41 CHINA SPIRAL MEMBRANE MARKET BY POLYMER TYPE (USD BILLION), 2020-2029
TABLE 42 CHINA SPIRAL MEMBRANE MARKET BY TECHNOLOGY (USD BILLION), 2020-2029
TABLE 43 CHINA SPIRAL MEMBRANE MARKET BY END USER INDUSTRY (USD BILLION), 2020-2029
TABLE 44 JAPAN SPIRAL MEMBRANE MARKET BY POLYMER TYPE (USD BILLION), 2020-2029
TABLE 45 JAPAN SPIRAL MEMBRANE MARKET BY TECHNOLOGY (USD BILLION), 2020-2029
TABLE 46 JAPAN SPIRAL MEMBRANE MARKET BY END USER INDUSTRY (USD BILLION), 2020-2029
TABLE 47 SOUTH KOREA SPIRAL MEMBRANE MARKET BY POLYMER TYPE (USD BILLION), 2020-2029
TABLE 48 SOUTH KOREA SPIRAL MEMBRANE MARKET BY TECHNOLOGY (USD BILLION), 2020-2029
TABLE 49 SOUTH KOREA SPIRAL MEMBRANE MARKET BY END USER INDUSTRY (USD BILLION), 2020-2029
TABLE 50 AUSTRALIA SPIRAL MEMBRANE MARKET BY POLYMER TYPE (USD BILLION), 2020-2029
TABLE 51 AUSTRALIA SPIRAL MEMBRANE MARKET BY TECHNOLOGY (USD BILLION), 2020-2029
TABLE 52 AUSTRALIA SPIRAL MEMBRANE MARKET BY END USER INDUSTRY (USD BILLION), 2020-2029
TABLE 53 SOUTH EAST ASIA SPIRAL MEMBRANE MARKET BY POLYMER TYPE (USD BILLION), 2020-2029
TABLE 54 SOUTH EAST ASIA SPIRAL MEMBRANE BY TYPE (THOUSAND UNITS), 2020-2029
TABLE 55 SOUTH EAST ASIA SPIRAL MEMBRANE MARKET BY TECHNOLOGY (USD BILLION), 2020-2029
TABLE 56 SOUTH EAST ASIA SPIRAL MEMBRANE MARKET BY END USER INDUSTRY (USD BILLION), 2020-2029
TABLE 57 REST OF ASIA PACIFIC SPIRAL MEMBRANE MARKET BY POLYMER TYPE (USD BILLION), 2020-2029
TABLE 58 REST OF ASIA PACIFIC SPIRAL MEMBRANE MARKET BY TECHNOLOGY (USD BILLION), 2020-2029
TABLE 59 REST OF ASIA PACIFIC SPIRAL MEMBRANE MARKET BY END USER INDUSTRY (USD BILLION), 2020-2029
TABLE 60 EUROPE SPIRAL MEMBRANE MARKET BY POLYMER TYPE (USD BILLION), 2020-2029
TABLE 61 EUROPE SPIRAL MEMBRANE MARKET BY TECHNOLOGY (USD BILLION), 2020-2029
TABLE 62 EUROPE SPIRAL MEMBRANE MARKET BY END USER INDUSTRY (USD BILLION), 2020-2029
TABLE 63 EUROPE SPIRAL MEMBRANE MARKET BY COUNTRY (USD BILLION), 2020-2029
TABLE 64 GERMANY SPIRAL MEMBRANE MARKET BY POLYMER TYPE (USD BILLION), 2020-2029
TABLE 65 GERMANY SPIRAL MEMBRANE MARKET BY TECHNOLOGY (USD BILLION), 2020-2029
TABLE 66 GERMANY SPIRAL MEMBRANE MARKET BY END USER INDUSTRY (USD BILLION), 2020-2029
TABLE 67 UK SPIRAL MEMBRANE MARKET BY POLYMER TYPE (USD BILLION), 2020-2029
TABLE 68 UK SPIRAL MEMBRANE MARKET BY TECHNOLOGY (USD BILLION), 2020-2029
TABLE 69 UK SPIRAL MEMBRANE MARKET BY END USER INDUSTRY (USD BILLION), 2020-2029
TABLE 70 FRANCE SPIRAL MEMBRANE MARKET BY POLYMER TYPE (USD BILLION), 2020-2029
TABLE 71 FRANCE SPIRAL MEMBRANE MARKET BY TECHNOLOGY (USD BILLION), 2020-2029
TABLE 72 FRANCE SPIRAL MEMBRANE MARKET BY END USER INDUSTRY (USD BILLION), 2020-2029
TABLE 73 ITALY SPIRAL MEMBRANE MARKET BY POLYMER TYPE (USD BILLION), 2020-2029
TABLE 74 ITALY SPIRAL MEMBRANE MARKET BY TECHNOLOGY (USD BILLION), 2020-2029
TABLE 75 ITALY SPIRAL MEMBRANE MARKET BY END USER INDUSTRY (USD BILLION), 2020-2029
TABLE 76 SPAIN SPIRAL MEMBRANE MARKET BY POLYMER TYPE (USD BILLION), 2020-2029
TABLE 77 SPAIN SPIRAL MEMBRANE MARKET BY TECHNOLOGY (USD BILLION), 2020-2029
TABLE 78 SPAIN SPIRAL MEMBRANE MARKET BY END USER INDUSTRY (USD BILLION), 2020-2029
TABLE 79 RUSSIA SPIRAL MEMBRANE MARKET BY POLYMER TYPE (USD BILLION), 2020-2029
TABLE 80 RUSSIA SPIRAL MEMBRANE MARKET BY TECHNOLOGY (USD BILLION), 2020-2029
TABLE 81 RUSSIA SPIRAL MEMBRANE MARKET BY END USER INDUSTRY (USD BILLION), 2020-2029
TABLE 82 REST OF EUROPE SPIRAL MEMBRANE MARKET BY POLYMER TYPE (USD BILLION), 2020-2029
TABLE 83 REST OF EUROPE SPIRAL MEMBRANE MARKET BY TECHNOLOGY (USD BILLION), 2020-2029
TABLE 84 REST OF EUROPE SPIRAL MEMBRANE MARKET BY END USER INDUSTRY (USD BILLION), 2020-2029
TABLE 85 MIDDLE EAST AND AFRICA SPIRAL MEMBRANE MARKET BY POLYMER TYPE (USD BILLION), 2020-2029
TABLE 86 MIDDLE EAST AND AFRICA SPIRAL MEMBRANE MARKET BY TECHNOLOGY (USD BILLION), 2020-2029
TABLE 87 MIDDLE EAST AND AFRICA SPIRAL MEMBRANE MARKET BY END USER INDUSTRY (USD BILLION), 2020-2029
TABLE 88 MIDDLE EAST AND AFRICA SPIRAL MEMBRANE MARKET BY COUNTRY (USD BILLION), 2020-2029
TABLE 89 UAE SPIRAL MEMBRANE MARKET BY POLYMER TYPE (USD BILLION), 2020-2029
TABLE 90 UAE SPIRAL MEMBRANE MARKET BY TECHNOLOGY (USD BILLION), 2020-2029
TABLE 91 UAE SPIRAL MEMBRANE MARKET BY END USER INDUSTRY (USD BILLION), 2020-2029
TABLE 92 SAUDI ARABIA SPIRAL MEMBRANE MARKET BY POLYMER TYPE (USD BILLION), 2020-2029
TABLE 93 SAUDI ARABIA SPIRAL MEMBRANE MARKET BY TECHNOLOGY (USD BILLION), 2020-2029
TABLE 94 SAUDI ARABIA SPIRAL MEMBRANE MARKET BY END USER INDUSTRY (USD BILLION), 2020-2029
TABLE 95 SOUTH AFRICA SPIRAL MEMBRANE MARKET BY POLYMER TYPE (USD BILLION), 2020-2029
TABLE 96 SOUTH AFRICA SPIRAL MEMBRANE MARKET BY TECHNOLOGY (USD BILLION), 2020-2029
TABLE 97 SOUTH AFRICA SPIRAL MEMBRANE MARKET BY END USER INDUSTRY (USD BILLION), 2020-2029
TABLE 98 REST OF MIDDLE EAST AND AFRICA SPIRAL MEMBRANE MARKET BY POLYMER TYPE (USD BILLION), 2020-2029
TABLE 99 REST OF MIDDLE EAST AND AFRICA SPIRAL MEMBRANE MARKET BY TECHNOLOGY (USD BILLION), 2020-2029
TABLE 100 REST OF MIDDLE EAST AND AFRICA SPIRAL MEMBRANE MARKET BY END USER INDUSTRY (USD BILLION), 2020-2029
LIST OF FIGURES
FIGURE 1 MARKET DYNAMICS
FIGURE 2 MARKET SEGMENTATION
FIGURE 3 REPORT TIMELINES: YEARS CONSIDERED
FIGURE 4 DATA TRIANGULATION
FIGURE 5 BOTTOM-UP APPROACH
FIGURE 6 TOP-DOWN APPROACH
FIGURE 7 RESEARCH FLOW
FIGURE 8 GLOBAL SPIRAL MEMBRANE MARKET BY POLYMER TYPE, USD BILLION, 2020-2029
FIGURE 9 GLOBAL SPIRAL MEMBRANE MAKRET BY TECHNOLOGY, USD BILLION, 2020-2029
FIGURE 10 GLOBAL SPIRAL MEMBRANE MARKET BY END USER INDUSTRY, USD BILLION, 2020-2029
FIGURE 11 GLOBAL SPIRAL MEMBRANE MARKET BY REGION, USD BILLION, 2020-2029
FIGURE 12 PORTER’S FIVE FORCES MODEL
FIGURE 13 SPIRAL MEMBRANE MARKET BY POLYMER TYPE 2021
FIGURE 14 SPIRAL MEMBRANE MAKRET BY TECHNOLOGY 2021
FIGURE 15 SPIRAL MEMBRANE MARKET BY END USER INDUSTRY 2021
FIGURE 16 GLOBAL SPIRAL MEMBRANE MARKET BY REGION 2021
FIGURE 17 MARKET SHARE ANALYSIS
FIGURE 18 ALFA LAVAL AB: COMPANY SNAPSHOT
FIGURE 19 APPLIED MEMBRANES INC.: COMPANY SNAPSHOT
FIGURE 20 AXEON WATER TECHNOLOGIES: COMPANY SNAPSHOT
FIGURE 21 DOW INC.: COMPANY SNAPSHOT
FIGURE 22 DUPONT DE NEMOURS, INC.: COMPANY SNAPSHOT
FIGURE 23 FILEDER FILTER SYSTEMS LTD.: COMPANY SNAPSHOT
FIGURE 24 AKTIENGESELLSCHAFT HYDRANAUTICS: COMPANY SNAPSHOT
FIGURE 25 KOCH SEPARATION SOLUTIONS INC.: COMPANY SNAPSHOT
FIGURE 26 LG CHEM LTD.: COMPANY SNAPSHOT
FIGURE 27 MERCK KGAA: COMPANY SNAPSHOT
FIGURE 28 PALL CORPORATION: COMPANY SNAPSHOT
FIGURE 29 PENTAIR PLC: COMPANY SNAPSHOT
FIGURE 30 SUEZ WATER TECHNOLOGIES & SOLUTIONS: COMPANY SNAPSHOT
FIGURE 31 TORAY INDUSTRIES INC.: COMPANY SNAPSHOT
DOWNLOAD FREE SAMPLE REPORT
License Type
SPEAK WITH OUR ANALYST
Want to know more about the report or any specific requirement?
WANT TO CUSTOMIZE THE REPORT?
Our Clients Speak
We asked them to research ‘ Equipment market’ all over the world, and their whole arrangement was helpful to us. thehealthanalytics.com insightful analysis and reports contributed to our current analysis and in creating a future strategy. Besides, the te
Yosuke Mitsui
Senior Associate Construction Equipment Sales & Marketing
We asked them to research ‘Equipment market’ all over the world, and their whole arrangement was helpful to us. thehealthanalytics.com insightful analysis and reports contributed to our current analysis and in creating a future strategy. Besides, the te


