

Base Year Value ()
x.x %
x.x %
CAGR ()
x.x %
x.x %
Forecast Year Value ()
x.x %
x.x %
Historical Data Period
Largest Region
Forecast Period
Service robotics Market By Type (Professional service robotics, Personal service robotics), By Application (Healthcare, Defense, Field, Logistics, Construction, Domestic, Entertainment, Other) and Region, Global trends and forecast from 2022 to 2029.
Instant access to hundreds of data points and trends
- Market estimates from 2014-2029
- Competitive analysis, industry segmentation, financial benchmarks
- Incorporates SWOT, Porter's Five Forces and risk management frameworks
- PDF report or online database with Word, Excel and PowerPoint export options
- 100% money back guarantee
Service Robotics Market Overview
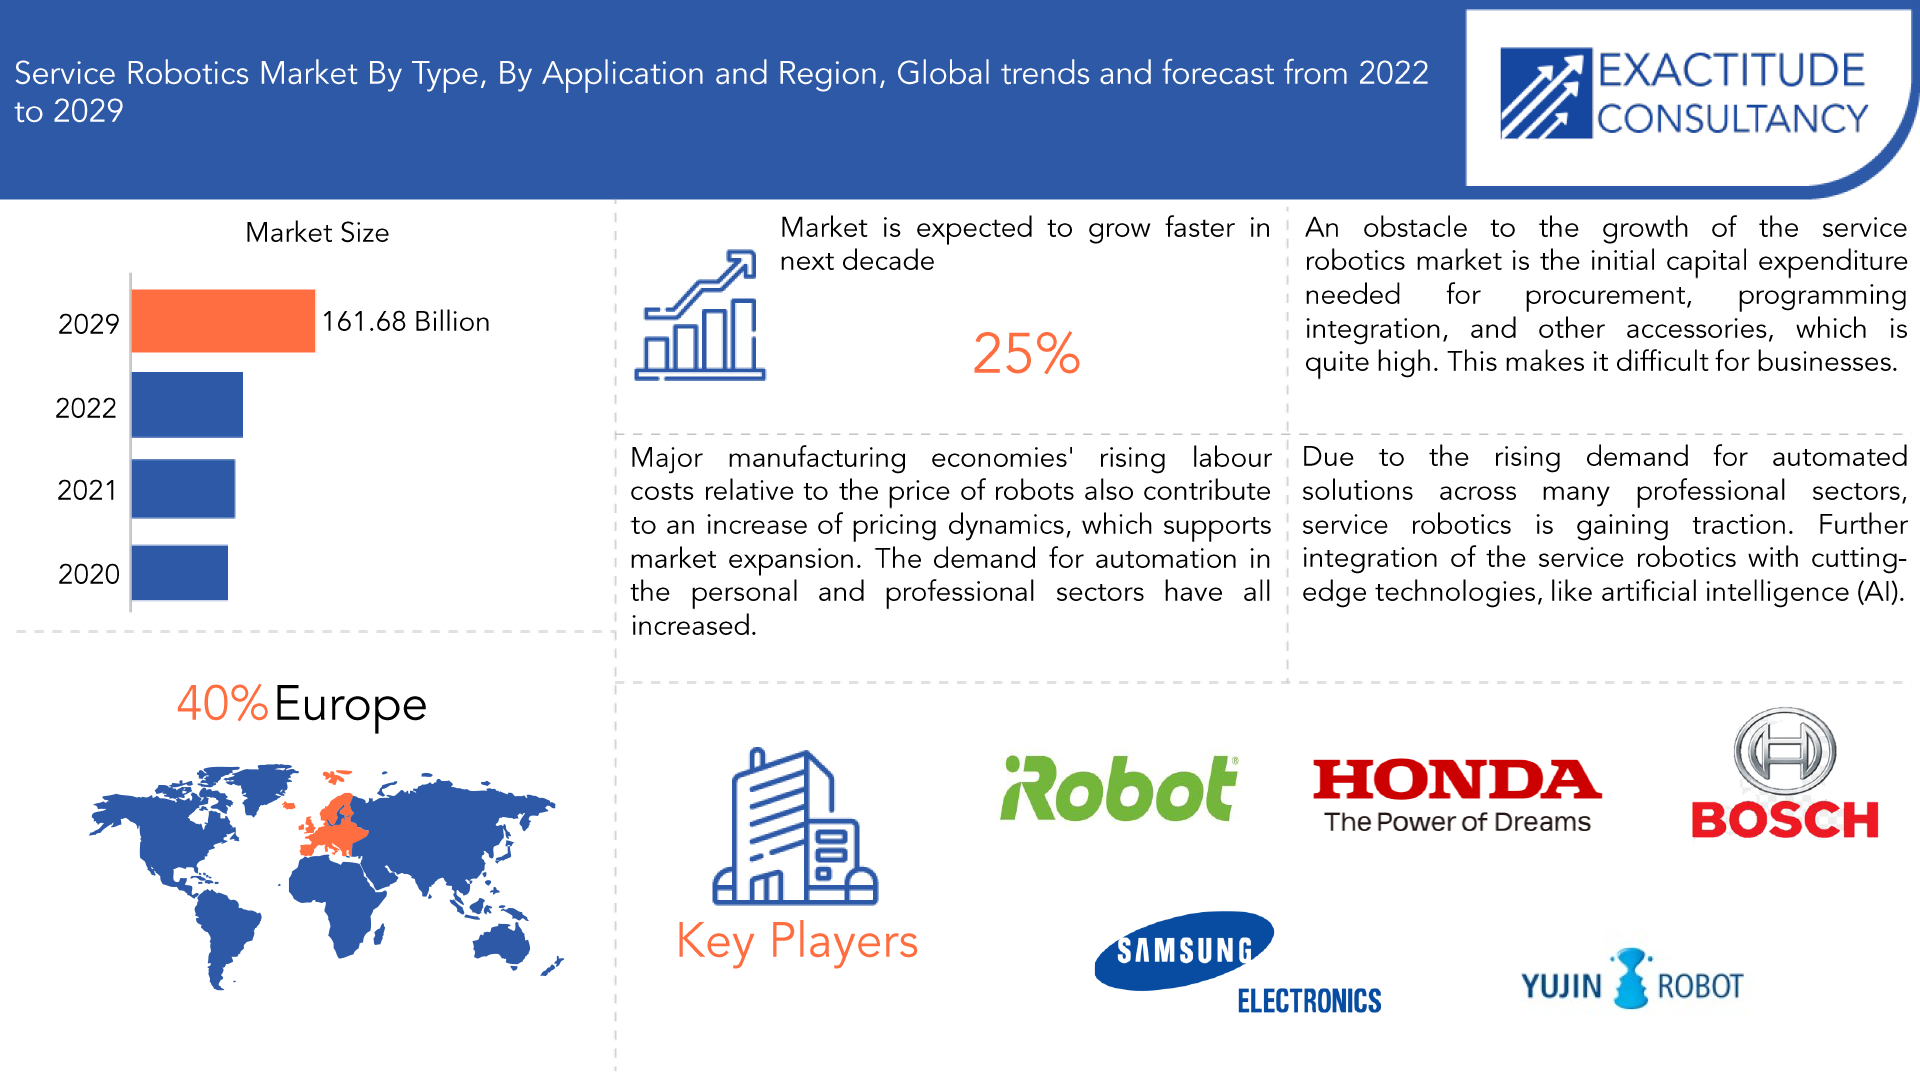
The Service robotics market is expected to grow at 25% CAGR from 2022 to 2029. It is expected to reach above USD 161.68 billion by 2029 from USD 21.7 billion in 2020.
Service robots are semi- or fully-automatic robots that carry out necessary and hazardous tasks for people. These robots help people in a variety of fields, including entertainment, domestic work, automation, and medical care. These robots are operated automatically by an internal control system, with the option for manual intervention. These service robots manage time, reduce the workload of the staff and laborers, and increase productivity by removing the possibility of human error.
Due to advantages like providing precise, high-quality services that reduced operating costs and human errors and enhanced usability and dependability, service robotics have become widely accepted in a variety of professional and personal applications. Furthermore, in order to reduce human error in operations and increase productivity, many businesses have adopted robotic technology as a result of the rise in labor costs and the death of trained workers. The demand for service robots has also increased as people's understanding of the advantages of robots, R&D spending, and the demand for automation in the personal and professional sectors have all increased.
| ATTRIBUTE | DETAILS |
| Study period | 2020-2029 |
| Base year | 2021 |
| Estimated year | 2022 |
| Forecasted year | 2022-2029 |
| Historical period | 2018-2020 |
| Unit | Value (USD BILLION) |
| Segmentation | By Type, By Application, By Region |
| By Type
|
|
| By Application
|
|
| By Region
|
|
The cost of manufacturing robots has significantly decreased as a result of the quick development of technology and the increase in robot production. The average cost of a robot has decreased over the past 30 years by half in real terms and even more when compared to labor costs. Additionally, it is anticipated that production of robots will shift to low-cost regions, further lowering the manufacturing cost, due to the rising demand for robots from the emerging economies.
An obstacle to the growth of the service robotics market is the initial capital expenditure needed for procurement, programming integration, and other accessories, which is quite high. This makes it difficult for businesses, especially small and medium-sized ones, to invest in these robots because of their low production volume and low return on investment. The price of replacing sensors, upgrading software, and purchasing new devices raises the cost of owning service robots, which in turn slows the market's growth.
The COVID-19 outbreak has affected the use of data centers and service robotics. The pandemic had a significant financial impact on this sector. Since China is the world's primary manufacturing country and its economy was significantly affected by the pandemic, there were significant effects on global supply chains. Due to various technological advancements, the machines' flexibility has increased, allowing them to now complete several tasks in a short amount of time. Workflow has undergone a revolution as a result of the use of robots in many industries, including logistics, healthcare, agriculture, and defense. The use of robots in the medical field is assisting surgeons in better performing minimally invasive procedures.
Major manufacturing economies' rising labor costs relative to the price of robots also contribute to an increase in the attractiveness of pricing dynamics, which supports market expansion. Enhanced robot capabilities as a result of technological advancement, as well as increased productivity and quality realized through the use of service robots. Due to the rising demand for automated solutions across many professional sectors, service robotics is gaining traction. Further integration of the service robotics with cutting-edge technologies, like artificial intelligence (AI). The effectiveness and capability of service robotics are being improved by these integrations. Because of the use of robotics, productivity has increased and the economic conditions of developing countries have improved as a result of changing robotics trends.
[caption id="attachment_15745" align="aligncenter" width="1920"]
Frequently Asked Questions
• What is the worth of service robotics market?
The Service robotics market size had crossed USD 21.7 billion in 2020 and will observe a CAGR of more than 25 % up to 2029.
• What is the size of the Asia Pacific service robotics industry?
Europe held more than 40% of the Service robotics market revenue share in 2021 and will witness expansion in the forecast period.
• What are some of the market's driving forces?
Drivers such as the presence of people's understanding of the advantages of robots, R&D spending, and the demand for automation in the personal and professional sectors.
• Which are the top companies to hold the market share in service robotics market?
Key players profiled in the report include Amazon Web Services (AWS), Inc., General Electric Company, Hewlett Packard Enterprise, IBM Corporation, Intel Corporation, Microsoft Corporation.
• What is the leading application of service robotics market?
One of the key trends is the emerging service robotics demands such as high-quality services that reduced operating costs and human errors and enhanced usability and dependability.
• Which is the largest regional market for service robotics market?
The region's largest share is in Asia pacific. The research and development activities in the industrial robot sector are the most significant driver of the rising adoption of service robotics in this region.
Service Robotics Market Segment Analysis
The service robotics market is segmented based on vehicle type, form type, application and Region, Global trends and forecast.
By type, the market is bifurcated into Type (Professional service robotics, Personal service robotics), By Application (Healthcare, Defense, Field, Logistics, Construction, Domestic, Entertainment, Other)
By Type, market is divided into personal robots and professional robots. Throughout the forecast period, it is anticipated that the professional service robot segment will hold a larger market share of about 56%. In recent years, the professional market saw good growth. There has been significant market growth as a result of rising demand for service robots across numerous industries, including logistics, defense, construction, and healthcare. The market share of service robotics is greatly impacted by the adoption of automation and mobility in many other industries. Due to the increased increase in labor costs brought on by a lack of skilled labor, the professional segment has grown.
By application, the market is segmented into Healthcare, Defense, Field, Logistics, Construction, Domestic, Entertainment and Others. Due to increased automation in this field, where robots are used to move and store the goods, the logistics sector of the commercial segment will hold the largest share of about 31.5%. This helps to save time and ensures efficient operation. In the upcoming years, many industries are anticipated to have high demand for the supply chain processes in this segment. Service robots are employed not only in logistics but also in the medical industry.
Due to a shift in people using integrated robotic solutions for many crucial operations, medical service robots are anticipated to grow significantly during the forecast period. Service robots will be widely used in high-tech testing labs in the medical industry. The results will also be more accurate thanks to the use of service robots in the testing labs. Additionally, service robots are utilized by unmanned aerial vehicles. The agricultural and defense industries use these vehicles.
[caption id="attachment_15749" align="aligncenter" width="1920"]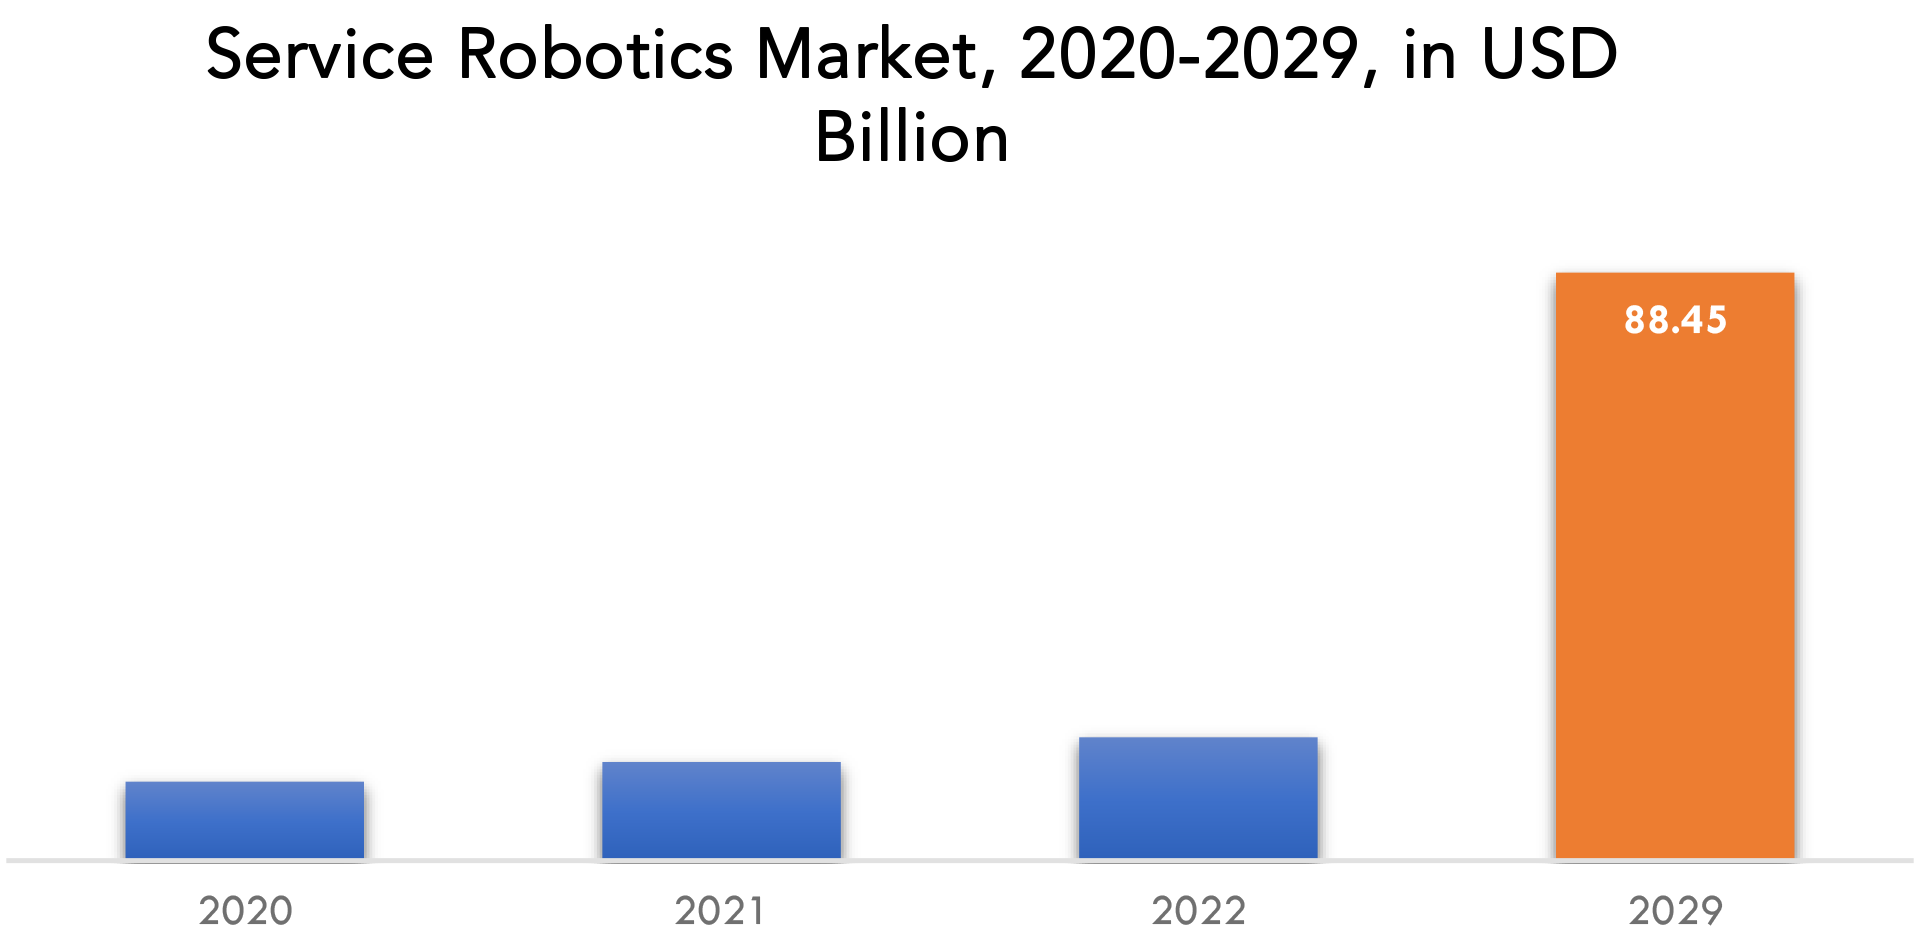
Service Robotics Market | Exactitude Consultancy
Service Robotics Market Players
The service robotics market key players include iRobot Corporation, Intuitive Surgical Inc, Honda Motor Co., Ltd., Panasonic Corporation, Aethon Inc., Yujin Robot Co. Ltd., Samsung Electronics CO., Ltd., DeLaval, Robert Bosch gmbh, AB Electrolux, Axon Ivy AG. Recent development- February 2022: As part of a strategic investment, Ricoh purchased Axon Ivy AG with the aim of enhancing its capabilities for digital process automation.
- September 2022: Canada-based robotics company Avidbots raised USD 70 million in the Series C funding round. The company's main focus is the development of autonomous cleaning robots, and it has created Neo 2, a robotic floor cleaner intended for use in commercial settings like warehouses, airports, and shopping centers.
Who Should Buy? Or Key stakeholders
- Service robotics Suppliers
- Raw Materials Manufacturers
- Research Organizations
- Investors
- End-users
- Government Authorities
- Consulting and Research Firm
- Others
Service Robotics Regional Analysis
The Service robotics market by region includes North America, Asia-Pacific (APAC), Europe, South America, and Middle East & Africa (MEA).- North America: includes the US, Canada, Mexico
- Asia Pacific: includes China, Japan, South Korea, India, Australia, ASEAN and Rest of APAC
- Europe: includes UK, Germany, France, Italy, Spain, Russia, and Rest of Europe
- South America: includes Brazil, Argentina and Rest of South America
- Middle East & Africa: includes Turkey, UAE, Saudi Arabia, South Africa, and Rest of MEA
The market for service robotics the region of Europe experiences the highest growth. In terms of the global service robotics market, Europe holds the largest market share due to the rising demand for personal and business robots in many of its member states. The location of many market participants in this area. In Europe, there are numerous manufacturing industries. The medical, defense, logistics, and retail sectors are increasingly in demand from these industries. Due to the increased adoption of these robotic solutions in these nations, countries like Germany, the United Kingdom, France, and Italy are predicted to grow strongly during the forecast period.
Following Europe, which is anticipated to grow significantly during the forecast period, the Asia Pacific region is anticipated to have the second-highest share. The research and development activities in the industrial robot sector are the most significant driver of the rising adoption of service robotics in this region. Governments in the Asia-Pacific region are increasing their investments in technologies like automation, artificial intelligence, and robotics. The main drivers of growth in this region are expected to be South Korea, Japan, and China. Increased industrialization, globalization, and the growing need for automation in many industries are driving demand for service robotics. Many people's quality of life has improved in developing countries like India and China which will eventually propel the growth of this market in that region.
[caption id="attachment_15752" align="aligncenter" width="1920"]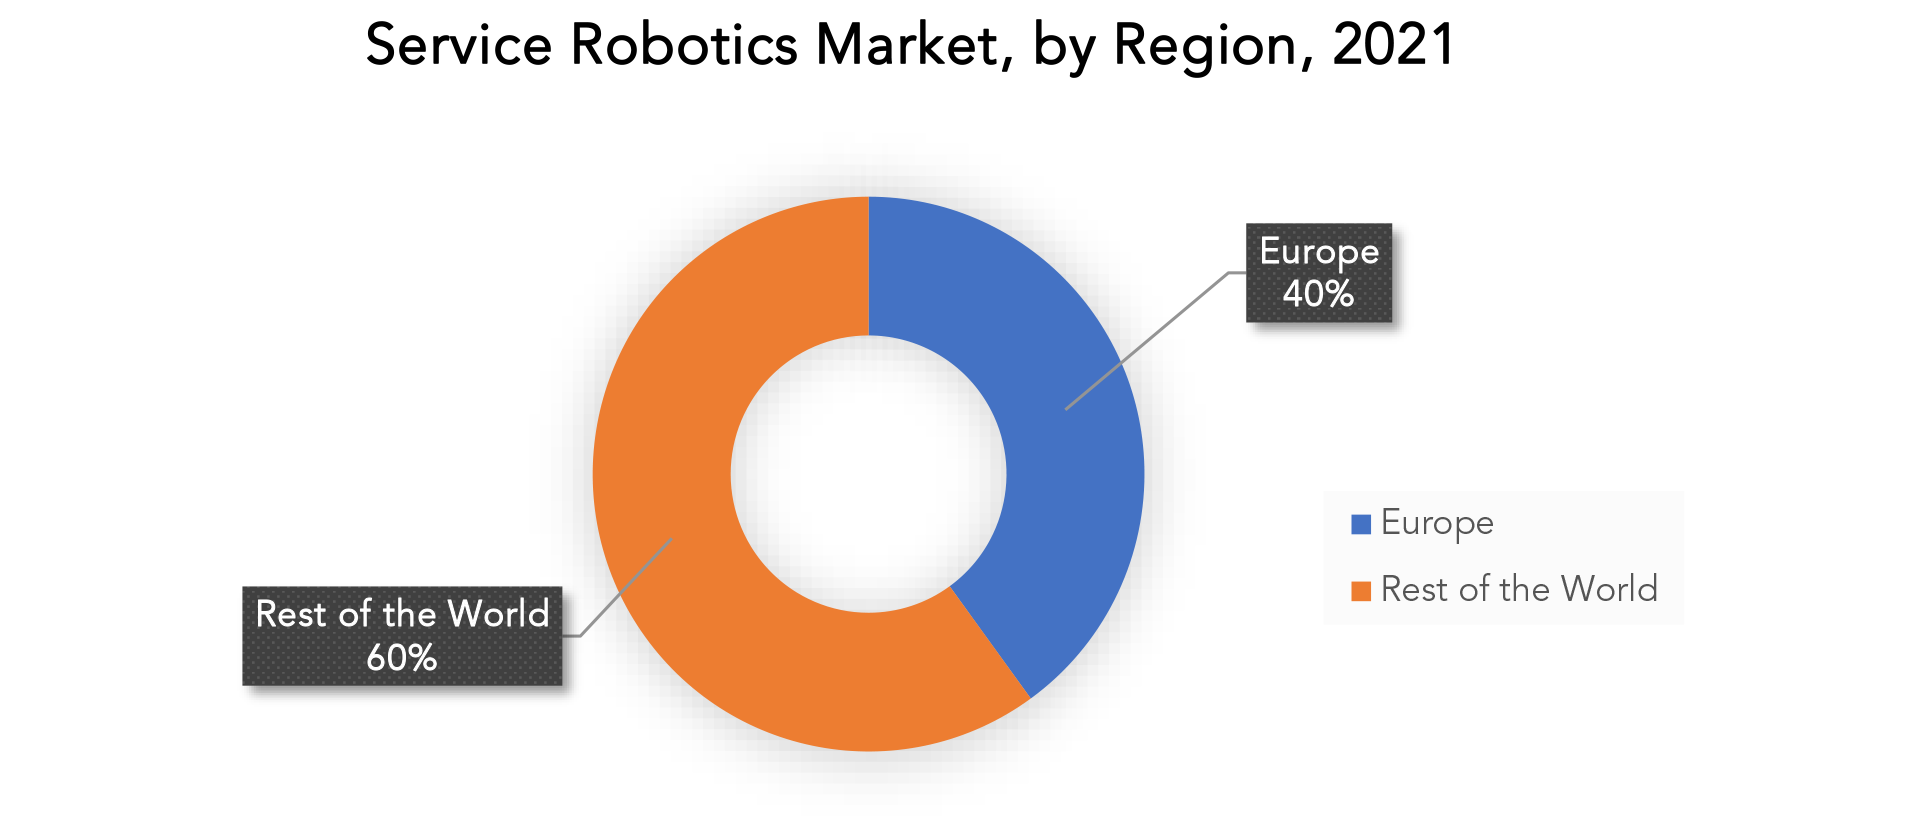
Key Market Segments: Service Robotics Market
Service Robotics Market By Type, 2020-2029, (Usd Billion)- Professional Service Robotics
- Personal Service Robotics
- Healthcare
- Defense
- Field
- Logistics
- Construction
- Domestic
- Entertainment
- Other
- North America
- Asia Pacific
- Europe
- South America
- Middle East And Africa
Exactitude Consultancy Services Key Objectives:
- Increasing sales and market share
- Developing new technology
- Improving profitability
- Entering new markets
- Enhancing brand reputation
Key Question Answered
- What is the expected growth rate of the service robotics market over the next 7 years?
- Who are the major players in the service robotics market and what is their market share?
- What are the end-user industries driving demand for market and what is their outlook?
- What are the opportunities for growth in emerging markets such as Asia-Pacific, Middle East, and Africa?
- How is the economic environment affecting the service robotics market, including factors such as interest rates, inflation, and exchange rates?
- What is the expected impact of government policies and regulations on the service robotics market?
- What is the current and forecasted size and growth rate of the global service robotics market?
- What are the key drivers of growth in the service robotics market?
- What are the distribution channels and supply chain dynamics in the service robotics market?
- What are the technological advancements and innovations in the service robotics market and their impact on product development and growth?
- What are the regulatory considerations and their impact on the market?
- What are the challenges faced by players in the service robotics market and how are they addressing these challenges?
- What are the opportunities for growth and expansion in the service robotics market?
- What are the product offerings and specifications of leading players in the market?
- What is the pricing trend of service robotics' in the market and what is the impact of raw material prices on the price trend?
- INTRODUCTION
- MARKET DEFINITION
- MARKET SEGMENTATION
- RESEARCH TIMELINES
- ASSUMPTIONS AND LIMITATIONS
- RESEARCH METHODOLOGY
- DATA MINING
- SECONDARY RESEARCH
- PRIMARY RESEARCH
- SUBJECT-MATTER EXPERTS’ ADVICE
- QUALITY CHECKS
- FINAL REVIEW
- DATA TRIANGULATION
- BOTTOM-UP APPROACH
- TOP-DOWN APPROACH
- RESEARCH FLOW
- DATA SOURCES
- DATA MINING
- EXECUTIVE SUMMARY
- MARKET OVERVIEW
- GLOBAL SERVICE ROBOTICS MARKET OUTLOOK
- MARKET DRIVERS
- MARKET RESTRAINTS
- MARKET OPPORTUNITIES
- IMPACT OF COVID-19 ON SERVICE ROBOTICS MARKET
- PORTER’S FIVE FORCES MODEL
- THREAT FROM NEW ENTRANTS
- THREAT FROM SUBSTITUTES
- BARGAINING POWER OF SUPPLIERS
- BARGAINING POWER OF CUSTOMERS
- DEGREE OF COMPETITION
- INDUSTRY VALUE CHAIN ANALYSIS
- GLOBAL SERVICE ROBOTICS MARKET OUTLOOK
- GLOBAL SERVICE ROBOTICS MARKET BY TYPE, 2020-2029, (USD BILLION), (THOUSAND UNITS)
- PROFESSIONAL SERVICE ROBOTICS
- PERSONAL SERVICE ROBOTICS
- GLOBAL SERVICE ROBOTICS MARKET BY APPLICATION, 2020-2029, (USD BILLION), (THOUSAND UNITS)
- HEALTHCARE
- DEFENSE
- FIELD
- LOGISTICS
- CONSTRUCTION
- DOMESTIC
- ENTERTAINMENT
- OTHER
- GLOBAL SERVICE ROBOTICS MARKET BY REGION, 2020-2029, (USD BILLION), (THOUSAND UNITS)
- NORTH AMERICA
- US
- CANADA
- MEXICO
- SOUTH AMERICA
- BRAZIL
- ARGENTINA
- COLOMBIA
- REST OF SOUTH AMERICA
- EUROPE
- GERMANY
- UK
- FRANCE
- ITALY
- SPAIN
- RUSSIA
- REST OF EUROPE
- ASIA PACIFIC
- INDIA
- CHINA
- JAPAN
- SOUTH KOREA
- AUSTRALIA
- SOUTH-EAST ASIA
- REST OF ASIA PACIFIC
- MIDDLE EAST AND AFRICA
- UAE
- SAUDI ARABIA
- SOUTH AFRICA
- REST OF MIDDLE EAST AND AFRICA
- NORTH AMERICA
- COMPANY PROFILES* (BUSINESS OVERVIEW, COMPANY SNAPSHOT, PRODUCTS OFFERED, RECENT DEVELOPMENTS)
- IROBOT CORPORATION
- INTUITIVE SURGICAL INC
- HONDA MOTOR CO., LTD.
- PANASONIC CORPORATION
- AETHON INC.
- YUJIN ROBOT CO. LTD.
- SAMSUNG ELECTRONICS CO.LTD.
- DELAVAL ROBERT
- BOSCH GMBH
- AB ELECTROLUX *THE COMPANY LIST IS INDICATIVE
LIST OF TABLES
TABLE 1 GLOBAL SERVICE ROBOTICS MARKET BY TYPE (USD BILLION), 2020-2029
TABLE 2 GLOBAL SERVICE ROBOTICS MARKET BY APPLICATION (USD BILLION), 2020-2029
TABLE 3 GLOBAL SERVICE ROBOTICS MARKET BY REGION (USD BILLION), 2020-2029
TABLE 4 NORTH AMERICA SERVICE ROBOTICS MARKET BY TYPE (USD BILLION), 2020-2029
TABLE 5 NORTH AMERICA SERVICE ROBOTICS MARKET BY APPLICATION (USD BILLION), 2020-2029
TABLE 6 NORTH AMERICA SERVICE ROBOTICS MARKET BY COUNTRY (USD BILLION), 2020-2029
TABLE 7 US SERVICE ROBOTICS MARKET BY TYPE (USD BILLION), 2020-2029
TABLE 8 US SERVICE ROBOTICS MARKET BY APPLICATION (USD BILLION), 2020-2029
TABLE 9 CANADA SERVICE ROBOTICS MARKET BY TYPE (BILLION), 2020-2029
TABLE 10 CANADA SERVICE ROBOTICS MARKET BY APPLICATION (USD BILLION), 2020-2029
TABLE 11 MEXICO SERVICE ROBOTICS MARKET BY TYPE (USD BILLION), 2020-2029
TABLE 12 MEXICO SERVICE ROBOTICS MARKET BY APPLICATION (USD BILLION), 2020-2029
TABLE 13 SOUTH AMERICA SERVICE ROBOTICS MARKET BY TYPE (USD BILLION), 2020-2029
TABLE 14 SOUTH AMERICA SERVICE ROBOTICS MARKET BY APPLICATION (USD BILLION), 2020-2029
TABLE 15 SOUTH AMERICA SERVICE ROBOTICS MARKET BY COUNTRY (USD BILLION), 2020-2029
TABLE 16 BRAZIL SERVICE ROBOTICS MARKET BY TYPE (USD BILLION), 2020-2029
TABLE 17 BRAZIL SERVICE ROBOTICS MARKET BY APPLICATION (USD BILLION), 2020-2029
TABLE 18 ARGENTINA SERVICE ROBOTICS MARKET BY TYPE (USD BILLION), 2020-2029
TABLE 19 ARGENTINA SERVICE ROBOTICS MARKET BY APPLICATION (USD BILLION), 2020-2029
TABLE 20 COLOMBIA SERVICE ROBOTICS MARKET BY TYPE (USD BILLION), 2020-2029
TABLE 21 COLOMBIA SERVICE ROBOTICS MARKET BY APPLICATION (USD BILLION), 2020-2029
TABLE 22 REST OF SOUTH AMERICA SERVICE ROBOTICS MARKET BY TYPE (USD BILLION), 2020-2029
TABLE 23 REST OF SOUTH AMERICA SERVICE ROBOTICS MARKET BY APPLICATION (USD BILLION), 2020-2029
TABLE 24 ASIA-PACIFIC SERVICE ROBOTICS MARKET BY TYPE (USD BILLION), 2020-2029
TABLE 25 ASIA-PACIFIC SERVICE ROBOTICS MARKET BY APPLICATION (USD BILLION), 2020-2029
TABLE 26 ASIA-PACIFIC SERVICE ROBOTICS MARKET BY COUNTRY (USD BILLION), 2020-2029
TABLE 27 INDIA SERVICE ROBOTICS MARKET BY TYPE (USD BILLION), 2020-2029
TABLE 28 INDIA SERVICE ROBOTICS MARKET BY APPLICATION (USD BILLION), 2020-2029
TABLE 29 CHINA SERVICE ROBOTICS MARKET BY TYPE (USD BILLION), 2020-2029
TABLE 30 CHINA SERVICE ROBOTICS MARKET BY APPLICATION (USD BILLION), 2020-2029
TABLE 31 JAPAN SERVICE ROBOTICS MARKET BY TYPE (USD BILLION), 2020-2029
TABLE 32 JAPAN SERVICE ROBOTICS MARKET BY APPLICATION (USD BILLION), 2020-2029
TABLE 33 SOUTH KOREA SERVICE ROBOTICS MARKET BY TYPE (USD BILLION), 2020-2029
TABLE 34 SOUTH KOREA SERVICE ROBOTICS MARKET BY APPLICATION (USD BILLION), 2020-2029
TABLE 35 AUSTRALIA SERVICE ROBOTICS MARKET BY TYPE (USD BILLION), 2020-2029
TABLE 36 AUSTRALIA SERVICE ROBOTICS MARKET BY APPLICATION (USD BILLION), 2020-2029
TABLE 37 SOUTH EAST ASIA SERVICE ROBOTICS MARKET BY TYPE (USD BILLION), 2020-2029
TABLE 38 SOUTH EAST ASIA SERVICE ROBOTICS BY TYPE (THOUSAND UNITS), 2020-2029
TABLE 39 SOUTH EAST ASIA SERVICE ROBOTICS MARKET BY APPLICATION (USD BILLION), 2020-2029
TABLE 40 REST OF ASIA PACIFIC SERVICE ROBOTICS MARKET BY TYPE (USD BILLION), 2020-2029
TABLE 41 REST OF ASIA PACIFIC SERVICE ROBOTICS MARKET BY APPLICATION (USD BILLION), 2020-2029
TABLE 42 EUROPE SERVICE ROBOTICS MARKET BY TYPE (USD BILLION), 2020-2029
TABLE 43 EUROPE SERVICE ROBOTICS MARKET BY APPLICATION (USD BILLION), 2020-2029
TABLE 44 EUROPE SERVICE ROBOTICS MARKET BY COUNTRY (USD BILLION), 2020-2029
TABLE 45 GERMANY SERVICE ROBOTICS MARKET BY TYPE (USD BILLION), 2020-2029
TABLE 46 GERMANY SERVICE ROBOTICS MARKET BY APPLICATION (USD BILLION), 2020-2029
TABLE 47 UK SERVICE ROBOTICS MARKET BY TYPE (USD BILLION), 2020-2029
TABLE 48 UK SERVICE ROBOTICS MARKET BY APPLICATION (USD BILLION), 2020-2029
TABLE 49 FRANCE SERVICE ROBOTICS MARKET BY TYPE (USD BILLION), 2020-2029
TABLE 50 FRANCE SERVICE ROBOTICS MARKET BY APPLICATION (USD BILLION), 2020-2029
TABLE 51 ITALY SERVICE ROBOTICS MARKET BY TYPE (USD BILLION), 2020-2029
TABLE 52 ITALY SERVICE ROBOTICS MARKET BY APPLICATION (USD BILLION), 2020-2029
TABLE 53 SPAIN SERVICE ROBOTICS MARKET BY TYPE (USD BILLION), 2020-2029
TABLE 54 SPAIN SERVICE ROBOTICS MARKET BY APPLICATION (USD BILLION), 2020-2029
TABLE 55 RUSSIA SERVICE ROBOTICS MARKET BY TYPE (USD BILLION), 2020-2029
TABLE 56 RUSSIA SERVICE ROBOTICS MARKET BY APPLICATION (USD BILLION), 2020-2029
TABLE 57 REST OF EUROPE SERVICE ROBOTICS MARKET BY TYPE (USD BILLION), 2020-2029
TABLE 58 REST OF EUROPE SERVICE ROBOTICS MARKET BY APPLICATION (USD BILLION), 2020-2029
TABLE 59 MIDDLE EAST AND AFRICA SERVICE ROBOTICS MARKET BY TYPE (USD BILLION), 2020-2029
TABLE 60 MIDDLE EAST AND AFRICA SERVICE ROBOTICS MARKET BY APPLICATION (USD BILLION), 2020-2029
TABLE 61 MIDDLE EAST AND AFRICA SERVICE ROBOTICS MARKET BY COUNTRY (USD BILLION), 2020-2029
TABLE 62 UAE SERVICE ROBOTICS MARKET BY TYPE (USD BILLION), 2020-2029
TABLE 63 UAE SERVICE ROBOTICS MARKET BY APPLICATION (USD BILLION), 2020-2029
TABLE 64 SAUDI ARABIA SERVICE ROBOTICS MARKET BY TYPE (USD BILLION), 2020-2029
TABLE 65 SAUDI ARABIA SERVICE ROBOTICS MARKET BY APPLICATION (USD BILLION), 2020-2029
TABLE 66 SOUTH AFRICA SERVICE ROBOTICS MARKET BY TYPE (USD BILLION), 2020-2029
TABLE 67 SOUTH AFRICA SERVICE ROBOTICS MARKET BY APPLICATION (USD BILLION), 2020-2029
TABLE 68 REST OF MIDDLE EAST AND AFRICA SERVICE ROBOTICS MARKET BY TYPE (USD BILLION), 2020-2029
TABLE 69 REST OF MIDDLE EAST AND AFRICA SERVICE ROBOTICS MARKET BY APPLICATION (USD BILLION), 2020-2029
LIST OF FIGURES
FIGURE 1 MARKET DYNAMICS
FIGURE 2 MARKET SEGMENTATION
FIGURE 3 REPORT TIMELINES: YEARS CONSIDERED
FIGURE 4 DATA TRIANGULATION
FIGURE 5 BOTTOM-UP APPROACH
FIGURE 6 TOP-DOWN APPROACH
FIGURE 7 RESEARCH FLOW
FIGURE 8 GLOBAL SERVICE ROBOTICS MARKET BY TYPE, USD MILLION, 2020-2029
FIGURE 9 GLOBAL SERVICE ROBOTICS MARKET BY APPLICATION, USD MILLION, 2020-2029
FIGURE 10 GLOBAL SERVICE ROBOTICS MARKET BY REGION, USD MILLION, 2020-2029
FIGURE 11 PORTER’S FIVE FORCES MODEL
FIGURE 12 GLOBAL SERVICE ROBOTICS MARKET BY TYPE 2021
FIGURE 13 GLOBAL SERVICE ROBOTICS MARKET BY APPLICATION 2021
FIGURE 14 GLOBAL SERVICE ROBOTICS MARKET BY REGION 2021
FIGURE 15 MARKET SHARE ANALYSIS
FIGURE 16 IROBOT CORPORATION: COMPANY SNAPSHOT
FIGURE 17 INTUITIVE SURGICAL INC.: COMPANY SNAPSHOT
FIGURE 18 HONDA MOTOR CO. LTD: COMPANY SNAPSHOT
FIGURE 19 PANASONIC CORPORATION: COMPANY SNAPSHOT
FIGURE 20 AETHON INC: COMPANY SNAPSHOT
FIGURE 21 YUJIN ROBOT CO. LTD: COMPANY SNAPSHOT
FIGURE 22 SAMSUNG ELECTRONIC CO.: COMPANY SNAPSHOT
FIGURE 23 DELAVAL.: COMPANY SNAPSHOT
FIGURE 24 ROBERT BOSCH GMBH: COMPANY SNAPSHOT
FIGURE 26 AB ELECTROLUX: COMPANY SNAPSHOT
DOWNLOAD FREE SAMPLE REPORT
License Type
SPEAK WITH OUR ANALYST
Want to know more about the report or any specific requirement?
WANT TO CUSTOMIZE THE REPORT?
Our Clients Speak
We asked them to research ‘ Equipment market’ all over the world, and their whole arrangement was helpful to us. thehealthanalytics.com insightful analysis and reports contributed to our current analysis and in creating a future strategy. Besides, the te
Yosuke Mitsui
Senior Associate Construction Equipment Sales & Marketing
We asked them to research ‘Equipment market’ all over the world, and their whole arrangement was helpful to us. thehealthanalytics.com insightful analysis and reports contributed to our current analysis and in creating a future strategy. Besides, the te


