

Base Year Value ()
x.x %
x.x %
CAGR ()
x.x %
x.x %
Forecast Year Value ()
x.x %
x.x %
Historical Data Period
Largest Region
Forecast Period
IoT Connectivity Market by Component (Solution, Services, Platform) By End User Industry (Metal & Mining, Chemical, Manufacturing, Energy & Power, Oil & Gas, Healthcare, Logistics & Transport, Agriculture and Other) and Region, Global trends and forecast from 2023 to 2029
Instant access to hundreds of data points and trends
- Market estimates from 2014-2029
- Competitive analysis, industry segmentation, financial benchmarks
- Incorporates SWOT, Porter's Five Forces and risk management frameworks
- PDF report or online database with Word, Excel and PowerPoint export options
- 100% money back guarantee
IoT Connectivity Market Overview
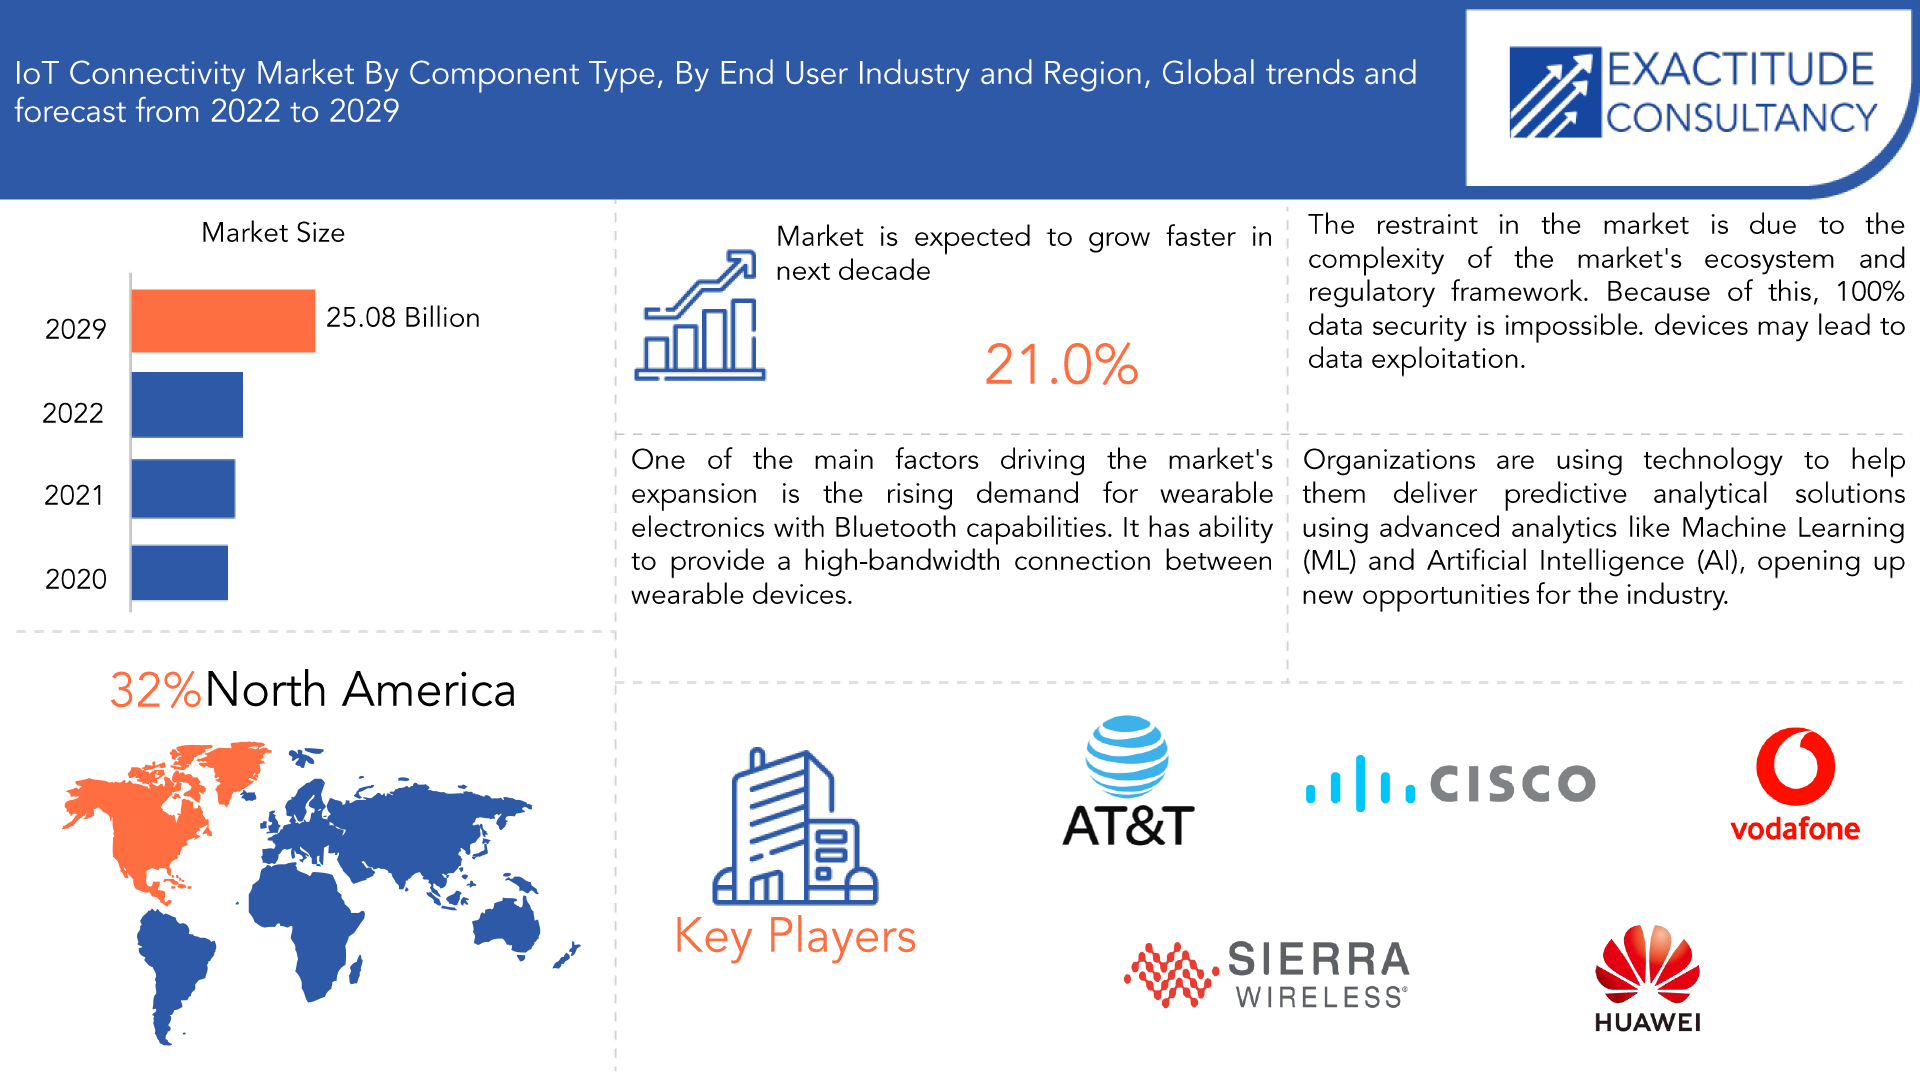
The IoT connectivity market is expected to grow at 21% CAGR from 2022 to 2029. It is expected to reach above USD 25.08 billion by 2029 from USD 4.51 billion in 2020.
Connecting IoT devices, such as gateways, applications, sensors, trackers, and network routers, is referred to as IoT connectivity. An IoT device connects to the cloud, other devices, and combination points like IoT gateways using IoT connectivity. An IoT device can be anything from a simple sensor to a self-driving car, and it includes applications for everything from streetlights to robots. By enabling action to be taken, services to be provided, and revenue to be generated, IoT connectivity adds value to IoT. IoT connectivity is necessary for features with extremely high speeds and extremely low latency.
Coverage, energy efficiency, and data rate are the three key technical criteria for any enterprise wishing to connect to the Internet of Things. Every radio technology has to make trade-offs, so no one technology can excel in every one of these areas. This kind of connectivity, including Wi-Fi and cellular options, can be powered by IoT connectivity via an IoT network solution.
A number of technologies, including real-time analytics, machine learning, embedded systems, sensors systems, and others, are known to have been merged to create the Internet of Things (IoT). The Internet of Things (IoT) system is internally correlated with mechanical, digital, and computing devices that are permitted with unique identification codes and can transfer data on networks without direct human-machine interaction.
| ATTRIBUTE | DETAILS |
| Study period | 2020-2029 |
| Base year | 2021 |
| Estimated year | 2022 |
| Forecasted year | 2022-2029 |
| Historical period | 2018-2020 |
| Unit | Value (USD BILLION) |
| Segmentation | By Component Type, By End User Industry, By Region |
| By Component Type
|
|
| By End User Industry
|
|
| By Region
|
|
One of the main factors driving the market's expansion is the rising demand for wearable electronics with Bluetooth capabilities. Due to its ability to provide a high-bandwidth connection between wearable devices, Bluetooth has been gaining popularity in consumer electronics. Bluetooth connects two devices much faster and with much less energy consumption than Wi-Fi.
There are many uses for internet of things technology, from collecting biometric information with wearable gadgets to managing connected devices with communication networks and cloud platforms. These gadgets can communicate and share data with other gadgets thanks to their distinctive IP addresses.
However, as the number of platforms, smart, mobile, and connected devices increase, so does the demand for data protection and privacy. These systems and networks may contain private and sensitive information that hackers could access. The increased reliance on connected devices may lead to data exploitation, which would reflect connected device design flows and vulnerabilities. Many data protection businesses are creating a variety of solutions. However, due to the complexity of the market's ecosystem and regulatory framework, 100% data security is impossible.
Organizations are using technology to help them deliver prescriptive and predictive analytical solutions using advanced analytics and methodologies like Machine Learning (ML) and Artificial Intelligence (AI), opening up new opportunities for the industry. Because ML and AI are capable of continuous learning without breaks or downtime, they are a more in-demand tool in the IoT market, which is boosting market growth over the forecast period. Due to its cutting-edge capabilities, such as its ability to offer IoT devices independence for analysis and data management, the industrial IoT is increasingly adopting edge computing.
[caption id="attachment_16113" align="aligncenter" width="1920"]
Frequently Asked Questions
• What is the worth of IoT Connectivity market?
The IoT Connectivity market size had crossed USD 5.41 billion in 2020 and will observe a CAGR of more than 21% up to 2029.
• What is the size of the Asia Pacific IoT Connectivity industry?
North America held more than 32% of the IoT Connectivity market revenue share in 2021 and will witness expansion in the forecast period.
• What are some of the market's driving forces?
Drivers such as the presence of major expanding need to enhance operational proficiency, including automated quality assurance monitoring, large profit margins from increased power efficiency, productivity growth, and manufacturing industry efficiency.
• Which are the top companies to hold the market share in IoT Connectivity market?
Key players profiled in the report include AT&T, Cisco, Verizon Enterprise Solutions, Vodafone, Ericsson, Sierra Wireless, Orange Business Services, Telefónica, Huawei, Telit, Hologram, Particle, Aeris, EMnify, Moeco and Sigfox.
• What is the leading application of IoT Connectivity market?
One of the key trends is the use of technology to help them deliver prescriptive and predictive analytical solutions using advanced analytics and methodologies like Machine Learning (ML) and Artificial Intelligence (AI).
• Which is the largest regional market for IoT Connectivity market?
The region's largest share is Asia Pacific. Market growth in the North America region is primarily driven by increasing IoT Connectivity demands and origins of big market players.
IoT Connectivity Market Segment Analysis
The IoT Connectivity market is segmented based on type, end user industry and Region, Global trends and forecast.
By type, the market is IoT connectivity market by component (solution, services, platform) by end user industry (metal & mining, chemical, manufacturing, energy & power, oil & gas, healthcare, logistics & transport, agriculture and other).
Over 52% of the market's revenue in 2022 came from the solution segment, which is expected to continue to dominate the market during the forecast period. As part of their efforts to increase their market share, solution providers are placing a lot of emphasis on the introduction of cutting-edge information systems for various industries and industry verticals. The significant increase in connected devices, which generate a ton of data, is blamed for the growth. IoT applications also depend on centralized cloud services to control data flow and the industry's overall processes.
With a market share of over 18% in 2022, the manufacturing sector had the largest market share and is expected to continue to dominate during the forecast period. With the advent of Industry 4.0, IoT is becoming more and more popular in discrete as well as process manufacturing because it provides a number of opportunities to optimize operations, reduce downtime, increase efficiency, and support the use of data-driven decisions, all of which increase profit margins and lower costs with quick returns on IoT adoption. Additionally, the adoption of IoT in these advanced technologies is crucial, which is expected to accelerate market growth. Manufacturing industries are quickly leveraging digital manufacturing technologies.
[caption id="attachment_16119" align="aligncenter" width="1920"]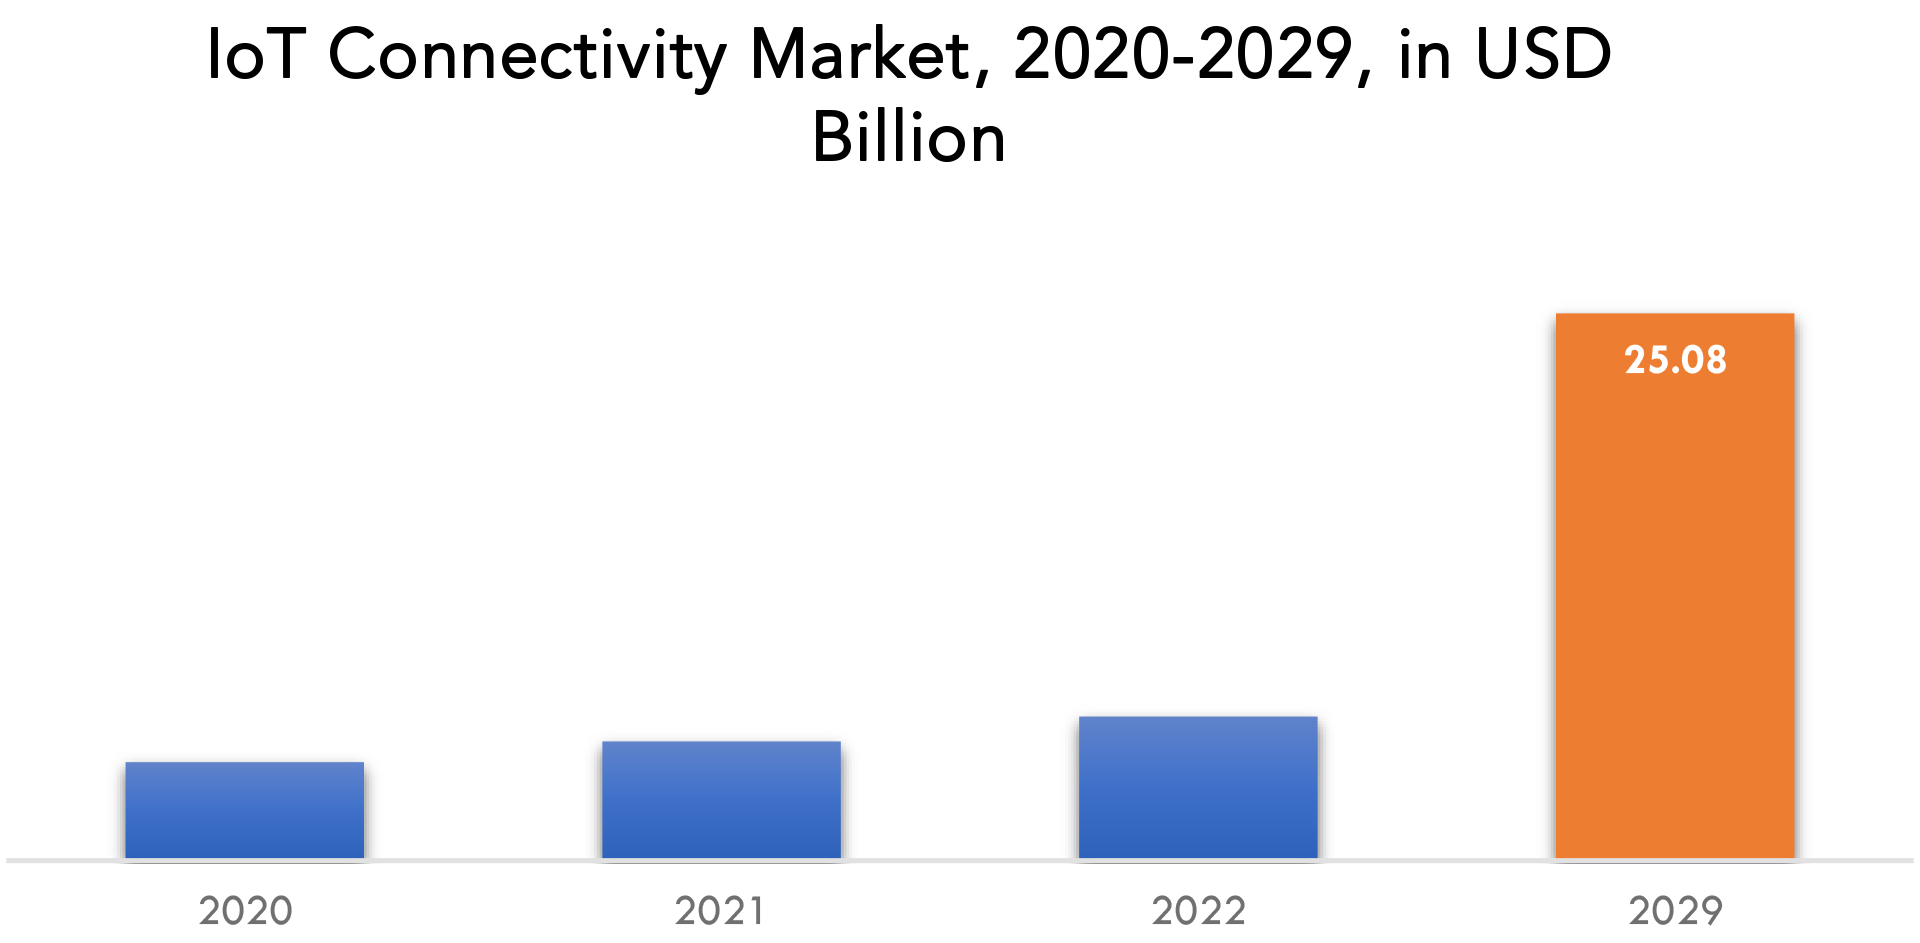
IoT Connectivity Market Players
The IoT Connectivity market key players include AT&T, Cisco, Verizon Enterprise Solutions, Vodafone, Ericsson, Sierra Wireless, Orange Business Services, Telefónica, Huawei, Telit, Hologram, Particle, Aeris, EMnify, Moeco and Sigfox.
Who Should Buy? Or Key Stakeholders
- IoT Connectivity Suppliers
- Raw Materials Manufacturers
- Research Organizations
- Investors
- End-users
- Government Authorities
- Consulting And Research Firm
- Others
IoT Connectivity Market Regional Analysis
The IoT Connectivity market by region includes North America, Asia-Pacific (APAC), Europe, South America, and Middle East & Africa (MEA).
- North America: includes the US, Canada, Mexico
- Asia Pacific: includes China, Japan, South Korea, India, Australia, ASEAN and Rest of APAC
- Europe: includes UK, Germany, France, Italy, Spain, Russia, and Rest of Europe
- South America: includes Brazil, Argentina and Rest of South America
- Middle East & Africa: includes Turkey, UAE, Saudi Arabia, South Africa, and Rest of MEA
With a market share of over 32% in 2022, North America held the largest share and is anticipated to continue to dominate during the forecast period. This is a result of the area's early adoption and application of industrial IoT technology. Additionally, during the forecast period, the market growth is anticipated to be driven by strong government support for promoting digitalization across the industrial sector, an increase in the use of industrial IoT devices, and increasing adoption of cutting-edge technologies like cloud computing and AI.
The fastest CAGR of over 26% is anticipated for the Asia Pacific region during the forecast period. Advanced factory automation systems are becoming more and more popular throughout the region, particularly in China and Japan. The region's manufacturing sectors are beginning to understand the advantages of using robot arm technology. Important nations in the region are also making significant investments in industry 4.0 because they want to be self-sufficient in terms of manufacturing and production. The regional market for the industrial internet of things is then anticipated to grow as a result.
[caption id="attachment_16124" align="aligncenter" width="1920"]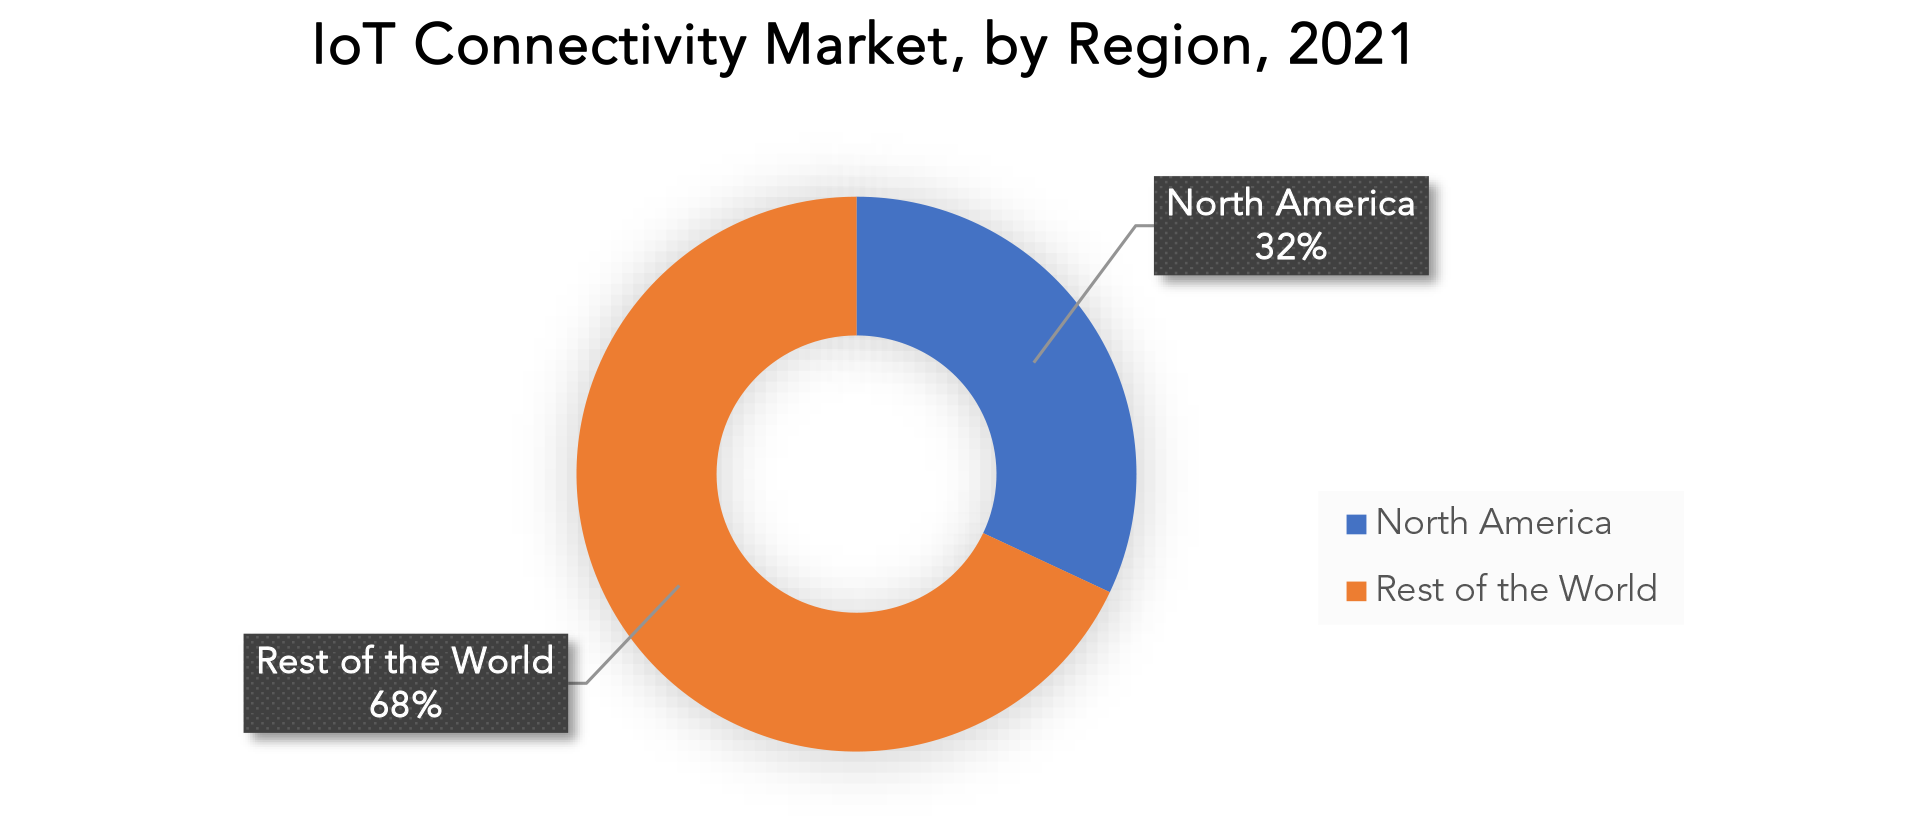
Key Market Segments: IoT Connectivity Market
IoT Connectivity Market By Component Type, 2020-2029, (Usd Billion)- Solution
- Services
- Platform
- Metal & Mining
- Chemical
- Manufacturing
- Energy & Power
- Oil & Gas
- Healthcare
- Logistics & Transport
- Agriculture
- Other
- North America
- Asia Pacific
- Europe
- South America
- Middle East And Africa
Exactitude Consultancy Services Key Objectives:
- Increasing sales and market share
- Developing new technology
- Improving profitability
- Entering new markets
- Enhancing brand reputation
Key Question Answered
- What is the expected growth rate of the IoT Connectivity market over the next 7 years?
- Who are the major players in the IoT Connectivity market and what is their market share?
- What are the end-user industries driving demand for market and what is their outlook?
- What are the opportunities for growth in emerging markets such as Asia-Pacific, Middle East, and Africa?
- How is the economic environment affecting the IoT Connectivity market, including factors such as interest rates, inflation, and exchange rates?
- What is the expected impact of government policies and regulations on the IoT Connectivity market?
- What is the current and forecasted size and growth rate of the global IoT Connectivity market?
- What are the key drivers of growth in the IoT Connectivity market?
- Who are the major players in the market and what is their market share?
- What are the distribution channels and supply chain dynamics in the IoT Connectivity market?
- What are the technological advancements and innovations in the IoT Connectivity market and their impact on product development and growth?
- What are the regulatory considerations and their impact on the market?
- What are the challenges faced by players in the IoT Connectivity market and how are they addressing these challenges?
- What are the opportunities for growth and expansion in the IoT Connectivity market?
- What are the service offerings and specifications of leading players in the market?
- Introduction
- Market Definition
- Market Segmentation
- Research Timelines
- Assumptions and Limitations
- Research Methodology
- Data Mining
- Secondary Research
- Primary Research
- Subject-Matter Experts’ Advice
- Quality Checks
- Final Review
- Data Triangulation
- Bottom-Up Approach
- Top-Down Approach
- Research Flow
- Data Sources
- Data Mining
- Executive Summary
- Market Overview
- Global IoT Connectivity Outlook
- Market Drivers
- Market Restraints
- Market Opportunities
- Impact of Covid-19 on IoT Connectivity Market
- Porter’s five forces model
- Threat from new entrants
- Threat from substitutes
- Bargaining power of suppliers
- Bargaining power of customers
- Degree of competition
- Industry value chain Analysis
- Global IoT Connectivity Outlook
- Global IoT Connectivity Market by Product type, 2020-2029
- Solution
- Services
- Platform
- Global IoT Connectivity Market by End User Industry, 2020-2029
- Metal & Mining
- Chemical
- Manufacturing
- Energy & Power
- Oil & Gas
- Healthcare
- Logistics & Transport
- Agriculture
- Other
- Global IoT Connectivity Market by Region
- North America
- US
- Canada
- Mexico
- South America
- Brazil
- Argentina
- Colombia
- Rest Of South America
- Europe
- Germany
- UK
- France
- Italy
- Spain
- Russia
- Rest Of Europe
- Asia Pacific
- India
- China
- Japan
- South Korea
- Australia
- South-East Asia
- Rest Of Asia Pacific
- Middle East and Africa
- UAE
- Saudi Arabia
- South Africa
- Rest Of Middle East and Africa
- North America
- Company Profiles*
(Business Overview, Company Snapshot, Products Offered, Recent Developments)
- The Dow Chemical Company
- AT&T
- Cisco
- Verizon Enterprise Solutions
- Vodafone
- Ericsson
- Sierra Wireless
- Orange Business Services
- Telefonica
- Huawei
- Telit
- Hologram
- Particle
- Aeris
- EMnify
- Moeco
- Sigfox
*The Company List Is Indicative
LIST OF TABLES
TABLE 1 GLOBAL IOT CONNECTIVITY MARKET BY COMPONENT TYPE (USD BILLION), 2020-2029
TABLE 2 GLOBAL IOT CONNECTIVITY MARKET BY END USER INDUSTRY (USD BILLION), 2020-2029
TABLE 3 GLOBAL IOT CONNECTIVITY MARKET BY REGION (USD BILLION), 2020-2029
TABLE 4 NORTH AMERICA IOT CONNECTIVITY MARKET BY COMPONENT TYPE (USD BILLION), 2020-2029
TABLE 5 NORTH AMERICA IOT CONNECTIVITY MARKET BY END USER INDUSTRY (USD BILLION), 2020-2029
TABLE 6 NORTH AMERICA IOT CONNECTIVITY MARKET BY COUNTRY (USD BILLION), 2020-2029
TABLE 7 US IOT CONNECTIVITY MARKET BY COMPONENT TYPE (USD BILLION), 2020-2029
TABLE 8 US IOT CONNECTIVITY MARKET BY END USER INDUSTRY (USD BILLION), 2020-2029
TABLE 9 CANADA IOT CONNECTIVITY MARKET BY COMPONENT TYPE (BILLION), 2020-2029
TABLE 10 CANADA IOT CONNECTIVITY MARKET BY END USER INDUSTRY (USD BILLION), 2020-2029
TABLE 11 MEXICO IOT CONNECTIVITY MARKET BY COMPONENT TYPE (USD BILLION), 2020-2029
TABLE 12 MEXICO IOT CONNECTIVITY MARKET BY END USER INDUSTRY (USD BILLION), 2020-2029
TABLE 13 SOUTH AMERICA IOT CONNECTIVITY MARKET BY COMPONENT TYPE (USD BILLION), 2020-2029
TABLE 14 SOUTH AMERICA IOT CONNECTIVITY MARKET BY END USER INDUSTRY (USD BILLION), 2020-2029
TABLE 15 SOUTH AMERICA IOT CONNECTIVITY MARKET BY COUNTRY (USD BILLION), 2020-2029
TABLE 16 BRAZIL IOT CONNECTIVITY MARKET BY COMPONENT TYPE (USD BILLION), 2020-2029
TABLE 17 BRAZIL IOT CONNECTIVITY MARKET BY END USER INDUSTRY (USD BILLION), 2020-2029
TABLE 18 ARGENTINA IOT CONNECTIVITY MARKET BY COMPONENT TYPE (USD BILLION), 2020-2029
TABLE 19 ARGENTINA IOT CONNECTIVITY MARKET BY END USER INDUSTRY (USD BILLION), 2020-2029
TABLE 20 COLOMBIA IOT CONNECTIVITY MARKET BY COMPONENT TYPE (USD BILLION), 2020-2029
TABLE 21 COLOMBIA IOT CONNECTIVITY MARKET BY END USER INDUSTRY (USD BILLION), 2020-2029
TABLE 22 REST OF SOUTH AMERICA IOT CONNECTIVITY MARKET BY COMPONENT TYPE (USD BILLION), 2020-2029
TABLE 23 REST OF SOUTH AMERICA IOT CONNECTIVITY MARKET BY END USER INDUSTRY (USD BILLION), 2020-2029
TABLE 24 ASIA-PACIFIC IOT CONNECTIVITY MARKET BY COMPONENT TYPE (USD BILLION), 2020-2029
TABLE 25 ASIA-PACIFIC IOT CONNECTIVITY MARKET BY END USER INDUSTRY (USD BILLION), 2020-2029
TABLE 26 ASIA-PACIFIC IOT CONNECTIVITY MARKET BY COUNTRY (USD BILLION), 2020-2029
TABLE 27 INDIA IOT CONNECTIVITY MARKET BY COMPONENT TYPE (USD BILLION), 2020-2029
TABLE 28 INDIA IOT CONNECTIVITY MARKET BY END USER INDUSTRY (USD BILLION), 2020-2029
TABLE 29 CHINA IOT CONNECTIVITY MARKET BY COMPONENT TYPE (USD BILLION), 2020-2029
TABLE 30 CHINA IOT CONNECTIVITY MARKET BY END USER INDUSTRY (USD BILLION), 2020-2029
TABLE 31 JAPAN IOT CONNECTIVITY MARKET BY COMPONENT TYPE (USD BILLION), 2020-2029
TABLE 32 JAPAN IOT CONNECTIVITY MARKET BY END USER INDUSTRY (USD BILLION), 2020-2029
TABLE 33 SOUTH KOREA IOT CONNECTIVITY MARKET BY COMPONENT TYPE (USD BILLION), 2020-2029
TABLE 34 SOUTH KOREA IOT CONNECTIVITY MARKET BY END USER INDUSTRY (USD BILLION), 2020-2029
TABLE 35 AUSTRALIA IOT CONNECTIVITY MARKET BY COMPONENT TYPE (USD BILLION), 2020-2029
TABLE 36 AUSTRALIA IOT CONNECTIVITY MARKET BY END USER INDUSTRY (USD BILLION), 2020-2029
TABLE 37 SOUTH EAST ASIA IOT CONNECTIVITY MARKET BY COMPONENT TYPE (USD BILLION), 2020-2029
TABLE 39 SOUTH EAST ASIA IOT CONNECTIVITY MARKET BY END USER INDUSTRY (USD BILLION), 2020-2029
TABLE 40 REST OF ASIA PACIFIC IOT CONNECTIVITY MARKET BY COMPONENT TYPE (USD BILLION), 2020-2029
TABLE 41 REST OF ASIA PACIFIC IOT CONNECTIVITY MARKET BY END USER INDUSTRY (USD BILLION), 2020-2029
TABLE 42 EUROPE IOT CONNECTIVITY MARKET BY COMPONENT TYPE (USD BILLION), 2020-2029
TABLE 43 EUROPE IOT CONNECTIVITY MARKET BY END USER INDUSTRY (USD BILLION), 2020-2029
TABLE 44 EUROPE IOT CONNECTIVITY MARKET BY COUNTRY (USD BILLION), 2020-2029
TABLE 45 GERMANY IOT CONNECTIVITY MARKET BY COMPONENT TYPE (USD BILLION), 2020-2029
TABLE 46 GERMANY IOT CONNECTIVITY MARKET BY END USER INDUSTRY (USD BILLION), 2020-2029
TABLE 47 UK IOT CONNECTIVITY MARKET BY COMPONENT TYPE (USD BILLION), 2020-2029
TABLE 48 UK IOT CONNECTIVITY MARKET BY END USER INDUSTRY (USD BILLION), 2020-2029
TABLE 49 FRANCE IOT CONNECTIVITY MARKET BY COMPONENT TYPE (USD BILLION), 2020-2029
TABLE 50 FRANCE IOT CONNECTIVITY MARKET BY END USER INDUSTRY (USD BILLION), 2020-2029
TABLE 51 ITALY IOT CONNECTIVITY MARKET BY COMPONENT TYPE (USD BILLION), 2020-2029
TABLE 52 ITALY IOT CONNECTIVITY MARKET BY END USER INDUSTRY (USD BILLION), 2020-2029
TABLE 53 SPAIN IOT CONNECTIVITY MARKET BY COMPONENT TYPE (USD BILLION), 2020-2029
TABLE 54 SPAIN IOT CONNECTIVITY MARKET BY END USER INDUSTRY (USD BILLION), 2020-2029
TABLE 55 RUSSIA IOT CONNECTIVITY MARKET BY COMPONENT TYPE (USD BILLION), 2020-2029
TABLE 56 RUSSIA IOT CONNECTIVITY MARKET BY END USER INDUSTRY (USD BILLION), 2020-2029
TABLE 57 REST OF EUROPE IOT CONNECTIVITY MARKET BY COMPONENT TYPE (USD BILLION), 2020-2029
TABLE 58 REST OF EUROPE IOT CONNECTIVITY MARKET BY END USER INDUSTRY (USD BILLION), 2020-2029
TABLE 59 MIDDLE EAST AND AFRICA IOT CONNECTIVITY MARKET BY COMPONENT TYPE (USD BILLION), 2020-2029
TABLE 60 MIDDLE EAST AND AFRICA IOT CONNECTIVITY MARKET BY END USER INDUSTRY (USD BILLION), 2020-2029
TABLE 61 MIDDLE EAST AND AFRICA IOT CONNECTIVITY MARKET BY COUNTRY (USD BILLION), 2020-2029
TABLE 62 UAE IOT CONNECTIVITY MARKET BY COMPONENT TYPE (USD BILLION), 2020-2029
TABLE 63 UAE IOT CONNECTIVITY MARKET BY END USER INDUSTRY (USD BILLION), 2020-2029
TABLE 64 SAUDI ARABIA IOT CONNECTIVITY MARKET BY COMPONENT TYPE (USD BILLION), 2020-2029
TABLE 65 SAUDI ARABIA IOT CONNECTIVITY MARKET BY END USER INDUSTRY (USD BILLION), 2020-2029
TABLE 66 SOUTH AFRICA IOT CONNECTIVITY MARKET BY COMPONENT TYPE (USD BILLION), 2020-2029
TABLE 67 SOUTH AFRICA IOT CONNECTIVITY MARKET BY END USER INDUSTRY (USD BILLION), 2020-2029
TABLE 68 REST OF MIDDLE EAST AND AFRICA IOT CONNECTIVITY MARKET BY COMPONENT TYPE (USD BILLION), 2020-2029
TABLE 69 REST OF MIDDLE EAST AND AFRICA IOT CONNECTIVITY MARKET BY END USER INDUSTRY (USD BILLION), 2020-2029
LIST OF FIGURES
FIGURE 1 MARKET DYNAMICS
FIGURE 2 MARKET SEGMENTATION
FIGURE 3 REPORT TIMELINES: YEARS CONSIDERED
FIGURE 4 DATA TRIANGULATION
FIGURE 5 BOTTOM-UP APPROACH
FIGURE 6 TOP-DOWN APPROACH
FIGURE 7 RESEARCH FLOW
FIGURE 8 GLOBAL IOT CONNECTIVITY MARKET BY COMPONENT TYPE, USD BILLION, 2020-2029
FIGURE 9 GLOBAL IOT CONNECTIVITY MARKET BY END USER INDUSTRY, USD BILLION, 2020-2029
FIGURE 10 GLOBAL IOT CONNECTIVITY MARKET BY REGION, USD MILLION, 2020-2029
FIGURE 11 PORTER’S FIVE FORCES MODEL
FIGURE 12 IOT CONNECTIVITY MARKET BY REGION 2021
FIGURE 13 GLOBAL IOT CONNECTIVITY MARKET BY COMPONENT TYPE 2021
FIGURE 14 GLOBAL IOT CONNECTIVITY MARKET BY END USER INDUSTRY 2021
FIGURE 15 GLOBAL IOT CONNECTIVITY MARKET BY REGION 2021
FIGURE 16 MARKET SHARE ANALYSIS
FIGURE 17 AT&T: COMPANY SNAPSHOT
FIGURE 18 CISCO: COMPANY SNAPSHOT
FIGURE 19 VERIZON ENTERPRISE SOLUTIONS: COMPANY SNAPSHOT
FIGURE 20 VODAFONE: COMPANY SNAPSHOT
FIGURE 21 ERICSSON: COMPANY SNAPSHOT
FIGURE 22 SIERRA WIRELESS: COMPANY SNAPSHOT
FIGURE 23 ORANGE BUSINESS SERVICES: COMPANY SNAPSHOT
FIGURE 24 TELEFÓNICA: COMPANY SNAPSHOT
FIGURE 25 TELIT: COMPANY SNAPSHOT
FIGURE 26 HOLOGRAM: COMPANY SNAPSHOT
FIGURE 27 PARTICLE: COMPANY SNAPSHOT
FIGURE 28 AERIS: COMPANY SNAPSHOT
FIGURE 29 EMNIFY: COMPANY SNAPSHOT
FIGURE 30 MOECO: COMPANY SNAPSHOT
FIGURE 31 SIGFOX: COMPANY SNAPSHOT
DOWNLOAD FREE SAMPLE REPORT
License Type
SPEAK WITH OUR ANALYST
Want to know more about the report or any specific requirement?
WANT TO CUSTOMIZE THE REPORT?
Our Clients Speak
We asked them to research ‘ Equipment market’ all over the world, and their whole arrangement was helpful to us. thehealthanalytics.com insightful analysis and reports contributed to our current analysis and in creating a future strategy. Besides, the te
Yosuke Mitsui
Senior Associate Construction Equipment Sales & Marketing
We asked them to research ‘Equipment market’ all over the world, and their whole arrangement was helpful to us. thehealthanalytics.com insightful analysis and reports contributed to our current analysis and in creating a future strategy. Besides, the te


