

Base Year Value ()
x.x %
x.x %
CAGR ()
x.x %
x.x %
Forecast Year Value ()
x.x %
x.x %
Historical Data Period
Largest Region
Forecast Period
Breathable Membranes Market Size, Share & Trends Analysis Report by Type (Polyethylene (PE), Polypropylene (PP), Others), Application (Pitched Roof, Walls) and Region (North America, Europe, Asia Pacific, South America, Middle East, and Africa) Global Trends and Forecast from 2022 to 2029
Instant access to hundreds of data points and trends
- Market estimates from 2014-2029
- Competitive analysis, industry segmentation, financial benchmarks
- Incorporates SWOT, Porter's Five Forces and risk management frameworks
- PDF report or online database with Word, Excel and PowerPoint export options
- 100% money back guarantee
Breathable Membranes Market Overview
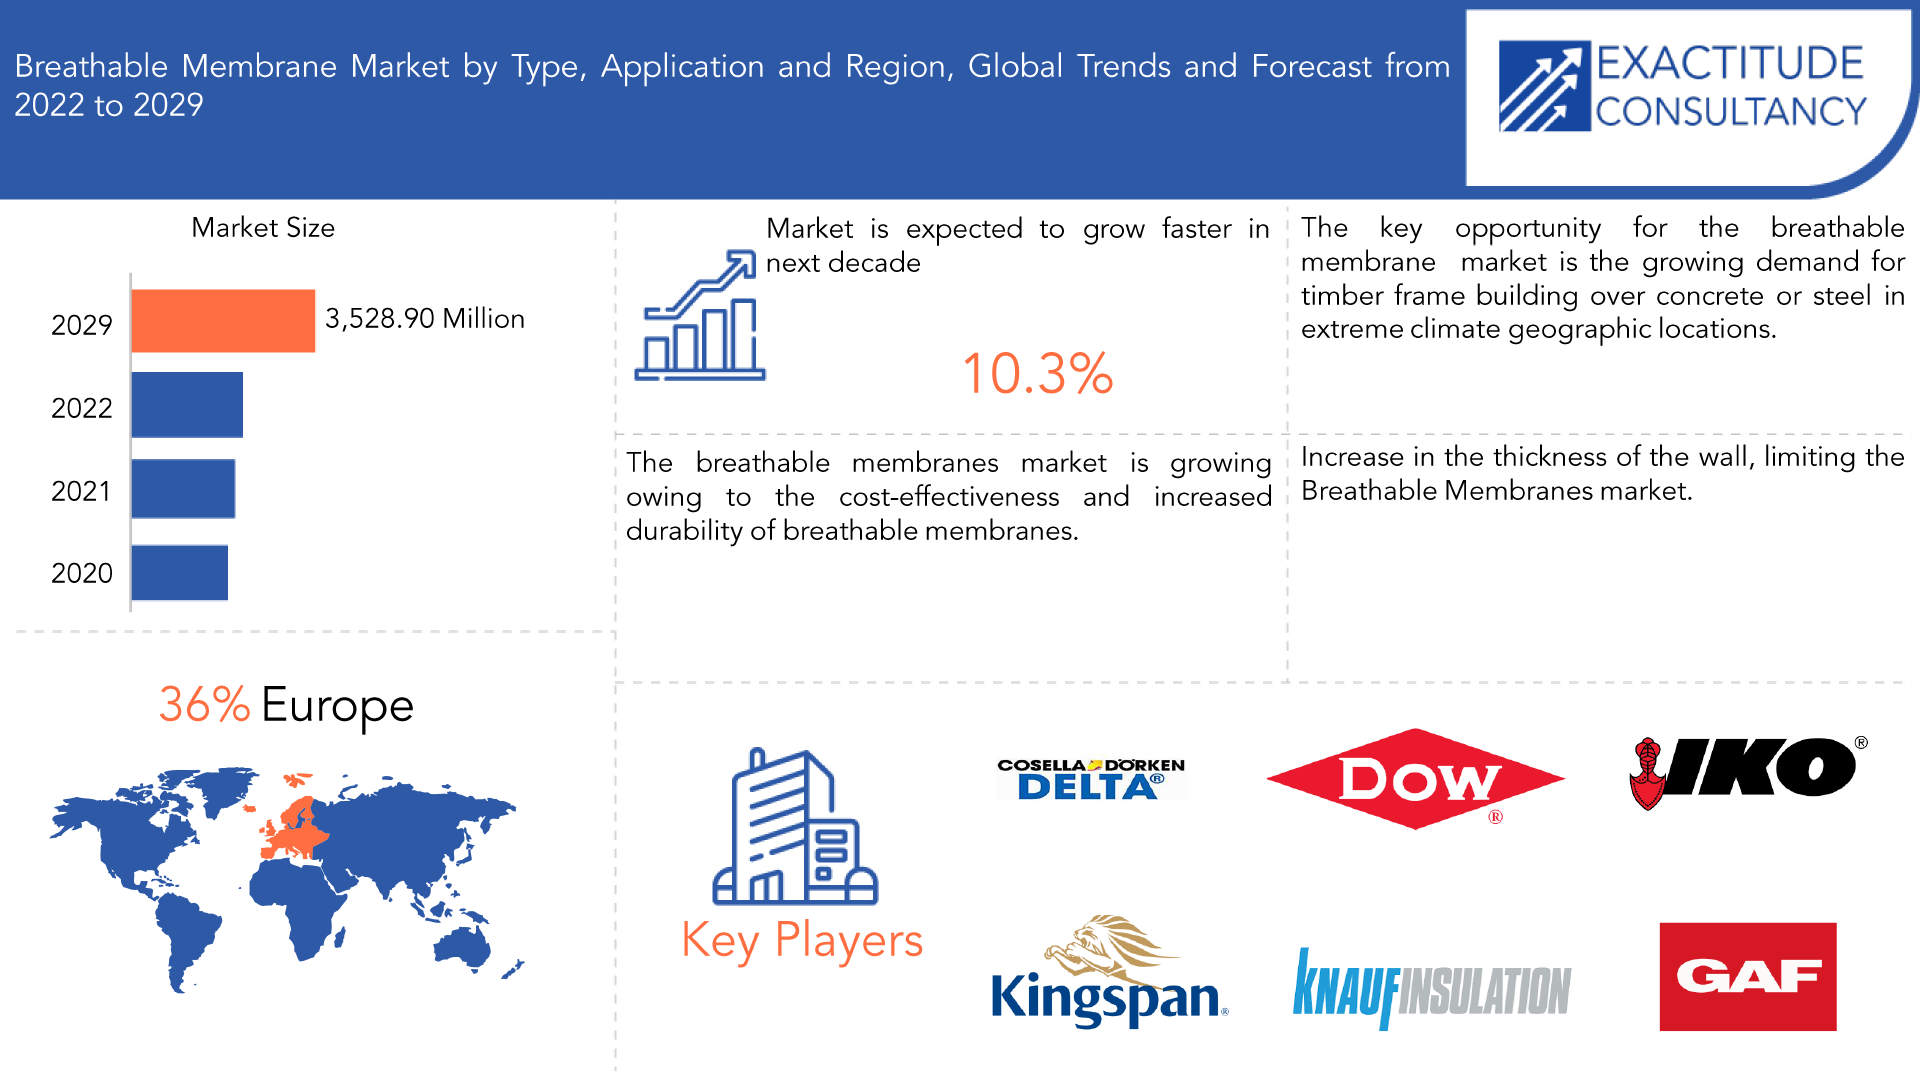
The global Breathable Membranes Market size is to be valued at USD 3,528.90 million by 2029 and is expected to grow at a compound annual growth rate (CAGR) of 10.3% during the forecast period.
The breathable membrane is a semi-porous sheet or foil that exchanges water vapor and prevents the diffusion of liquid water. Breathable membranes can pass through breathable membranes even if they are water-resistant and resistant to snow and dust too. They are typically used in external wall and roof constructions, such as tiled roofs or framed wall constructions, when the outer cladding may not be totally water-tight or moisture-resistant.
| ATTRIBUTE | DETAILS |
| Study period | 2020-2029 |
| Base year | 2022 |
| Estimated year | 2022 |
| Forecasted year | 2022-2029 |
| Historical period | 2018-2020 |
| Unit | Value (USD Million) (Million Square Meter) |
| Segmentation | By Type, Application, and Region. |
| By Type |
|
| By Application |
|
| By Region |
|
Breathable membrane films are extensively used in regions with high levels of precipitation, snowfall, and atmospheric moisture due to their water resistance. Breathable membranes are also utilized more and more for wall coverings, house wraps, and roof underlays since they help reduce energy consumption and improve thermal efficiency in a building. Excessive humidity in buildings can lead to major issues like mold growth, moist stains, corrosion, deterioration, and poor insulation, these problems can be solved by using breathable membranes.
The breathable membranes market is being driven by the membrane's low cost, the rising popularity of timber frame construction in European nations, and its superior UV resistance and breathable characteristics as compared to competing materials like non-breathable membranes and asphaltic papers. Moreover, rising consciousness, aiming to safeguard building resources from further wetness, and government restrictions for construction, minimizing energy usage are driving factors in the worldwide breathable membranes market.
[caption id="attachment_16197" align="aligncenter" width="1920"]
Frequently Asked Questions
• What is the worth of global breathable membranes market?
The breathable membranes market size had crossed USD 1,467 billion in 2020 and will observe a CAGR of more than 10.3% up to 2029
• Which market segments are covered in the report on the breathable membranes market?
Based on by type and application the breathable membranes market report's divisions are broken down.
• What is the CAGR of the breathable membranes market?
The global breathable membranes market registered a CAGR of 10.3% from 2022 to 2029.
• Which are the top companies to hold the market share in the breathable membranes market?
Key players profiled in the report include Cosella-Dorken, Dow, Inc., DuPont de Nemours Inc., GAF, IKO Industries Ltd., Kingspan Group PLC, Knauf Insulation, Low & Bonar PLC, Riwega S.R.L., Saint-Gobain SA, Soprema Group and others.
• which is the largest regional market for breathable membranes market?
Europe reported the largest share in the global for breathable membranes market.
Breathable Membranes Market Segment Analysis
The breathable membranes market is segmented on the basis of type and application.
On the basis of type, the market is divided into polyethylene, polypropylene, and others. Polyethylene (PE) based breathable membrane is projected to contribute significantly to the global breathable membranes market during the forecast period due to its exceptional properties such as long-term UV resistance and water resistance, and the increasing demand in pitched roof applications.
Based on application, the market is divided into walls and pitched roofs. The most typical end-use for Breathable Membranes worldwide is pitched roofs. An increase in pitch roof architecture and timber frame building is driving the market for breathable membranes. This is primarily because pitched roofs provide many benefits, including maintaining thermal efficiency and shielding building materials from excess moisture. The demand for better air quality, increased investments in the repair and redevelopment of residential and commercial buildings, and greater attention to the creation of more energy-efficient building construction are also anticipated to support market expansion. Its outstanding qualities, such as resistance to constant UV rays and water, have increased demand in pitched roof applications, fueling the market's expansion.
[caption id="attachment_16204" align="aligncenter" width="1920"]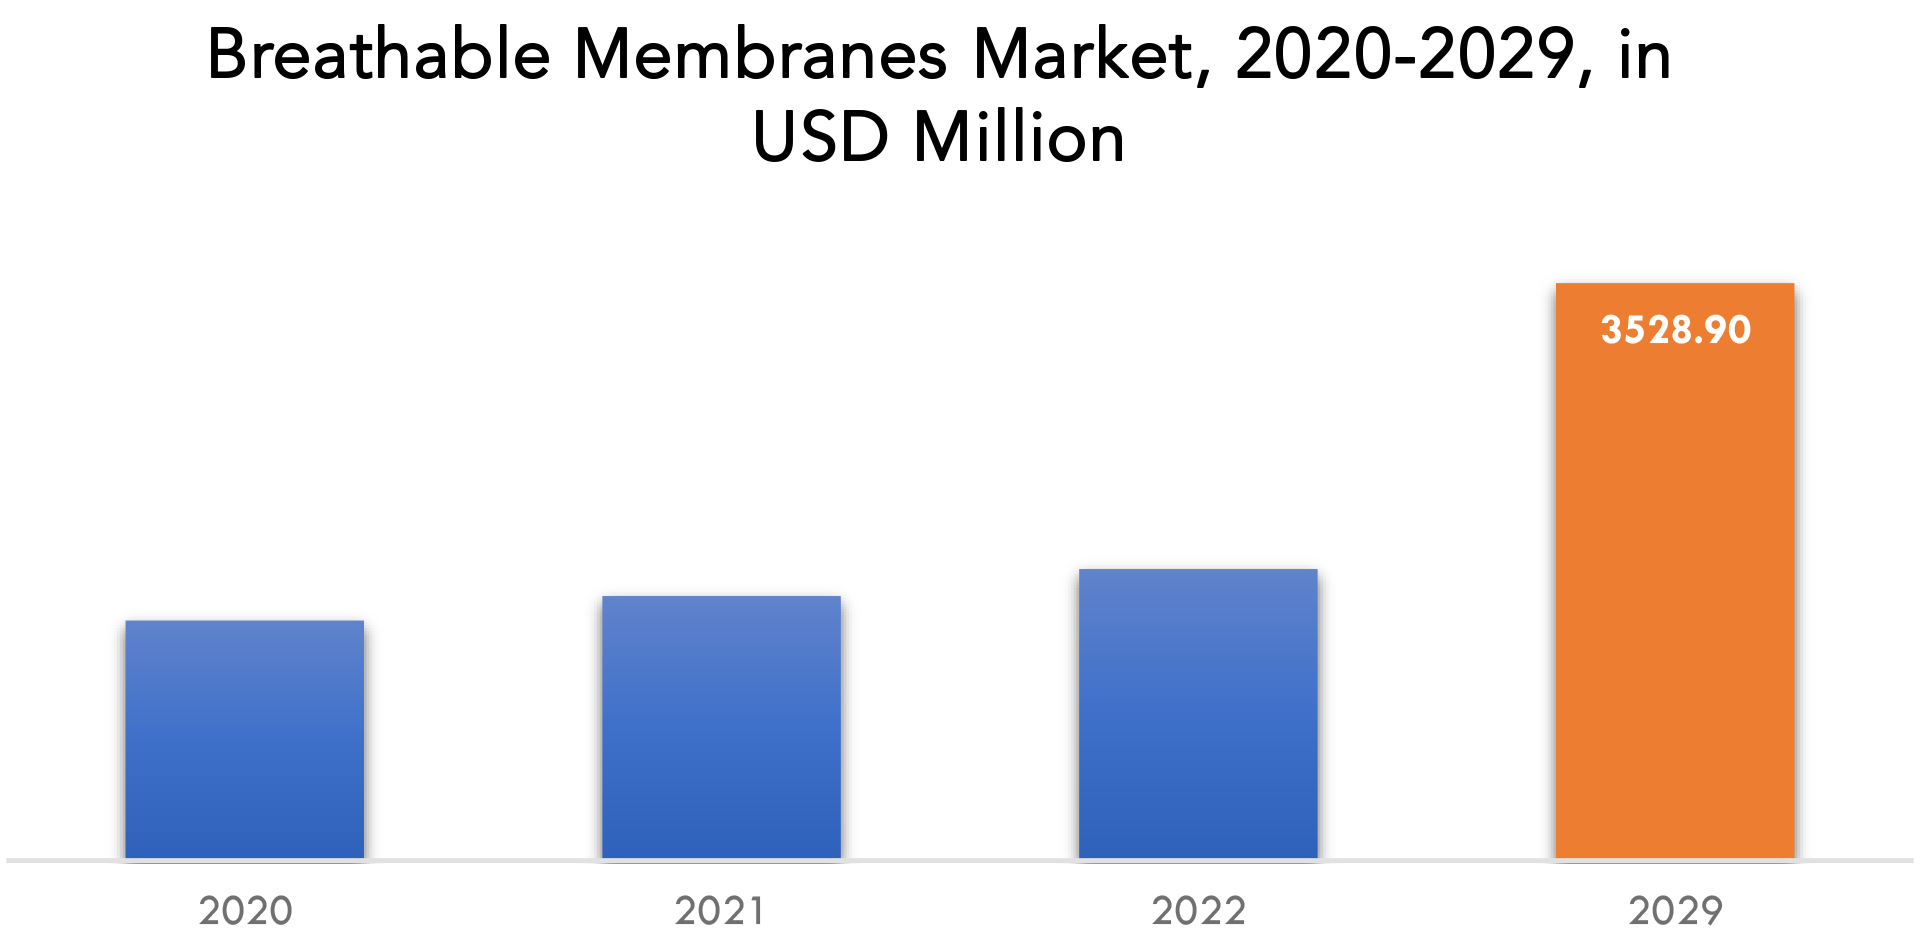
Breathable Membranes Market Players
The global breathable membranes companies profiled in the report include Cosella-Dorken, Dow, Inc., DuPont de Nemours Inc., GAF, IKO Industries Ltd., Kingspan Group PLC, Knauf Insulation, Low & Bonar PLC, Riwega S.R.L., Saint-Gobain SA, Soprema Group and others. Mergers and acquisitions, joint ventures, capacity expansion, significant distribution, and branding decisions by established industry players to improve market share and regional presence. They are also engaged in ongoing R&D activities to develop new products and are focused on expanding the product portfolio. This is expected to increase competition and pose a threat to new entrants into the market. Recent Development: October 12, 2022: The Knauf Group announced its plans to increase Mineral Wool production capacity within Central and Eastern Europe by investing near to €135 million in Knauf Insulation’s facility in Tarnaveni, Romania. July 5, 2023: Knauf Insulation signed a contract to acquire a Glass Mineral Wool plant in Central Romania.Who Should Buy? Or Key stakeholders
- Research and development
- Manufacturing
- Application
- Automotive industries
- Medical
- Transportation
- Government and Regional Agencies
- Investment Research Firms
Breathable Membranes Market Regional Analysis
Geographically, the breathable membranes market is segmented into North America, South America, Europe, APAC and MEA.
- North America: includes the US, Canada, Mexico
- Europe: includes UK, Germany, France, Italy, Spain, Russia, and Rest of Europe
- Asia Pacific: includes China, Japan, South Korea, India, Australia, ASEAN and Rest of APAC
- South America: includes Brazil, Argentina and Rest of South America
- Middle East & Africa: includes Turkey, UAE, Saudi Arabia, South Africa, and Rest of MEA
Western Europe is predicted to dominate the breathable membranes market in terms of volume, due to the rising demand for high quality membranes with superior long-term UV resistance and airtightness features. Population growth that is picking up speed and a rise in the need for breathable membranes in the timber frame construction sector will support market expansion.
Furthermore, significant value shares in the global market for breathable membranes for the building sector are also held by Eastern Europe and Japan. Due to the slow growth of the construction industry throughout the anticipated period, developing economies in the Middle East, Africa, and Latin America have a moderate growth rate in the global market for breathable membranes.
[caption id="attachment_16207" align="aligncenter" width="1920"]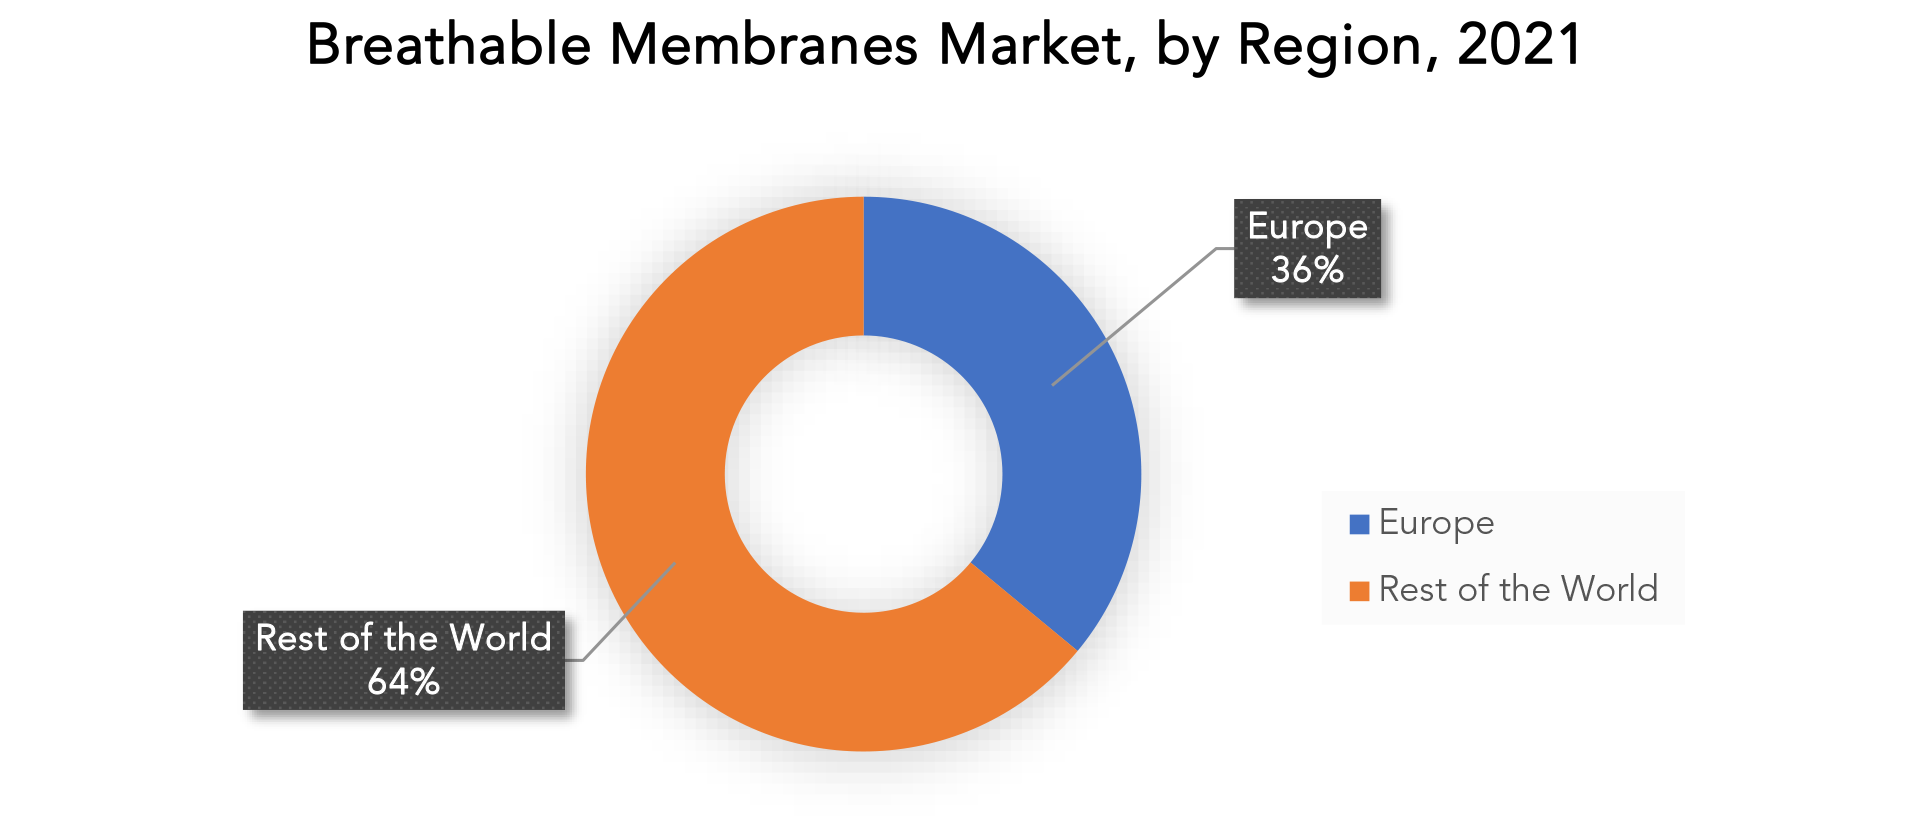
Key Market Segments: Breathable Membranes Market
Breathable Membranes Market By Type, 2020-2029, (Usd Million) (Million Square Meter)- Polyethylene (Pe)
- Polypropylene (Pp)
- Others
- Pitched Roof
- Walls
- North America
- Europe
- Asia Pacific
- South America
- Middle East And Africa
Exactitude Consultancy Services Key Objectives:
- Increasing sales and market share
- Developing new technology
- Improving profitability
- Entering new markets
- Enhancing brand reputation
Key Questions Answered
- What is the expected growth rate of the breathable membranes market over the next 7 years?
- Who are the major players in the breathable membranes market and what is their market share?
- What are the end-user industries driving demand for market and what is their outlook?
- What are the opportunities for growth in emerging markets such as Asia-pacific, Middle east, and Africa?
- How is the economic environment affecting the breathable membranes market, including factors such as interest rates, inflation, and exchange rates?
- What is the expected impact of government policies and regulations on the breathable membranes market?
- What is the current and forecasted size and growth rate of the global breathable membranes market?
- What are the key drivers of growth in the breathable membranes market?
- Who are the major players in the market and what is their market share?
- What are the distribution channels and supply chain dynamics in the breathable membranes market?
- What are the technological advancements and innovations in the breathable membranes market and their impact on product development and growth?
- What are the regulatory considerations and their impact on the market?
- What are the challenges faced by players in the breathable membranes market and how are they addressing these challenges?
- What are the opportunities for growth and expansion in the breathable membranes market?
- What are the product offerings and specifications of leading players in the market?
- INTRODUCTION
- MARKET DEFINITION
- MARKET SEGMENTATION
- RESEARCH TIMELINES
- ASSUMPTIONS AND LIMITATIONS
- RESEARCH METHODOLOGY
- DATA MINING
- SECONDARY RESEARCH
- PRIMARY RESEARCH
- SUBJECT-MATTER EXPERTS’ ADVICE
- QUALITY CHECKS
- FINAL REVIEW
- DATA TRIANGULATION
- BOTTOM-UP APPROACH
- TOP-DOWN APPROACH
- RESEARCH FLOW
- DATA SOURCES
- DATA MINING
- EXECUTIVE SUMMARY
- MARKET OVERVIEW
- GLOBAL BREATHABLE MEMBRANES MARKET OUTLOOK
- MARKET DRIVERS
- MARKET RESTRAINTS
- MARKET OPPORTUNITIES
- IMPACT OF COVID-19 ON BREATHABLE MEMBRANES MARKET
- PORTER’S FIVE FORCES MODEL
- THREAT FROM NEW ENTRANTS
- THREAT FROM SUBSTITUTES
- BARGAINING POWER OF SUPPLIERS
- BARGAINING POWER OF CUSTOMERS
- DEGREE OF COMPETITION
- INDUSTRY VALUE CHAIN ANALYSIS
- GLOBAL BREATHABLE MEMBRANES MARKET OUTLOOK
- GLOBAL BREATHABLE MEMBRANES MARKET BY TYPE, 2020-2029, (USD MILLION) (MILLION SQUARE METER)
- POLYETHYLENE (PE)
- POLYPROPYLENE (PP)
- OTHERS
- GLOBAL BREATHABLE MEMBRANES MARKET BY APPLICATION, 2020-2029, (USD MILLION) (MILLION SQUARE METER)
- PITCHED ROOF
- WALLS
- GLOBAL BREATHABLE MEMBRANES MARKET BY REGION, 2020-2029, (USD MILLION) (MILLION SQUARE METER)
- NORTH AMERICA
- US
- CANADA
- MEXICO
- SOUTH AMERICA
- BRAZIL
- ARGENTINA
- COLOMBIA
- REST OF SOUTH AMERICA
- EUROPE
- GERMANY
- UK
- FRANCE
- ITALY
- SPAIN
- RUSSIA
- REST OF EUROPE
- ASIA PACIFIC
- INDIA
- CHINA
- JAPAN
- SOUTH KOREA
- AUSTRALIA
- SOUTH-EAST ASIA
- REST OF ASIA PACIFIC
- MIDDLE EAST AND AFRICA
- UAE
- SAUDI ARABIA
- SOUTH AFRICA
- REST OF MIDDLE EAST AND AFRICA
- NORTH AMERICA
- COMPANY PROFILES* (BUSINESS OVERVIEW, COMPANY SNAPSHOT, PRODUCTS OFFERED, RECENT DEVELOPMENTS)
- COSELLA-DORKEN
- DOW, INC.
- DUPONT DE NEMOURS INC.
- GAF
- IKO INDUSTRIES LTD.
- KINGSPAN GROUP PLC
- KNAUF INSULATION
- LOW & BONAR PLC
- RIWEGA S.R.L.
- SAINT-GOBAIN SA
- SOPREMA GROUP *THE COMPANY LIST IS INDICATIVE
LIST OF TABLES
TABLE 1 GLOBAL BREATHABLE MEMBRANES MARKET BY TYPE (USD MILLION), 2020-2029
TABLE 2 GLOBAL BREATHABLE MEMBRANES MARKET BY TYPE (MILLION SQUARE METER), 2020-2029
TABLE 3 GLOBAL BREATHABLE MEMBRANES MARKET BY APPLICATION (USD MILLION), 2020-2029
TABLE 4 GLOBAL BREATHABLE MEMBRANES MARKET BY APPLICATION (MILLION SQUARE METER), 2020-2029
TABLE 5 NORTH AMERICA BREATHABLE MEMBRANES MARKET BY COUNTRY (USD MILLION), 2020-2029
TABLE 6 NORTH AMERICA BREATHABLE MEMBRANES MARKET BY COUNTRY (MILLION SQUARE METER), 2020-2029
TABLE 7 NORTH AMERICA BREATHABLE MEMBRANES MARKET BY TYPE (USD MILLION), 2020-2029
TABLE 8 NORTH AMERICA BREATHABLE MEMBRANES MARKET BY TYPE (MILLION SQUARE METER), 2020-2029
TABLE 9 NORTH AMERICA BREATHABLE MEMBRANES MARKET BY APPLICATION (USD MILLION), 2020-2029
TABLE 10 NORTH AMERICA BREATHABLE MEMBRANES MARKET BY APPLICATION (MILLION SQUARE METER), 2020-2029
TABLE 11 US BREATHABLE MEMBRANES MARKET BY TYPE (USD MILLION), 2020-2029
TABLE 12 US BREATHABLE MEMBRANES MARKET BY TYPE (MILLION SQUARE METER), 2020-2029
TABLE 13 US BREATHABLE MEMBRANES MARKET BY APPLICATION (USD MILLION), 2020-2029
TABLE 14 US BREATHABLE MEMBRANES MARKET BY APPLICATION (MILLION SQUARE METER), 2020-2029
TABLE 15 CANADA BREATHABLE MEMBRANES MARKET BY TYPE (MILLIONS), 2020-2029
TABLE 16 CANADA BREATHABLE MEMBRANES MARKET BY TYPE (MILLION SQUARE METER), 2020-2029
TABLE 17 CANADA BREATHABLE MEMBRANES MARKET BY APPLICATION (USD MILLION), 2020-2029
TABLE 18 CANADA BREATHABLE MEMBRANES MARKET BY APPLICATION (MILLION SQUARE METER), 2020-2029
TABLE 19 MEXICO BREATHABLE MEMBRANES MARKET BY TYPE (USD MILLION), 2020-2029
TABLE 20 MEXICO BREATHABLE MEMBRANES MARKET BY TYPE (MILLION SQUARE METER), 2020-2029
TABLE 21 MEXICO BREATHABLE MEMBRANES MARKET BY APPLICATION (USD MILLION), 2020-2029
TABLE 22 MEXICO BREATHABLE MEMBRANES MARKET BY APPLICATION (MILLION SQUARE METER), 2020-2029
TABLE 23 SOUTH AMERICA BREATHABLE MEMBRANES MARKET BY COUNTRY (USD MILLION), 2020-2029
TABLE 24 SOUTH AMERICA BREATHABLE MEMBRANES MARKET BY COUNTRY (MILLION SQUARE METER), 2020-2029
TABLE 25 SOUTH AMERICA BREATHABLE MEMBRANES MARKET BY TYPE (USD MILLION), 2020-2029
TABLE 26 SOUTH AMERICA BREATHABLE MEMBRANES MARKET BY TYPE (MILLION SQUARE METER), 2020-2029
TABLE 27 SOUTH AMERICA BREATHABLE MEMBRANES MARKET BY APPLICATION (USD MILLION), 2020-2029
TABLE 28 SOUTH AMERICA BREATHABLE MEMBRANES MARKET BY APPLICATION (MILLION SQUARE METER), 2020-2029
TABLE 29 BRAZIL BREATHABLE MEMBRANES MARKET BY TYPE (USD MILLION), 2020-2029
TABLE 30 BRAZIL BREATHABLE MEMBRANES MARKET BY TYPE (MILLION SQUARE METER), 2020-2029
TABLE 31 BRAZIL BREATHABLE MEMBRANES MARKET BY APPLICATION (USD MILLION), 2020-2029
TABLE 32 BRAZIL BREATHABLE MEMBRANES MARKET BY APPLICATION (MILLION SQUARE METER), 2020-2029
TABLE 33 ARGENTINA BREATHABLE MEMBRANES MARKET BY TYPE (USD MILLION), 2020-2029
TABLE 34 ARGENTINA BREATHABLE MEMBRANES MARKET BY TYPE (MILLION SQUARE METER), 2020-2029
TABLE 35 ARGENTINA BREATHABLE MEMBRANES MARKET BY APPLICATION (USD MILLION), 2020-2029
TABLE 36 ARGENTINA BREATHABLE MEMBRANES MARKET BY APPLICATION (MILLION SQUARE METER), 2020-2029
TABLE 37 COLOMBIA BREATHABLE MEMBRANES MARKET BY TYPE (USD MILLION), 2020-2029
TABLE 38 COLOMBIA BREATHABLE MEMBRANES MARKET BY TYPE (MILLION SQUARE METER), 2020-2029
TABLE 39 COLOMBIA BREATHABLE MEMBRANES MARKET BY APPLICATION (USD MILLION), 2020-2029
TABLE 40 COLOMBIA BREATHABLE MEMBRANES MARKET BY APPLICATION (MILLION SQUARE METER), 2020-2029
TABLE 41 REST OF SOUTH AMERICA BREATHABLE MEMBRANES MARKET BY TYPE (USD MILLION), 2020-2029
TABLE 42 REST OF SOUTH AMERICA BREATHABLE MEMBRANES MARKET BY TYPE (MILLION SQUARE METER), 2020-2029
TABLE 43 REST OF SOUTH AMERICA BREATHABLE MEMBRANES MARKET BY APPLICATION (USD MILLION), 2020-2029
TABLE 44 REST OF SOUTH AMERICA BREATHABLE MEMBRANES MARKET BY APPLICATION (MILLION SQUARE METER), 2020-2029
TABLE 45 ASIA-PACIFIC BREATHABLE MEMBRANES MARKET BY COUNTRY (USD MILLION), 2020-2029
TABLE 46 ASIA-PACIFIC BREATHABLE MEMBRANES MARKET BY COUNTRY (MILLION SQUARE METER), 2020-2029
TABLE 47 ASIA-PACIFIC BREATHABLE MEMBRANES MARKET BY TYPE (USD MILLION), 2020-2029
TABLE 48 ASIA-PACIFIC BREATHABLE MEMBRANES MARKET BY TYPE (MILLION SQUARE METER), 2020-2029
TABLE 49 ASIA-PACIFIC BREATHABLE MEMBRANES MARKET BY APPLICATION (USD MILLION), 2020-2029
TABLE 50 ASIA-PACIFIC BREATHABLE MEMBRANES MARKET BY APPLICATION (MILLION SQUARE METER), 2020-2029
TABLE 51 INDIA BREATHABLE MEMBRANES MARKET BY TYPE (USD MILLION), 2020-2029
TABLE 52 INDIA BREATHABLE MEMBRANES MARKET BY TYPE (MILLION SQUARE METER), 2020-2029
TABLE 53 INDIA BREATHABLE MEMBRANES MARKET BY APPLICATION (USD MILLION), 2020-2029
TABLE 54 INDIA BREATHABLE MEMBRANES MARKET BY APPLICATION (MILLION SQUARE METER), 2020-2029
TABLE 55 CHINA BREATHABLE MEMBRANES MARKET BY TYPE (USD MILLION), 2020-2029
TABLE 56 CHINA BREATHABLE MEMBRANES MARKET BY TYPE (MILLION SQUARE METER), 2020-2029
TABLE 57 CHINA BREATHABLE MEMBRANES MARKET BY APPLICATION (USD MILLION), 2020-2029
TABLE 58 CHINA BREATHABLE MEMBRANES MARKET BY APPLICATION (MILLION SQUARE METER), 2020-2029
TABLE 59 JAPAN BREATHABLE MEMBRANES MARKET BY TYPE (USD MILLION), 2020-2029
TABLE 60 JAPAN BREATHABLE MEMBRANES MARKET BY TYPE (MILLION SQUARE METER), 2020-2029
TABLE 61 JAPAN BREATHABLE MEMBRANES MARKET BY APPLICATION (USD MILLION), 2020-2029
TABLE 62 JAPAN BREATHABLE MEMBRANES MARKET BY APPLICATION (MILLION SQUARE METER), 2020-2029
TABLE 63 SOUTH KOREA BREATHABLE MEMBRANES MARKET BY TYPE (USD MILLION), 2020-2029
TABLE 64 SOUTH KOREA BREATHABLE MEMBRANES MARKET BY TYPE (MILLION SQUARE METER), 2020-2029
TABLE 65 SOUTH KOREA BREATHABLE MEMBRANES MARKET BY APPLICATION (USD MILLION), 2020-2029
TABLE 66 SOUTH KOREA BREATHABLE MEMBRANES MARKET BY APPLICATION (MILLION SQUARE METER), 2020-2029
TABLE 67 AUSTRALIA BREATHABLE MEMBRANES MARKET BY TYPE (USD MILLION), 2020-2029
TABLE 68 AUSTRALIA BREATHABLE MEMBRANES MARKET BY TYPE (MILLION SQUARE METER), 2020-2029
TABLE 69 AUSTRALIA BREATHABLE MEMBRANES MARKET BY APPLICATION (USD MILLION), 2020-2029
TABLE 70 AUSTRALIA BREATHABLE MEMBRANES MARKET BY APPLICATION (MILLION SQUARE METER), 2020-2029
TABLE 71 SOUTH EAST ASIA BREATHABLE MEMBRANES MARKET BY TYPE (USD MILLION), 2020-2029
TABLE 72 SOUTH EAST ASIA BREATHABLE MEMBRANES MARKET BY TYPE (MILLION SQUARE METER), 2020-2029
TABLE 73 SOUTH EAST ASIA BREATHABLE MEMBRANES MARKET BY APPLICATION (USD MILLION), 2020-2029
TABLE 74 SOUTH EAST ASIA BREATHABLE MEMBRANES MARKET BY APPLICATION (MILLION SQUARE METER), 2020-2029
TABLE 75 REST OF ASIA PACIFIC BREATHABLE MEMBRANES MARKET BY TYPE (USD MILLION), 2020-2029
TABLE 76 REST OF ASIA PACIFIC BREATHABLE MEMBRANES MARKET BY TYPE (MILLION SQUARE METER), 2020-2029
TABLE 77 REST OF ASIA PACIFIC BREATHABLE MEMBRANES MARKET BY APPLICATION (USD MILLION), 2020-2029
TABLE 78 REST OF ASIA PACIFIC BREATHABLE MEMBRANES MARKET BY APPLICATION (MILLION SQUARE METER), 2020-2029
TABLE 79 EUROPE BREATHABLE MEMBRANES MARKET BY COUNTRY (USD MILLION), 2020-2029
TABLE 80 EUROPE BREATHABLE MEMBRANES MARKET BY COUNTRY (MILLION SQUARE METER), 2020-2029
TABLE 81 EUROPE BREATHABLE MEMBRANES MARKET BY TYPE (USD MILLION), 2020-2029
TABLE 82 EUROPE BREATHABLE MEMBRANES MARKET BY TYPE (MILLION SQUARE METER), 2020-2029
TABLE 83 EUROPE BREATHABLE MEMBRANES MARKET BY APPLICATION (USD MILLION), 2020-2029
TABLE 84 EUROPE BREATHABLE MEMBRANES MARKET BY APPLICATION (MILLION SQUARE METER), 2020-2029
TABLE 85 GERMANY BREATHABLE MEMBRANES MARKET BY TYPE (USD MILLION), 2020-2029
TABLE 86 GERMANY BREATHABLE MEMBRANES MARKET BY TYPE (MILLION SQUARE METER), 2020-2029
TABLE 87 GERMANY BREATHABLE MEMBRANES MARKET BY APPLICATION (USD MILLION), 2020-2029
TABLE 88 GERMANY BREATHABLE MEMBRANES MARKET BY APPLICATION (MILLION SQUARE METER), 2020-2029
TABLE 89 UK BREATHABLE MEMBRANES MARKET BY TYPE (USD MILLION), 2020-2029
TABLE 90 UK BREATHABLE MEMBRANES MARKET BY TYPE (MILLION SQUARE METER), 2020-2029
TABLE 91 UK BREATHABLE MEMBRANES MARKET BY APPLICATION (USD MILLION), 2020-2029
TABLE 92 UK BREATHABLE MEMBRANES MARKET BY APPLICATION (MILLION SQUARE METER), 2020-2029
TABLE 93 FRANCE BREATHABLE MEMBRANES MARKET BY TYPE (USD MILLION), 2020-2029
TABLE 94 FRANCE BREATHABLE MEMBRANES MARKET BY TYPE (MILLION SQUARE METER), 2020-2029
TABLE 95 FRANCE BREATHABLE MEMBRANES MARKET BY APPLICATION (USD MILLION), 2020-2029
TABLE 96 FRANCE BREATHABLE MEMBRANES MARKET BY APPLICATION (MILLION SQUARE METER), 2020-2029
TABLE 97 ITALY BREATHABLE MEMBRANES MARKET BY TYPE (USD MILLION), 2020-2029
TABLE 98 ITALY BREATHABLE MEMBRANES MARKET BY TYPE (MILLION SQUARE METER), 2020-2029
TABLE 99 ITALY BREATHABLE MEMBRANES MARKET BY APPLICATION (USD MILLION), 2020-2029
TABLE 100 ITALY BREATHABLE MEMBRANES MARKET BY APPLICATION (MILLION SQUARE METER), 2020-2029
TABLE 101 SPAIN BREATHABLE MEMBRANES MARKET BY TYPE (USD MILLION), 2020-2029
TABLE 102 SPAIN BREATHABLE MEMBRANES MARKET BY TYPE (MILLION SQUARE METER), 2020-2029
TABLE 103 SPAIN BREATHABLE MEMBRANES MARKET BY APPLICATION (USD MILLION), 2020-2029
TABLE 104 SPAIN BREATHABLE MEMBRANES MARKET BY APPLICATION (MILLION SQUARE METER), 2020-2029
TABLE 105 RUSSIA BREATHABLE MEMBRANES MARKET BY TYPE (USD MILLION), 2020-2029
TABLE 106 RUSSIA BREATHABLE MEMBRANES MARKET BY TYPE (MILLION SQUARE METER), 2020-2029
TABLE 107 RUSSIA BREATHABLE MEMBRANES MARKET BY APPLICATION (USD MILLION), 2020-2029
TABLE 108 RUSSIA BREATHABLE MEMBRANES MARKET BY APPLICATION (MILLION SQUARE METER), 2020-2029
TABLE 109 REST OF EUROPE BREATHABLE MEMBRANES MARKET BY TYPE (USD MILLION), 2020-2029
TABLE 110 REST OF EUROPE BREATHABLE MEMBRANES MARKET BY TYPE (MILLION SQUARE METER), 2020-2029
TABLE 111 REST OF EUROPE BREATHABLE MEMBRANES MARKET BY APPLICATION (USD MILLION), 2020-2029
TABLE 112 REST OF EUROPE BREATHABLE MEMBRANES MARKET BY APPLICATION (MILLION SQUARE METER), 2020-2029
TABLE 113 MIDDLE EAST AND AFRICA BREATHABLE MEMBRANES MARKET BY COUNTRY (USD MILLION), 2020-2029
TABLE 114 MIDDLE EAST AND AFRICA BREATHABLE MEMBRANES MARKET BY COUNTRY (MILLION SQUARE METER), 2020-2029
TABLE 115 MIDDLE EAST AND AFRICA BREATHABLE MEMBRANES MARKET BY TYPE (USD MILLION), 2020-2029
TABLE 116 MIDDLE EAST AND AFRICA BREATHABLE MEMBRANES MARKET BY TYPE (MILLION SQUARE METER), 2020-2029
TABLE 117 MIDDLE EAST AND AFRICA BREATHABLE MEMBRANES MARKET BY APPLICATION (USD MILLION), 2020-2029
TABLE 118 MIDDLE EAST AND AFRICA BREATHABLE MEMBRANES MARKET BY APPLICATION (MILLION SQUARE METER), 2020-2029
TABLE 119 UAE BREATHABLE MEMBRANES MARKET BY TYPE (USD MILLION), 2020-2029
TABLE 120 UAE BREATHABLE MEMBRANES MARKET BY TYPE (MILLION SQUARE METER), 2020-2029
TABLE 121 UAE BREATHABLE MEMBRANES MARKET BY APPLICATION (USD MILLION), 2020-2029
TABLE 122 UAE BREATHABLE MEMBRANES MARKET BY APPLICATION (MILLION SQUARE METER), 2020-2029
TABLE 123 SAUDI ARABIA BREATHABLE MEMBRANES MARKET BY TYPE (USD MILLION), 2020-2029
TABLE 124 SAUDI ARABIA BREATHABLE MEMBRANES MARKET BY TYPE, 2020-2029
TABLE 125 SAUDI ARABIA BREATHABLE MEMBRANES MARKET BY APPLICATION (USD MILLION), 2020-2029
TABLE 126 SAUDI ARABIA BREATHABLE MEMBRANES MARKET BY APPLICATION (MILLION SQUARE METER), 2020-2029
TABLE 127 SOUTH AFRICA BREATHABLE MEMBRANES MARKET BY TYPE (USD MILLION), 2020-2029
TABLE 128 SOUTH AFRICA BREATHABLE MEMBRANES MARKET BY TYPE (MILLION SQUARE METER), 2020-2029
TABLE 129 SOUTH AFRICA BREATHABLE MEMBRANES MARKET BY APPLICATION (USD MILLION), 2020-2029
TABLE 130 SOUTH AFRICA BREATHABLE MEMBRANES MARKET BY APPLICATION (MILLION SQUARE METER), 2020-2029
TABLE 131 REST OF MIDDLE EAST AND AFRICA BREATHABLE MEMBRANES MARKET BY TYPE (USD MILLION), 2020-2029
TABLE 132 REST OF MIDDLE EAST AND AFRICA BREATHABLE MEMBRANES MARKET BY TYPE (MILLION SQUARE METER), 2020-2029
TABLE 133 REST OF MIDDLE EAST AND AFRICA BREATHABLE MEMBRANES MARKET BY APPLICATION (USD MILLION), 2020-2029
TABLE 134 REST OF MIDDLE EAST AND AFRICA BREATHABLE MEMBRANES MARKET BY APPLICATION (MILLION SQUARE METER), 2020-2029
LIST OF FIGURES
FIGURE 1 MARKET DYNAMICS
FIGURE 2 MARKET SEGMENTATION
FIGURE 3 REPORT TIMELINES: YEARS CONSIDERED
FIGURE 4 DATA TRIANGULATION
FIGURE 5 BOTTOM-UP APPROACH
FIGURE 6 TOP-DOWN APPROACH
FIGURE 7 RESEARCH FLOW
FIGURE 8 GLOBAL BREATHABLE MEMBRANES MARKET BY TYPE, USD MILLION, 2020-2029
FIGURE 9 GLOBAL BREATHABLE MEMBRANES MARKET BY APPLICATION, USD MILLION, 2020-2029
FIGURE 10 GLOBAL BREATHABLE MEMBRANES MARKET BY REGION, USD MILLION, 2020-2029
FIGURE 11 PORTER’S FIVE FORCES MODEL
FIGURE 12 GLOBAL BREATHABLE MEMBRANES MARKET BY TYPE, USD MILLION, 2021
FIGURE 13 GLOBAL BREATHABLE MEMBRANES MARKET BY APPLICATION, USD MILLION, 2021
FIGURE 14 GLOBAL BREATHABLE MEMBRANES MARKET BY REGION, USD MILLION, 2021
FIGURE 15 MARKET SHARE ANALYSIS
FIGURE 16 COSELLA-DORKEN: COMPANY SNAPSHOT
FIGURE 17 DOW, INC.: COMPANY SNAPSHOT
FIGURE 18 DUPONT DE NEMOURS INC.: COMPANY SNAPSHOT
FIGURE 19 GAF: COMPANY SNAPSHOT
FIGURE 20 IKO INDUSTRIES LTD.: COMPANY SNAPSHOT
FIGURE 21 KINGSPAN GROUP PLC: COMPANY SNAPSHOT
FIGURE 22 KNAUF INSULATION: COMPANY SNAPSHOT
FIGURE 23 LOW & BONAR PLC: COMPANY SNAPSHOT
FIGURE 24 RIWEGA S.R.L.: COMPANY SNAPSHOT
FIGURE 25 SAINT-GOBAIN SA: COMPANY SNAPSHOT
FIGURE 26 SOPREMA GROUP: COMPANY SNAPSHOT
DOWNLOAD FREE SAMPLE REPORT
License Type
SPEAK WITH OUR ANALYST
Want to know more about the report or any specific requirement?
WANT TO CUSTOMIZE THE REPORT?
Our Clients Speak
We asked them to research ‘ Equipment market’ all over the world, and their whole arrangement was helpful to us. thehealthanalytics.com insightful analysis and reports contributed to our current analysis and in creating a future strategy. Besides, the te
Yosuke Mitsui
Senior Associate Construction Equipment Sales & Marketing
We asked them to research ‘Equipment market’ all over the world, and their whole arrangement was helpful to us. thehealthanalytics.com insightful analysis and reports contributed to our current analysis and in creating a future strategy. Besides, the te


