

Base Year Value ()
x.x %
x.x %
CAGR ()
x.x %
x.x %
Forecast Year Value ()
x.x %
x.x %
Historical Data Period
Largest Region
Forecast Period
GFRP Composites Market by Resin Type (Thermoplastic, Polyurethane, Polyester, Epoxy, Vinyl Ester, Others), Manufacturing Process (Injection Molding, Filaments, Compression Molding, RTM & VARTM, Layup, Others), End User (Transportation, Renewable Energy, Electric & Electronics, Military & Defense, Telecommunication, Building & Construction, Others) and Region, Global trends and forecast from 2023 to 2029
Instant access to hundreds of data points and trends
- Market estimates from 2014-2029
- Competitive analysis, industry segmentation, financial benchmarks
- Incorporates SWOT, Porter's Five Forces and risk management frameworks
- PDF report or online database with Word, Excel and PowerPoint export options
- 100% money back guarantee
GFRP Composites Overview
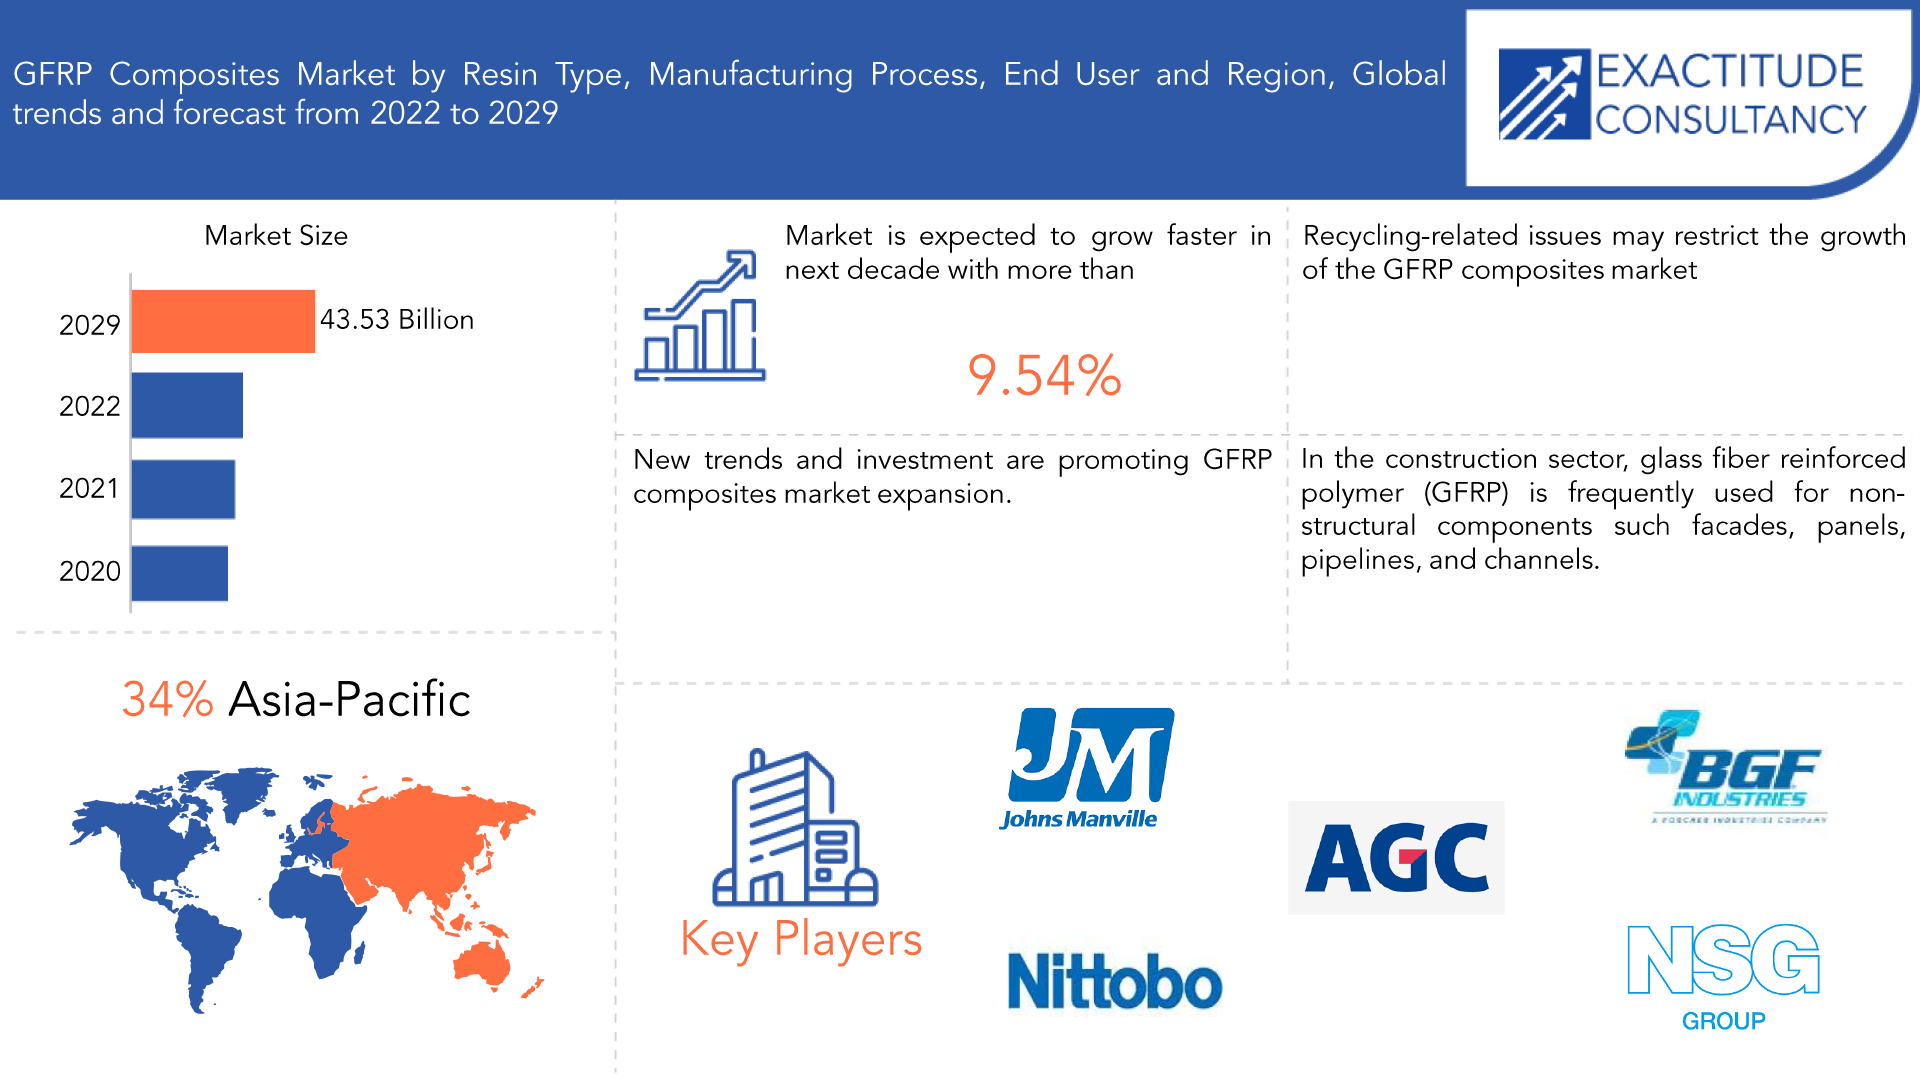
The GFRP composites market is expected to grow at 9.54% CAGR from 2023 to 2029. It is expected to reach above USD 43.53 billion by 2029 from USD 14.47 billion in 2022.
Made from extremely fine glass fibers, glass fiber is a strong, lightweight material. Glass fibers have higher strength, greater thermal efficiency, and less brittleness than carbon fibers. Composite materials that are lighter, less expensive, and stronger are anticipated to be used by major players in the automotive, construction & infrastructure, and aerospace & defense industries. Increasing demand from the automotive industry since it improves fuel efficiency in automobiles because of lower weight. The engineering materials often use glass fiber-reinforced plastic (GFRP) composites because of their great mechanical strength and low weight. They occasionally need to be machined into the proper shape before being used in industrial settings.
Fiberglass is more easily moldable and less brittle than metals and offers the necessary strength without the weight or cost of metals. Many fiberglass products are constructed using the hand lay-up, spray lay-up, pultrusion, and chopped strand mat techniques. The largest market is construction, but fiberglass is used in a wide range of products, from the most basic (pipes, tanks, electrical, etc.) to the most specialized. These industries include automotive, wind energy, defense, aerospace, transportation, marine, electronics, consumer goods, and transportation. Fiberglass's versatility in texture, resistance to the weather, strength, and light weight are factors in the sectors indicated above's rising demand for it. There has also been a change in businesses' priorities as they look into new applications for fiberglass. In addition to infrastructure, growing economies and the need for sustainable energy create new market opportunities. A demand-supply gap that needs to be addressed with alternatives has also been caused by market expansion in recent years. To penetrate into saturated markets and expand into new ones, innovative manufacturing techniques and fresh product development are favored.
| ATTRIBUTE | DETAILS |
| Study period | 2020-2029 |
| Base year | 2021 |
| Estimated year | 2022 |
| Forecasted year | 2022-2029 |
| Historical period | 2018-2020 |
| Unit | Value (USD Billion), (Kilotons) |
| Segmentation | By Resin Type, Manufacturing Process, End User, and Region |
| By Resin Type
|
|
| By Manufacturing Process
|
|
| By End User
|
|
| By Region
|
|
The market for Glass Fiber Reinforced Plastic (GFRP) Composites is primarily driven by the material's high strength-to-weight ratio, low density, resistance to corrosion, and qualities that insulate against heat and electricity. GFRP composites also have a high specific stiffness and can sustain significant deformation without breaking. These characteristics make GFRP composites the perfect material for use in a range of industries, including construction, automotive, and aerospace.
One of the key factors anticipated to propel the expansion of the global market over the next few years is the rising demand for glass fiber reinforced plastic composites across a variety of end-use sectors, including transportation and aerospace & defense.
Other significant factors that are anticipated to support revenue growth of the global market over the following few years include increasing technological developments in the electrical and electronics industries and rising demand from the construction industries for glass fiber reinforced plastic composites.
The use of glass fiber reinforced plastic composites is likely to rise due to a number of advantages offered by these materials, including durability, flexibility, high tensile strength, and others. This is expected to fuel the target market's expansion over the forecast period.
However, a significant factor that is anticipated to majorly restrain the expansion of the global market is high processing and manufacturing costs.
[caption id="attachment_16434" align="aligncenter" width="1920"]
Frequently Asked Questions
● What is the worth of GFRP composites market?
The GFRP composites market is expected to grow at 9.54% CAGR from 2022 to 2029. It is expected to reach above USD 43.53 billion by 2029 from USD 14.47 billion in 2020.
● What is the size of the Asia Pacific GFRP composites market industry?
Asia Pacific held more than 34% of the GFRP composites market revenue share in 2020 and will witness expansion in the forecast period.
● What are the main driving forces behind the GFRP composites market's expansion?
The market is being driven by the aerospace industry's growing need for lightweight materials that are still strong, flexible, and able to handle impacts and large loads. Increasing research and development for technical improvements in the automotive sector to make the vehicle lighter and more impact resistant is also predicted to accelerate market expansion.
● Which are the top companies to hold the market share in GFRP composites market?
The top companies to hold the market share in GFRP composites market are Johns Manville, BGF Industries, Asahi Glass Company Limited, Advanced Glassfiber Yarns LLC, Chomarat Group, Jushi Group Co. Ltd, Taishan Fiberglass Inc, Owens Corning, PPG Industries Inc, Binani 3B-The Fibreglass Company, Saertex Group, Chongqing Polycomp International Corp, Saint-Gobain Vetrotex, Nitto Boseki Co. Ltd, Nippon Sheet Glass Co. Ltd., and others.
• Which is the largest regional market for GFRP composites market?
Asia Pacific is the largest regional market for GFRP composites market.
GFRP Composites Segment Analysis
According to resin type, the polyester segment is anticipated to expand at a rapid CAGR throughout the projection period. This is because they are frequently utilized as a matrix for glass fiber reinforced plastic composites in a variety of applications, including automobiles, aeroplanes, electronics components, railroads, and other structures due to their excellent performance and corrosion resistance. Epoxy and polyurethane come after polyester.
The compression molding process, which secured a sizable share over the forecast period, dominates the global market in terms of manufacturing. The need for compression molding is driven by rising low labor costs, production methods, low scarp rates, and fast cycle times. Major manufacturers in the electric, automation, and electronic sectors are expanding their use of the compressive molding process. Yet, a number of items, such as electrical panels, electronic devices, auto bumpers, and medical equipment, expand the use of the compression molding process.
According to end-use industry, the transportation sector is dominating the global market by snatching up the largest share over the course of the forecast. The key elements driving the market expansion are the rising demand for fuel efficiency, cheap cost, and expanding use of glass fiber reinforced plastic (GFRP) composites. Moreover, the expansion of the automobile and railway industries significantly increases demand for transportation. The market is growing due to improved fuel efficiency and the availability of lightweight machinery tools. Also, the high demand for transportation is growing as a result of the GFRP composites components found in items like seats, windows, luggage bins, roof panels, and others.
[caption id="attachment_16438" align="aligncenter" width="1920"]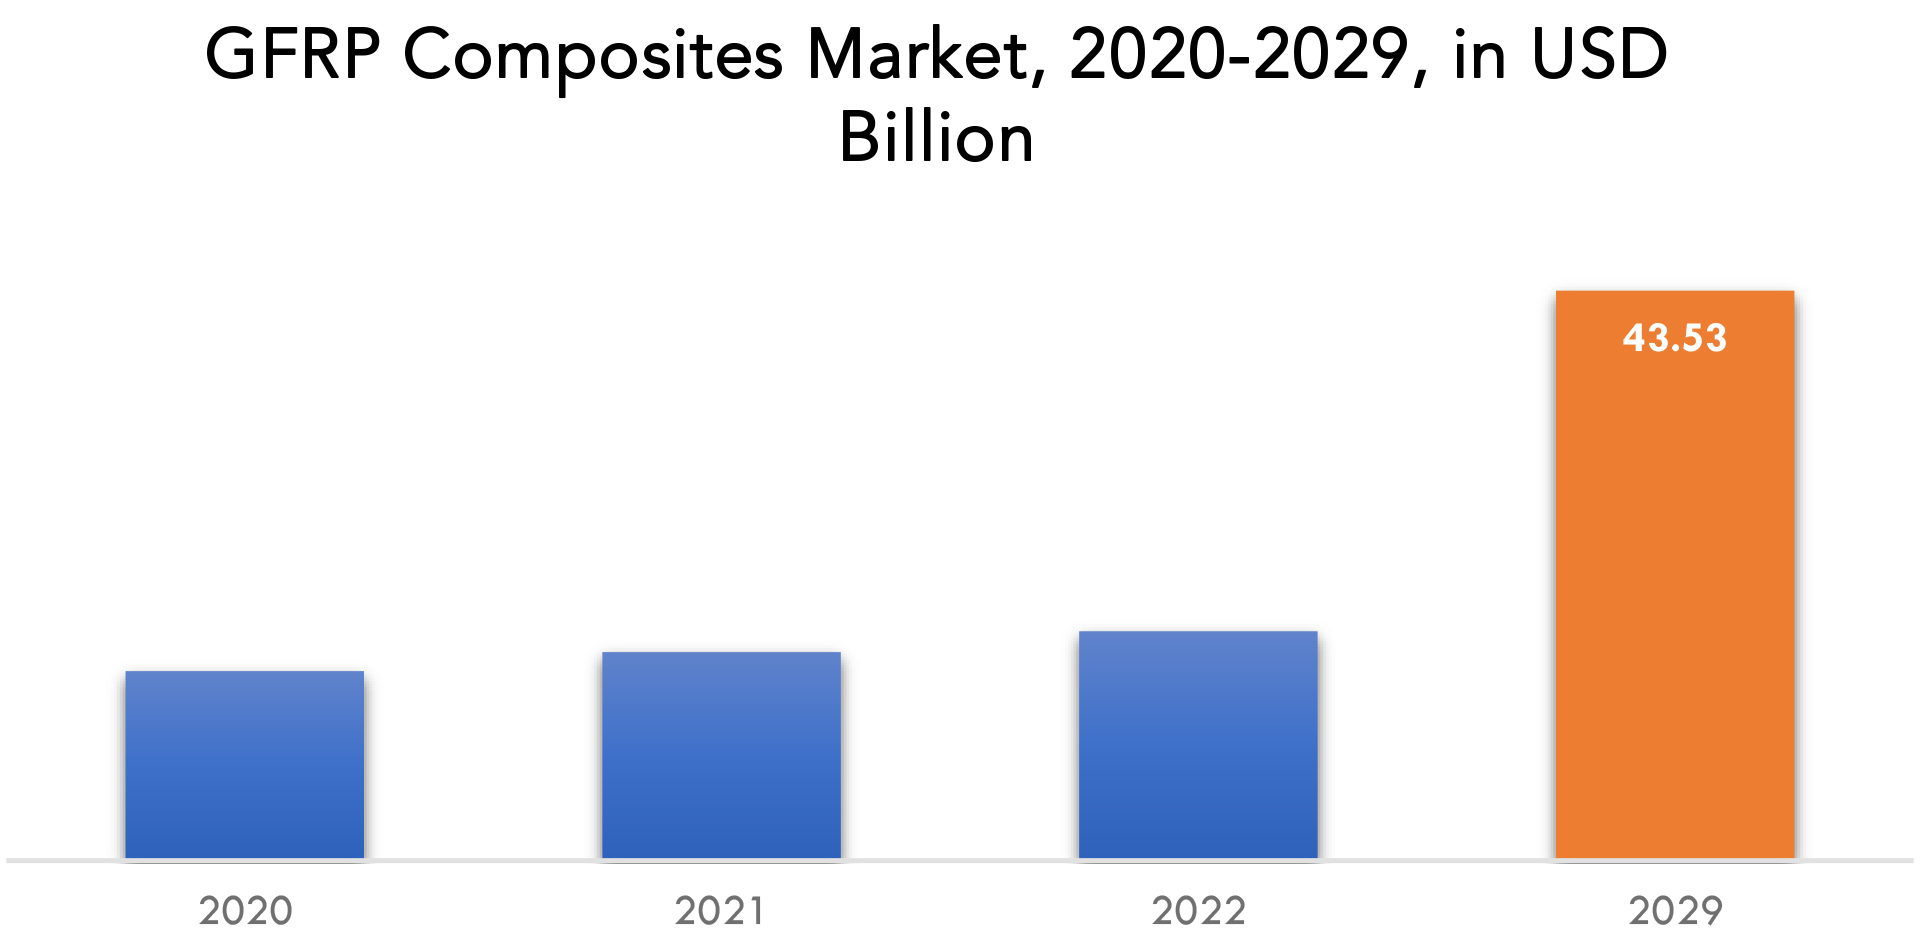
GFRP Composites Market Players
The GFRP composites market key players include Johns Manville, BGF Industries, Asahi Glass Company Limited, Advanced Glassfiber Yarns LLC, Chomarat Group, Jushi Group Co. Ltd, Taishan Fiberglass Inc, Owens Corning, PPG Industries Inc, Binani 3B-The Fibreglass Company, Saertex Group, Chongqing Polycomp International Corp, Saint-Gobain Vetrotex, Nitto Boseki Co. Ltd, Nippon Sheet Glass Co. Ltd., and others.
The purchase of a 100% stake in Shield Autoglass received approval from Asahi India Glass Ltd in May 2022.
With an investment of more than INR 500 Cr., Saint Gobain began operating manufacturing facilities for float glass, integrated windows lines, and SIPCOT-Urban Forest in March 2022.
Who Should Buy? Or Key Stakeholders
- GFRP composites market Suppliers
- Chemical Industry
- Distributors of GFRP composites
- Research Organizations
- Investors
- Regulatory Authorities
- Others
GFRP Composites Regional Analysis
The GFRP composites market by region includes North America, Asia-Pacific (APAC), Europe, South America, and Middle East & Africa (MEA).
- North America: includes the US, Canada, Mexico
- Asia Pacific: includes China, Japan, South Korea, India, Australia, ASEAN and Rest of APAC
- Europe: includes UK, Germany, France, Italy, Spain, Russia, and Rest of Europe
- South America: includes Brazil, Argentina and Rest of South America
- Middle East & Africa: includes Turkey, UAE, Saudi Arabia, South Africa, and Rest of MEA
Asia Pacific dominates the global market for GFRP composites with North America in close competition. China is the largest producer and supplier among the developing economies and the largest consumer of products made of fiberglass. The largest producer and consumer of fiberglass is the United States. Europe's top producer is Germany, which is followed by the UK, Spain, Italy, and France. The developing countries of Brazil and India have also been showcasing their potential for progress. The glass fiber and glass fiber fortified plastic composites market in the Middle East and Africa will be driven by development areas. European nations and the USA are driving innovative work activities for the production of high quality and execution things.
[caption id="attachment_16439" align="aligncenter" width="1920"]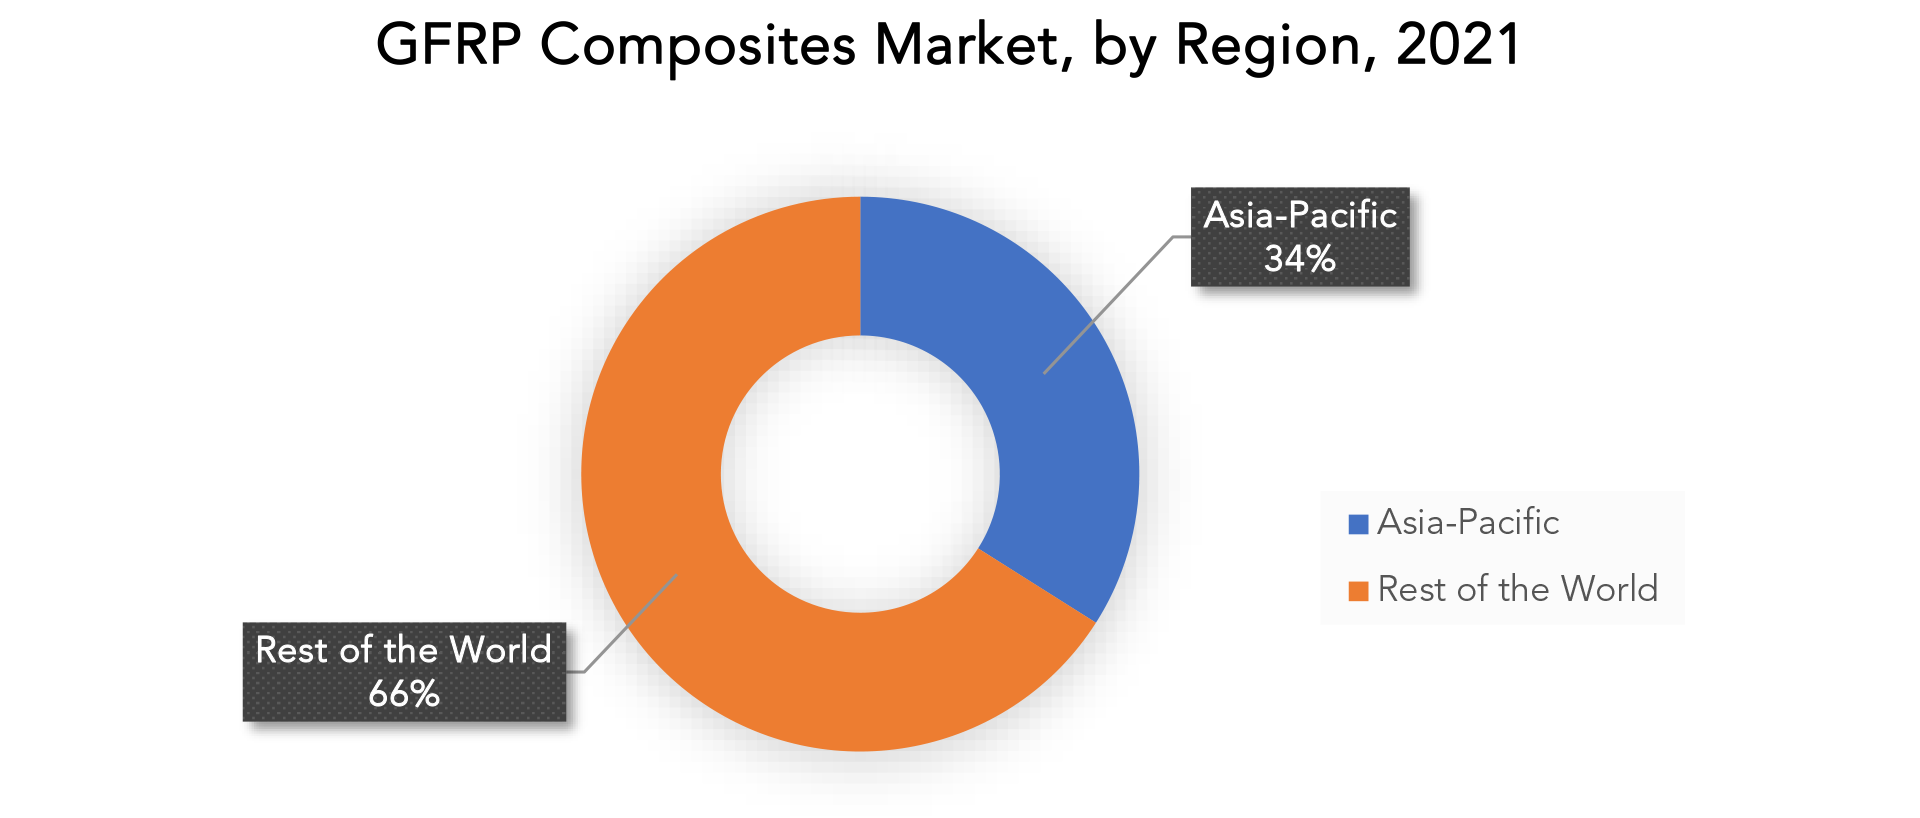
Key Market Segments: GFRP Composites Market
GFRP Composites Market By Resin Type, 2020-2029, (USD Billion), (Kilotons)- Thermoplastic
- Polyurethane
- Polyester
- Epoxy
- Vinyl Ester
- Others
- Injection Molding
- Filaments
- Compression Molding
- RTM & VARTM
- Layup
- Others
- Transportation
- Renewable Energy
- Electric & Electronics
- Military & Defense
- Telecommunication
- Building & Construction
- Others
- North America
- Europe
- Asia Pacific
- South America
- Middle East And Africa
Exactitude Consultancy Services Key Objectives:
- Increasing sales and market share
- Developing new technology
- Improving profitability
- Entering new markets
- Enhancing brand reputation
Key Questions Answered:
- What is the expected growth rate of the GFRP composites market over the next 7 years?
- Who are the major players in the GFRP composites market and what is their market share?
- What are the end-user industries driving demand for market and what is their outlook?
- What are the opportunities for growth in emerging markets such as Asia-Pacific, Middle East, and Africa?
- How is the economic environment affecting the GFRP composites market, including factors such as interest rates, inflation, and exchange rates?
- What is the expected impact of government policies and regulations on the GFRP composites market?
- What is the current and forecasted size and growth rate of the global GFRP composites market?
- What are the key drivers of growth in the GFRP composites market?
- Who are the major players in the market and what is their market share?
- What are the distribution channels and supply chain dynamics in the GFRP composites market?
- What are the technological advancements and innovations in the GFRP composites market and their impact on product development and growth?
- What are the regulatory considerations and their impact on the market?
- What are the challenges faced by players in the GFRP composites market and how are they addressing these challenges?
- What are the opportunities for growth and expansion in the GFRP composites market?
- What are the product offerings and specifications of leading players in the market?
- What is the pricing trend of GFRP composites in the market and what is the impact of raw material prices on the price trend?
- Introduction
- Market Definition
- Market Segmentation
- Research Timelines
- Assumptions and Limitations
- Research Methodology
- Data Mining
- Secondary Research
- Primary Research
- Subject-Matter Experts’ Advice
- Quality Checks
- Final Review
- Data Triangulation
- Bottom-Up Approach
- Top-Down Approach
- Research Flow
- Data Sources
- Data Mining
- Executive Summary
- Market Overview
- Global GFRP Composites Market Outlook
- Market Drivers
- Market Restraints
- Market Opportunities
- Impact of Covid-19 On GFRP Composites Market
- Porter’s five forces model
- Threat from new entrants
- Threat from substitutes
- Bargaining power of suppliers
- Bargaining power of customers
- Degree of competition
- Industry value chain Analysis
- Global GFRP Composites Market Outlook
- Global GFRP Composites Market by Resin Type, 2022-2029, (USD BILLION), (KILOTONS)
- Thermoplastic
- Polyurethane
- Polyester
- Epoxy
- Vinyl Ester
- Others
- Global GFRP Composites Market by Manufacturing Process, 2022-2029, (USD BILLION), (KILOTONS)
- Injection Molding
- Filaments
- Compression Molding
- RTM & VARTM
- Layup
- Others
- Global GFRP Composites Market by End User, 2022-2029, (USD BILLION), (KILOTONS)
- Transportation
- Renewable Energy
- Electric & Electronics
- Military & Defence
- Telecommunication
- Building & Construction
- Others
- Global GFRP Composites Market by Region, 2022-2029, (USD BILLION), (KILOTONS)
- North America
- US
- Canada
- Mexico
- South America
- Brazil
- Argentina
- Colombia
- Rest Of South America
- Europe
- Germany
- UK
- France
- Italy
- Spain
- Russia
- Rest Of Europe
- Asia Pacific
- India
- China
- Japan
- South Korea
- Australia
- South-East Asia
- Rest Of Asia Pacific
- Middle East and Africa
- UAE
- Saudi Arabia
- South Africa
- Rest Of Middle East and Africa
- North America
- Company Profiles*
(Business Overview, Company Snapshot, Products Offered, Recent Developments)
- Johns Manville,
- BGF Industries
- Asahi Glass Company Limited
- Advanced Glassfiber Yarns LLC
- Chomarat Group
- Jushi Group Co. Ltd
- Taishan Fiberglass Inc
- Owens Corning, PPG Industries Inc
- Binani 3B-The Fibreglass Company
- Saertex Group
- Chongqing Polycomp International Corp
- Saint-Gobain Vetrotex
- Nitto Boseki Co. Ltd
- Nippon Sheet Glass Co. Ltd
*The Company List Is Indicative
LIST OF TABLES
TABLE 1 GLOBAL GFRP COMPOSITES MARKET BY RESIN TYPE (KILOTONS) 2022-2029
TABLE 2 GLOBAL GFRP COMPOSITES MARKET BY RESIN TYPE (USD BILLION) 2022-2029
TABLE 3 GLOBAL GFRP COMPOSITES MARKET BY MANUFACTURING PROCESS (KILOTONS) 2022-2029
TABLE 4 GLOBAL GFRP COMPOSITES MARKET BY MANUFACTURING PROCESS (USD BILLION) 2022-2029
TABLE 5 GLOBAL GFRP COMPOSITES MARKET BY END USER (KILOTONS) 2022-2029
TABLE 6 GLOBAL GFRP COMPOSITES MARKET BY END USER (USD BILLION) 2022-2029
TABLE 7 GLOBAL GFRP COMPOSITES MARKET BY REGION (USD BILLION) 2022-2029
TABLE 8 GLOBAL GFRP COMPOSITES MARKET BY REGION (KILOTONS) 2022-2029
TABLE 9 NORTH AMERICA GFRP COMPOSITES MARKET BY COUNTRY (USD BILLION) 2022-2029
TABLE 10 NORTH AMERICA GFRP COMPOSITES MARKET BY COUNTRY (KILOTONS) 2022-2029
TABLE 11 NORTH AMERICA GFRP COMPOSITES MARKET BY RESIN TYPE (USD BILLION) 2022-2029
TABLE 12 NORTH AMERICA GFRP COMPOSITES MARKET BY RESIN TYPE (KILOTONS) 2022-2029
TABLE 13 NORTH AMERICA GFRP COMPOSITES MARKET BY MANUFACTURING PROCESS (USD BILLION) 2022-2029
TABLE 14 NORTH AMERICA GFRP COMPOSITES MARKET BY MANUFACTURING PROCESS (KILOTONS) 2022-2029
TABLE 15 NORTH AMERICA GFRP COMPOSITES MARKET BY END USER (USD BILLION) 2022-2029
TABLE 16 NORTH AMERICA GFRP COMPOSITES MARKET BY END USER (KILOTONS) 2022-2029
TABLE 17 US GFRP COMPOSITES MARKET BY RESIN TYPE (KILOTONS) 2022-2029
TABLE 18 US GFRP COMPOSITES MARKET BY RESIN TYPE (USD BILLION) 2022-2029
TABLE 19 US GFRP COMPOSITES MARKET BY MANUFACTURING PROCESS (KILOTONS) 2022-2029
TABLE 20 US GFRP COMPOSITES MARKET BY MANUFACTURING PROCESS (USD BILLION) 2022-2029
TABLE 21 US GFRP COMPOSITES MARKET BY END USER (KILOTONS) 2022-2029
TABLE 22 US GFRP COMPOSITES MARKET BY END USER (USD BILLION) 2022-2029
TABLE 23 CANADA GFRP COMPOSITES MARKET BY RESIN TYPE (KILOTONS) 2022-2029
TABLE 24 CANADA GFRP COMPOSITES MARKET BY RESIN TYPE (USD BILLION) 2022-2029
TABLE 25 CANADA GFRP COMPOSITES MARKET BY MANUFACTURING PROCESS (KILOTONS) 2022-2029
TABLE 26 CANADA GFRP COMPOSITES MARKET BY MANUFACTURING PROCESS (USD BILLION) 2022-2029
TABLE 27 CANADA GFRP COMPOSITES MARKET BY END USER (KILOTONS) 2022-2029
TABLE 28 CANADA GFRP COMPOSITES MARKET BY END USER (USD BILLION) 2022-2029
TABLE 29 MEXICO GFRP COMPOSITES MARKET BY RESIN TYPE (KILOTONS) 2022-2029
TABLE 30 MEXICO GFRP COMPOSITES MARKET BY RESIN TYPE (USD BILLION) 2022-2029
TABLE 31 MEXICO GFRP COMPOSITES MARKET BY MANUFACTURING PROCESS (KILOTONS) 2022-2029
TABLE 32 MEXICO GFRP COMPOSITES MARKET BY MANUFACTURING PROCESS (USD BILLION) 2022-2029
TABLE 33 MEXICO GFRP COMPOSITES MARKET BY END USER (KILOTONS) 2022-2029
TABLE 34 MEXICO GFRP COMPOSITES MARKET BY END USER (USD BILLION) 2022-2029
TABLE 35 SOUTH AMERICA GFRP COMPOSITES MARKET BY COUNTRY (USD BILLION) 2022-2029
TABLE 36 SOUTH AMERICA GFRP COMPOSITES MARKET BY COUNTRY (KILOTONS) 2022-2029
TABLE 37 SOUTH AMERICA GFRP COMPOSITES MARKET BY RESIN TYPE (USD BILLION) 2022-2029
TABLE 38 SOUTH AMERICA GFRP COMPOSITES MARKET BY RESIN TYPE (KILOTONS) 2022-2029
TABLE 39 SOUTH AMERICA GFRP COMPOSITES MARKET BY MANUFACTURING PROCESS (USD BILLION) 2022-2029
TABLE 40 SOUTH AMERICA GFRP COMPOSITES MARKET BY MANUFACTURING PROCESS (KILOTONS) 2022-2029
TABLE 41 SOUTH AMERICA GFRP COMPOSITES MARKET BY END USER (USD BILLION) 2022-2029
TABLE 42 SOUTH AMERICA GFRP COMPOSITES MARKET BY END USER (KILOTONS) 2022-2029
TABLE 43 BRAZIL GFRP COMPOSITES MARKET BY RESIN TYPE (KILOTONS) 2022-2029
TABLE 44 BRAZIL GFRP COMPOSITES MARKET BY RESIN TYPE (USD BILLION) 2022-2029
TABLE 45 BRAZIL GFRP COMPOSITES MARKET BY MANUFACTURING PROCESS (KILOTONS) 2022-2029
TABLE 46 BRAZIL GFRP COMPOSITES MARKET BY MANUFACTURING PROCESS (USD BILLION) 2022-2029
TABLE 47 BRAZIL GFRP COMPOSITES MARKET BY END USER (KILOTONS) 2022-2029
TABLE 48 BRAZIL GFRP COMPOSITES MARKET BY END USER (USD BILLION) 2022-2029
TABLE 49 ARGENTINA GFRP COMPOSITES MARKET BY RESIN TYPE (KILOTONS) 2022-2029
TABLE 50 ARGENTINA GFRP COMPOSITES MARKET BY RESIN TYPE (USD BILLION) 2022-2029
TABLE 51 ARGENTINA GFRP COMPOSITES MARKET BY MANUFACTURING PROCESS (KILOTONS) 2022-2029
TABLE 52 ARGENTINA GFRP COMPOSITES MARKET BY MANUFACTURING PROCESS (USD BILLION) 2022-2029
TABLE 53 ARGENTINA GFRP COMPOSITES MARKET BY END USER (KILOTONS) 2022-2029
TABLE 54 ARGENTINA GFRP COMPOSITES MARKET BY END USER (USD BILLION) 2022-2029
TABLE 55 COLOMBIA GFRP COMPOSITES MARKET BY RESIN TYPE (KILOTONS) 2022-2029
TABLE 56 COLOMBIA GFRP COMPOSITES MARKET BY RESIN TYPE (USD BILLION) 2022-2029
TABLE 57 COLOMBIA GFRP COMPOSITES MARKET BY MANUFACTURING PROCESS (KILOTONS) 2022-2029
TABLE 58 COLOMBIA GFRP COMPOSITES MARKET BY MANUFACTURING PROCESS (USD BILLION) 2022-2029
TABLE 59 COLOMBIA GFRP COMPOSITES MARKET BY END USER (KILOTONS) 2022-2029
TABLE 60 COLOMBIA GFRP COMPOSITES MARKET BY END USER (USD BILLION) 2022-2029
TABLE 61 REST OF SOUTH AMERICA GFRP COMPOSITES MARKET BY RESIN TYPE (KILOTONS) 2022-2029
TABLE 62 REST OF SOUTH AMERICA GFRP COMPOSITES MARKET BY RESIN TYPE (USD BILLION) 2022-2029
TABLE 63 REST OF SOUTH AMERICA GFRP COMPOSITES MARKET BY MANUFACTURING PROCESS (KILOTONS) 2022-2029
TABLE 64 REST OF SOUTH AMERICA GFRP COMPOSITES MARKET BY MANUFACTURING PROCESS (USD BILLION) 2022-2029
TABLE 65 REST OF SOUTH AMERICA GFRP COMPOSITES MARKET BY END USER (KILOTONS) 2022-2029
TABLE 66 REST OF SOUTH AMERICA GFRP COMPOSITES MARKET BY END USER (USD BILLION) 2022-2029
TABLE 67 ASIA-PACIFIC GFRP COMPOSITES MARKET BY COUNTRY (USD BILLION) 2022-2029
TABLE 68 ASIA-PACIFIC GFRP COMPOSITES MARKET BY COUNTRY (KILOTONS) 2022-2029
TABLE 69 ASIA-PACIFIC GFRP COMPOSITES MARKET BY RESIN TYPE (USD BILLION) 2022-2029
TABLE 70 ASIA-PACIFIC GFRP COMPOSITES MARKET BY RESIN TYPE (KILOTONS) 2022-2029
TABLE 71 ASIA-PACIFIC GFRP COMPOSITES MARKET BY MANUFACTURING PROCESS (USD BILLION) 2022-2029
TABLE 72 ASIA-PACIFIC GFRP COMPOSITES MARKET BY MANUFACTURING PROCESS (KILOTONS) 2022-2029
TABLE 73 ASIA-PACIFIC GFRP COMPOSITES MARKET BY END USER (USD BILLION) 2022-2029
TABLE 74 ASIA-PACIFIC GFRP COMPOSITES MARKET BY END USER (KILOTONS) 2022-2029
TABLE 75 INDIA GFRP COMPOSITES MARKET BY RESIN TYPE (KILOTONS) 2022-2029
TABLE 76 INDIA GFRP COMPOSITES MARKET BY RESIN TYPE (USD BILLION) 2022-2029
TABLE 77 INDIA GFRP COMPOSITES MARKET BY MANUFACTURING PROCESS (KILOTONS) 2022-2029
TABLE 78 INDIA GFRP COMPOSITES MARKET BY MANUFACTURING PROCESS (USD BILLION) 2022-2029
TABLE 79 INDIA GFRP COMPOSITES MARKET BY END USER (KILOTONS) 2022-2029
TABLE 80 INDIA GFRP COMPOSITES MARKET BY END USER (USD BILLION) 2022-2029
TABLE 81 CHINA GFRP COMPOSITES MARKET BY RESIN TYPE (KILOTONS) 2022-2029
TABLE 82 CHINA GFRP COMPOSITES MARKET BY RESIN TYPE (USD BILLION) 2022-2029
TABLE 83 CHINA GFRP COMPOSITES MARKET BY MANUFACTURING PROCESS (KILOTONS) 2022-2029
TABLE 84 CHINA GFRP COMPOSITES MARKET BY MANUFACTURING PROCESS (USD BILLION) 2022-2029
TABLE 85 CHINA GFRP COMPOSITES MARKET BY END USER (KILOTONS) 2022-2029
TABLE 86 CHINA GFRP COMPOSITES MARKET BY END USER (USD BILLION) 2022-2029
TABLE 87 JAPAN GFRP COMPOSITES MARKET BY RESIN TYPE (KILOTONS) 2022-2029
TABLE 88 JAPAN GFRP COMPOSITES MARKET BY RESIN TYPE (USD BILLION) 2022-2029
TABLE 89 JAPAN GFRP COMPOSITES MARKET BY MANUFACTURING PROCESS (KILOTONS) 2022-2029
TABLE 90 JAPAN GFRP COMPOSITES MARKET BY MANUFACTURING PROCESS (USD BILLION) 2022-2029
TABLE 91 JAPAN GFRP COMPOSITES MARKET BY END USER (KILOTONS) 2022-2029
TABLE 92 JAPAN GFRP COMPOSITES MARKET BY END USER (USD BILLION) 2022-2029
TABLE 93 SOUTH KOREA GFRP COMPOSITES MARKET BY RESIN TYPE (KILOTONS) 2022-2029
TABLE 94 SOUTH KOREA GFRP COMPOSITES MARKET BY RESIN TYPE (USD BILLION) 2022-2029
TABLE 95 SOUTH KOREA GFRP COMPOSITES MARKET BY MANUFACTURING PROCESS (KILOTONS) 2022-2029
TABLE 96 SOUTH KOREA GFRP COMPOSITES MARKET BY MANUFACTURING PROCESS (USD BILLION) 2022-2029
TABLE 97 SOUTH KOREA GFRP COMPOSITES MARKET BY END USER (KILOTONS) 2022-2029
TABLE 98 SOUTH KOREA GFRP COMPOSITES MARKET BY END USER (USD BILLION) 2022-2029
TABLE 99 AUSTRALIA GFRP COMPOSITES MARKET BY RESIN TYPE (KILOTONS) 2022-2029
TABLE 100 AUSTRALIA GFRP COMPOSITES MARKET BY RESIN TYPE (USD BILLION) 2022-2029
TABLE 101 AUSTRALIA GFRP COMPOSITES MARKET BY MANUFACTURING PROCESS (KILOTONS) 2022-2029
TABLE 102 AUSTRALIA GFRP COMPOSITES MARKET BY MANUFACTURING PROCESS (USD BILLION) 2022-2029
TABLE 103 AUSTRALIA GFRP COMPOSITES MARKET BY END USER (KILOTONS) 2022-2029
TABLE 104 AUSTRALIA GFRP COMPOSITES MARKET BY END USER (USD BILLION) 2022-2029
TABLE 105 SOUTH-EAST ASIA GFRP COMPOSITES MARKET BY RESIN TYPE (KILOTONS) 2022-2029
TABLE 106 SOUTH-EAST ASIA GFRP COMPOSITES MARKET BY RESIN TYPE (USD BILLION) 2022-2029
TABLE 107 SOUTH-EAST ASIA GFRP COMPOSITES MARKET BY MANUFACTURING PROCESS (KILOTONS) 2022-2029
TABLE 108 SOUTH-EAST ASIA GFRP COMPOSITES MARKET BY MANUFACTURING PROCESS (USD BILLION) 2022-2029
TABLE 109 SOUTH-EAST ASIA GFRP COMPOSITES MARKET BY END USER (KILOTONS) 2022-2029
TABLE 110 SOUTH-EAST ASIA GFRP COMPOSITES MARKET BY END USER (USD BILLION) 2022-2029
TABLE 111 REST OF ASIA PACIFIC GFRP COMPOSITES MARKET BY RESIN TYPE (KILOTONS) 2022-2029
TABLE 112 REST OF ASIA PACIFIC GFRP COMPOSITES MARKET BY RESIN TYPE (USD BILLION) 2022-2029
TABLE 113 REST OF ASIA PACIFIC GFRP COMPOSITES MARKET BY MANUFACTURING PROCESS (KILOTONS) 2022-2029
TABLE 114 REST OF ASIA PACIFIC GFRP COMPOSITES MARKET BY MANUFACTURING PROCESS (USD BILLION) 2022-2029
TABLE 115 REST OF ASIA PACIFIC GFRP COMPOSITES MARKET BY END USER (KILOTONS) 2022-2029
TABLE 116 REST OF ASIA PACIFIC GFRP COMPOSITES MARKET BY END USER (USD BILLION) 2022-2029
TABLE 117 EUROPE GFRP COMPOSITES MARKET BY COUNTRY (USD BILLION) 2022-2029
TABLE 118 EUROPE GFRP COMPOSITES MARKET BY COUNTRY (KILOTONS) 2022-2029
TABLE 119 EUROPE GFRP COMPOSITES MARKET BY RESIN TYPE (USD BILLION) 2022-2029
TABLE 120 EUROPE GFRP COMPOSITES MARKET BY RESIN TYPE (KILOTONS) 2022-2029
TABLE 121 EUROPE GFRP COMPOSITES MARKET BY MANUFACTURING PROCESS (USD BILLION) 2022-2029
TABLE 122 EUROPE GFRP COMPOSITES MARKET BY MANUFACTURING PROCESS (KILOTONS) 2022-2029
TABLE 123 EUROPE GFRP COMPOSITES MARKET BY END USER (USD BILLION) 2022-2029
TABLE 124 EUROPE GFRP COMPOSITES MARKET BY END USER (KILOTONS) 2022-2029
TABLE 125 GERMANY GFRP COMPOSITES MARKET BY RESIN TYPE (KILOTONS) 2022-2029
TABLE 126 GERMANY GFRP COMPOSITES MARKET BY RESIN TYPE (USD BILLION) 2022-2029
TABLE 127 GERMANY GFRP COMPOSITES MARKET BY MANUFACTURING PROCESS (KILOTONS) 2022-2029
TABLE 128 GERMANY GFRP COMPOSITES MARKET BY MANUFACTURING PROCESS (USD BILLION) 2022-2029
TABLE 129 GERMANY GFRP COMPOSITES MARKET BY END USER (KILOTONS) 2022-2029
TABLE 130 GERMANY GFRP COMPOSITES MARKET BY END USER (USD BILLION) 2022-2029
TABLE 131 UK GFRP COMPOSITES MARKET BY RESIN TYPE (KILOTONS) 2022-2029
TABLE 132 UK GFRP COMPOSITES MARKET BY RESIN TYPE (USD BILLION) 2022-2029
TABLE 133 UK GFRP COMPOSITES MARKET BY MANUFACTURING PROCESS (KILOTONS) 2022-2029
TABLE 134 UK GFRP COMPOSITES MARKET BY MANUFACTURING PROCESS (USD BILLION) 2022-2029
TABLE 135 UK GFRP COMPOSITES MARKET BY END USER (KILOTONS) 2022-2029
TABLE 136 UK GFRP COMPOSITES MARKET BY END USER (USD BILLION) 2022-2029
TABLE 137 FRANCE GFRP COMPOSITES MARKET BY RESIN TYPE (KILOTONS) 2022-2029
TABLE 138 FRANCE GFRP COMPOSITES MARKET BY RESIN TYPE (USD BILLION) 2022-2029
TABLE 139 FRANCE GFRP COMPOSITES MARKET BY MANUFACTURING PROCESS (KILOTONS) 2022-2029
TABLE 140 FRANCE GFRP COMPOSITES MARKET BY MANUFACTURING PROCESS (USD BILLION) 2022-2029
TABLE 141 FRANCE GFRP COMPOSITES MARKET BY END USER (KILOTONS) 2022-2029
TABLE 142 FRANCE GFRP COMPOSITES MARKET BY END USER (USD BILLION) 2022-2029
TABLE 143 ITALY GFRP COMPOSITES MARKET BY RESIN TYPE (KILOTONS) 2022-2029
TABLE 144 ITALY GFRP COMPOSITES MARKET BY RESIN TYPE (USD BILLION) 2022-2029
TABLE 145 ITALY GFRP COMPOSITES MARKET BY MANUFACTURING PROCESS (KILOTONS) 2022-2029
TABLE 146 ITALY GFRP COMPOSITES MARKET BY MANUFACTURING PROCESS (USD BILLION) 2022-2029
TABLE 147 ITALY GFRP COMPOSITES MARKET BY END USER (KILOTONS) 2022-2029
TABLE 148 ITALY GFRP COMPOSITES MARKET BY END USER (USD BILLION) 2022-2029
TABLE 149 SPAIN GFRP COMPOSITES MARKET BY RESIN TYPE (KILOTONS) 2022-2029
TABLE 150 SPAIN GFRP COMPOSITES MARKET BY RESIN TYPE (USD BILLION) 2022-2029
TABLE 151 SPAIN GFRP COMPOSITES MARKET BY MANUFACTURING PROCESS (KILOTONS) 2022-2029
TABLE 152 SPAIN GFRP COMPOSITES MARKET BY MANUFACTURING PROCESS (USD BILLION) 2022-2029
TABLE 153 SPAIN GFRP COMPOSITES MARKET BY END USER (KILOTONS) 2022-2029
TABLE 154 SPAIN GFRP COMPOSITES MARKET BY END USER (USD BILLION) 2022-2029
TABLE 155 RUSSIA GFRP COMPOSITES MARKET BY RESIN TYPE (KILOTONS) 2022-2029
TABLE 156 RUSSIA GFRP COMPOSITES MARKET BY RESIN TYPE (USD BILLION) 2022-2029
TABLE 157 RUSSIA GFRP COMPOSITES MARKET BY MANUFACTURING PROCESS (KILOTONS) 2022-2029
TABLE 158 RUSSIA GFRP COMPOSITES MARKET BY MANUFACTURING PROCESS (USD BILLION) 2022-2029
TABLE 159 RUSSIA GFRP COMPOSITES MARKET BY END USER (KILOTONS) 2022-2029
TABLE 160 RUSSIA GFRP COMPOSITES MARKET BY END USER (USD BILLION) 2022-2029
TABLE 161 REST OF EUROPE GFRP COMPOSITES MARKET BY RESIN TYPE (KILOTONS) 2022-2029
TABLE 162 REST OF EUROPE GFRP COMPOSITES MARKET BY RESIN TYPE (USD BILLION) 2022-2029
TABLE 163 REST OF EUROPE GFRP COMPOSITES MARKET BY MANUFACTURING PROCESS (KILOTONS) 2022-2029
TABLE 164 REST OF EUROPE GFRP COMPOSITES MARKET BY MANUFACTURING PROCESS (USD BILLION) 2022-2029
TABLE 165 REST OF EUROPE GFRP COMPOSITES MARKET BY END USER (KILOTONS) 2022-2029
TABLE 166 REST OF EUROPE GFRP COMPOSITES MARKET BY END USER (USD BILLION) 2022-2029
TABLE 167 MIDDLE EAST AND AFRICA GFRP COMPOSITES MARKET BY COUNTRY (USD BILLION) 2022-2029
TABLE 168 MIDDLE EAST AND AFRICA GFRP COMPOSITES MARKET BY COUNTRY (KILOTONS) 2022-2029
TABLE 169 MIDDLE EAST AND AFRICA GFRP COMPOSITES MARKET BY RESIN TYPE (USD BILLION) 2022-2029
TABLE 170 MIDDLE EAST AND AFRICA GFRP COMPOSITES MARKET BY RESIN TYPE (KILOTONS) 2022-2029
TABLE 171 MIDDLE EAST AND AFRICA GFRP COMPOSITES MARKET BY MANUFACTURING PROCESS (USD BILLION) 2022-2029
TABLE 172 MIDDLE EAST AND AFRICA GFRP COMPOSITES MARKET BY MANUFACTURING PROCESS (KILOTONS) 2022-2029
TABLE 173 MIDDLE EAST AND AFRICA GFRP COMPOSITES MARKET BY END USER (USD BILLION) 2022-2029
TABLE 174 MIDDLE EAST AND AFRICA GFRP COMPOSITES MARKET BY END USER (KILOTONS) 2022-2029
TABLE 175 UAE GFRP COMPOSITES MARKET BY RESIN TYPE (KILOTONS) 2022-2029
TABLE 176 UAE GFRP COMPOSITES MARKET BY RESIN TYPE (USD BILLION) 2022-2029
TABLE 177 UAE GFRP COMPOSITES MARKET BY MANUFACTURING PROCESS (KILOTONS) 2022-2029
TABLE 178 UAE GFRP COMPOSITES MARKET BY MANUFACTURING PROCESS (USD BILLION) 2022-2029
TABLE 179 UAE GFRP COMPOSITES MARKET BY END USER (KILOTONS) 2022-2029
TABLE 180 UAE GFRP COMPOSITES MARKET BY END USER (USD BILLION) 2022-2029
TABLE 181 SAUDI ARABIA GFRP COMPOSITES MARKET BY RESIN TYPE (KILOTONS) 2022-2029
TABLE 182 SAUDI ARABIA GFRP COMPOSITES MARKET BY RESIN TYPE (USD BILLION) 2022-2029
TABLE 183 SAUDI ARABIA GFRP COMPOSITES MARKET BY MANUFACTURING PROCESS (KILOTONS) 2022-2029
TABLE 184 SAUDI ARABIA GFRP COMPOSITES MARKET BY MANUFACTURING PROCESS (USD BILLION) 2022-2029
TABLE 185 SAUDI ARABIA GFRP COMPOSITES MARKET BY END USER (KILOTONS) 2022-2029
TABLE 186 SAUDI ARABIA GFRP COMPOSITES MARKET BY END USER (USD BILLION) 2022-2029
TABLE 187 SOUTH AFRICA GFRP COMPOSITES MARKET BY RESIN TYPE (KILOTONS) 2022-2029
TABLE 188 SOUTH AFRICA GFRP COMPOSITES MARKET BY RESIN TYPE (USD BILLION) 2022-2029
TABLE 189 SOUTH AFRICA GFRP COMPOSITES MARKET BY MANUFACTURING PROCESS (KILOTONS) 2022-2029
TABLE 190 SOUTH AFRICA GFRP COMPOSITES MARKET BY MANUFACTURING PROCESS (USD BILLION) 2022-2029
TABLE 191 SOUTH AFRICA GFRP COMPOSITES MARKET BY END USER (KILOTONS) 2022-2029
TABLE 192 SOUTH AFRICA GFRP COMPOSITES MARKET BY END USER (USD BILLION) 2022-2029
TABLE 193 REST OF MIDDLE EAST AND AFRICA GFRP COMPOSITES MARKET BY RESIN TYPE (KILOTONS) 2022-2029
TABLE 194 REST OF MIDDLE EAST AND AFRICA GFRP COMPOSITES MARKET BY RESIN TYPE (USD BILLION) 2022-2029
TABLE 195 REST OF MIDDLE EAST AND AFRICA GFRP COMPOSITES MARKET BY MANUFACTURING PROCESS (KILOTONS) 2022-2029
TABLE 196 REST OF MIDDLE EAST AND AFRICA GFRP COMPOSITES MARKET BY MANUFACTURING PROCESS (USD BILLION) 2022-2029
TABLE 197 REST OF MIDDLE EAST AND AFRICA GFRP COMPOSITES MARKET BY END USER (KILOTONS) 2022-2029
TABLE 198 REST OF MIDDLE EAST AND AFRICA GFRP COMPOSITES MARKET BY END USER (USD BILLION) 2022-2029
LIST OF FIGURES
FIGURE 1 MARKET DYNAMICS
FIGURE 2 MARKET SEGMENTATION
FIGURE 3 REPORT TIMELINES: YEARS CONSIDERED
FIGURE 4 DATA TRIANGULATION
FIGURE 5 BOTTOM-UP APPROACH
FIGURE 6 TOP-DOWN APPROACH
FIGURE 7 RESEARCH FLOW
FIGURE 8 GLOBAL GFRP COMPOSITES MARKET BY RESIN TYPE, USD BILLION, 2022-2029
FIGURE 9 GLOBAL GFRP COMPOSITES MARKET BY MANUFACTURING PROCESS, USD BILLION, 2022-2029
FIGURE 10 GLOBAL GFRP COMPOSITES MARKET BY END USER, USD BILLION, 2022-2029
FIGURE 11 GLOBAL GFRP COMPOSITES MARKET BY REGION, USD BILLION, 2022-2029
FIGURE 12 PORTER’S FIVE FORCES MODEL
FIGURE 13 GLOBAL GFRP COMPOSITES MARKET BY RESIN TYPE, USD BILLION, 2021
FIGURE 14 GLOBAL GFRP COMPOSITES MARKET BY MANUFACTURING PROCESS, USD BILLION, 2021
FIGURE 15 GLOBAL GFRP COMPOSITES MARKET BY END USER, USD BILLION, 2021
FIGURE 16 GLOBAL GFRP COMPOSITES MARKET BY REGION, USD BILLION, 2021
FIGURE 17 MARKET SHARE ANALYSIS
FIGURE 18 JOHNS MANVILLE: COMPANY SNAPSHOT
FIGURE 19 BGF INDUSTRIES: COMPANY SNAPSHOT
FIGURE 20 ASAHI GLASS COMPANY LIMITED: COMPANY SNAPSHOT
FIGURE 21 ADVANCED GLASSFIBER YARNS LLC: COMPANY SNAPSHOT
FIGURE 22 CHOMARAT GROUP: COMPANY SNAPSHOT
FIGURE 23 JUSHI GROUP CO. LTD: COMPANY SNAPSHOT
FIGURE 24 TAISHAN FIBERGLASS INC: COMPANY SNAPSHOT
FIGURE 25 OWENS CORNING, PPG INDUSTRIES INC: COMPANY SNAPSHOT
FIGURE 26 BINANI 3B-THE FIBREGLASS COMPANY: COMPANY SNAPSHOT
FIGURE 27 SAERTEX GROUP: COMPANY SNAPSHOT
FIGURE 28 CHONGQING POLYCOMP INTERNATIONAL CORP: COMPANY SNAPSHOT
FIGURE 29 SAINT-GOBAIN VETROTEX: COMPANY SNAPSHOT
FIGURE 30 NITTO BOSEKI CO. LTD: COMPANY SNAPSHOT
FIGURE 31 NIPPON SHEET GLASS CO. LTD: COMPANY SNAPSHOT
DOWNLOAD FREE SAMPLE REPORT
License Type
SPEAK WITH OUR ANALYST
Want to know more about the report or any specific requirement?
WANT TO CUSTOMIZE THE REPORT?
Our Clients Speak
We asked them to research ‘ Equipment market’ all over the world, and their whole arrangement was helpful to us. thehealthanalytics.com insightful analysis and reports contributed to our current analysis and in creating a future strategy. Besides, the te
Yosuke Mitsui
Senior Associate Construction Equipment Sales & Marketing
We asked them to research ‘Equipment market’ all over the world, and their whole arrangement was helpful to us. thehealthanalytics.com insightful analysis and reports contributed to our current analysis and in creating a future strategy. Besides, the te


