

Base Year Value ()
x.x %
x.x %
CAGR ()
x.x %
x.x %
Forecast Year Value ()
x.x %
x.x %
Historical Data Period
Largest Region
Forecast Period
Global Enterprise Performance Management Market by Component (Solution, Service), by Deployment (Cloud based, On-premise), by Product (Finance, HR, Supply chain), by Application (BFSI, IT & Telecom, Retail, Manufacturing), and Region, Global Trends and Forecast From 2022 To 2029.
Instant access to hundreds of data points and trends
- Market estimates from 2014-2029
- Competitive analysis, industry segmentation, financial benchmarks
- Incorporates SWOT, Porter's Five Forces and risk management frameworks
- PDF report or online database with Word, Excel and PowerPoint export options
- 100% money back guarantee
Enterprise Performance Management Market Overview
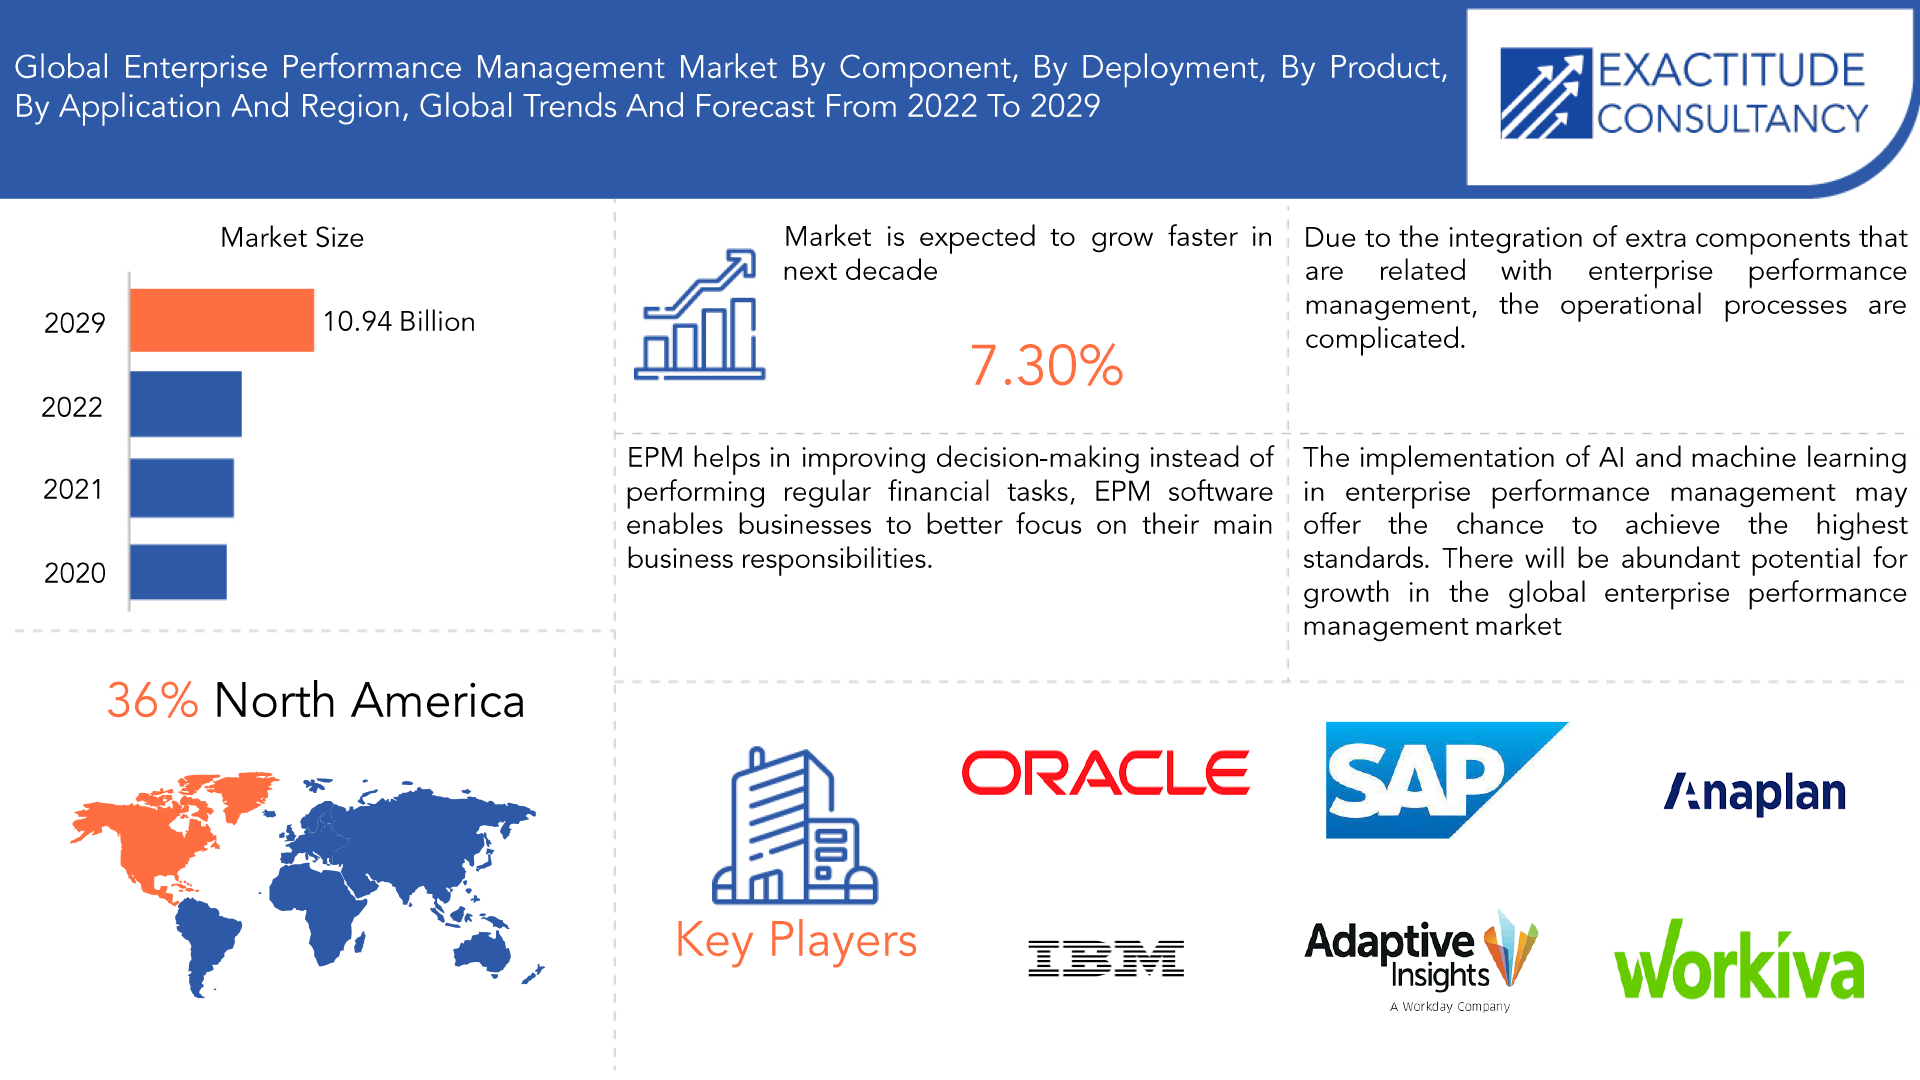
The global enterprise performance management market is expected to grow at 20.4 % CAGR from 2020 to 2029. It is expected to reach above USD 105.27 billion by 2029 from USD 19.8 billion in 2020.
The term Enterprise Performance Management (EPM) refers to a collection of management procedures and computer programs that are used by enterprises to organize, track, and control their operational performance. EPM helps firms to monitor and analyses their performance in relation to these plans, as well as to match their business strategy and objectives with their operational plans. EPM often incorporates a variety of financial planning and analysis tools including forecasting, reporting, and budgeting in addition to risk management, strategy management, performance assessment, and score carding. With the help of these technologies, businesses can gain a thorough insight of how their operations are doing and take data-driven choices to boost their outcomes.
With the expansion of the firm, a greater demand for superior resources is emerging. Companies therefore want effective EPM software that can grow in response to demand in order to add features and licenses as necessary. When the company develops and evolves, this software offers scalability and great performance. Moreover, it offers predictive analytics to cut down on the time spent on the finance function, freeing up time to concentrate on higher-value duties. It creates operational savings by automating repetitive operations, minimizing planning and reporting, providing Key Performance Indicators (KPI) & metrics for improved evaluation, financial closures, and regularly providing enterprises with qualitative business insights. By improving decision-making instead of performing regular financial tasks, EPM software enables businesses to better focus on their main business responsibilities.
| ATTRIBUTE | DETAILS |
| Study period | 2020-2029 |
| Base year | 2021 |
| Estimated year | 2022 |
| Forecasted year | 2022-2029 |
| Historical period | 2018-2020 |
| Unit | Value (USD Billion) |
| Segmentation | By Component, Deployment, Product, Application and region. |
| By Component
|
|
| By Deployment
|
|
| By Product
|
|
| By Application
|
|
| By Region
|
|
Due to the integration of extra components that are related with enterprise performance management, the operational processes are complicated. Due to the difficulties in installing it and the need for knowledgeable and experienced people, this raises the total cost for the business as well as the system cost. The additional maintenance costs associated with these systems prevent the market from expanding since they need regular maintenance inspections to assure their stability and functioning.
The implementation of AI and machine learning in enterprise performance management may offer the chance to achieve the highest standards. There will be abundant potential for growth in the global enterprise performance management market with the advent of IoT for enterprise performance management solutions for high performance and increased operational efficiency.
In the market for Enterprise Performance Management (EPM), the COVID-19 epidemic has had a considerable effect. The epidemic has disrupted and created uncertainty for several enterprises in the short term, which has boosted demand for EPM solutions to aid in scenario planning, financial forecasting, and risk management. Because of the epidemic, firms have been forced to quickly transition to remote work and digital collaboration, which has expedited the development of cloud-based EPM solutions. Remote teams can now access essential financial data and analysis, work together on planning and forecasting, and keep track of and control over their financial and operational performance thanks to cloud-based EPM systems.
[caption id="attachment_16507" align="aligncenter" width="1920"]
Frequently Asked Questions
• What is the worth of the global Enterprise Performance Management Market?
The global Enterprise Performance Management Market is expected to grow at 7.30% CAGR from 2020 to 2029. It is expected to reach above USD 10.94 Billion by 2029 from USD 5.80 Billion in 2020.
• What is the size of the North America Enterprise Performance Management Market?
North America held more than 36% of the Enterprise Performance Management Market revenue share in 2020 and will witness tremendous expansion during the forecast period.
• What are some of the market's driving forces?
It creates operational savings by automating repetitive operations, minimizing planning and reporting, providing Key Performance Indicators (KPI) & metrics for improved evaluation, financial closures, and regularly providing enterprises with qualitative business insights. By improving decision-making instead of performing regular financial tasks, EPM software enables businesses to better focus on their main business responsibilities.
• Which are the top companies to hold the market share in the Enterprise Performance Management Market?
The Enterprise Performance Management Market key players Adaptive Insights Inc., Anaplan Inc., Board International S.A., Host Analytics Inc., IBM, Infor Inc, Oracle, SAP SE, CCH Tagetik (Wolters Kluwer NV), Workiva, Unicom Systems.
• What is the leading Application of the Enterprise Performance Management Market?
The finance and banking are the major sectors where the application of Enterprise Performance Management has seen more.
• Which is the largest regional market for Enterprise Performance Management Market?
The Markets largest share is in the North America region.
Enterprise Performance Management Market Segment Analysis
The Enterprise Performance Management market is segmented on basis of component in 2 types software and service. The most important market sector for enterprise performance management is anticipated to be software. The ability for organizations to work at full capacity, the provision of tools to aid businesses in making important decisions about their future, and the reduction of time spent on planning, organizing, monitoring, projecting, and budgeting are factors driving the segment's growth.
The global enterprise performance management market has been divided into two categories depending on deployment: cloud-based and on-premise. As opposed to on-premises, the demand for cloud-based corporate performance management software is increasing because of its many advantages. The virtual technology housed offshore by the service provider may be used by businesses thanks to cloud-based enterprise performance management software. Enterprises have anytime, everywhere access to programs and other capabilities thanks to cloud-based corporate performance management software. It is inexpensive and doesn't demand up-front fees.
On the basis of product, the Enterprise Performance Management market is categorized into finance, HR, Supply Chain. Segment of finance has seen with higher market share. The market will be drawn to Enterprise Performance Management as a result of the increasing demand for it in the financial operations of enterprises across various industry verticals. EPM software has provided new advantages to both users and enterprises. Employees in accounting and finance were able to gather, record, and compute data more rapidly with the use of spreadsheets.
Market is also segmented in application and that is further segmented into BSFI, IT & Telecom, Retail, Manufacturing, Healthcare. Now here BSFI is accounted for greater market share than others. The BFSI business is seeing an increase in demand for Enterprise Performance Management, which has led to the category owning the greatest market share and poised to draw new customers for improved growth. Due to shifting demographics, industrialization, technical breakthroughs, and the widespread use of digital financial services, the BFSI business is flourishing and undergoing a revolutionary advancement. Every year, technology changes as a result of increased use, expanding expenditures in innovations, and other factors.
[caption id="attachment_16533" align="aligncenter" width="1920"]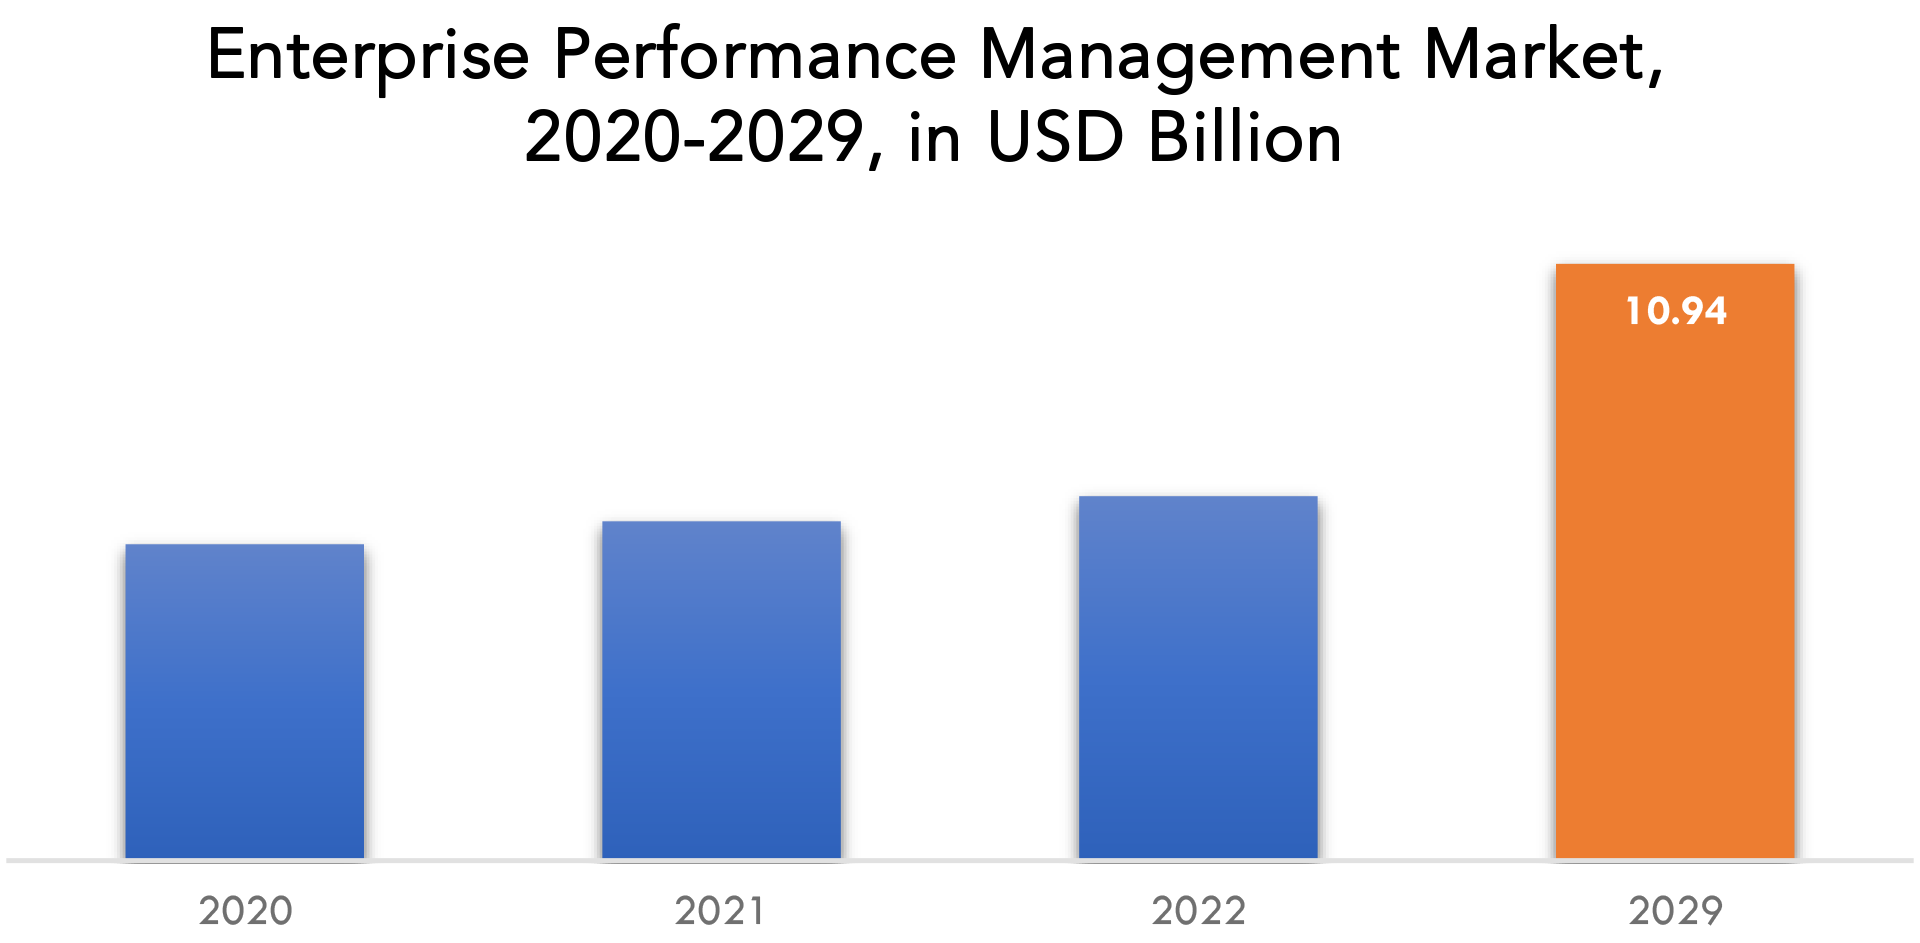
Enterprise Performance Management Market Players
The Enterprise Performance Management Market key players Adaptive Insights Inc., Anaplan Inc., Board International S.A., Host Analytics Inc., IBM, Infor Inc., Oracle, SAP SE, CCH Tagetik (Wolters Kluwer NV), Workiva, Unicom Systems. For corporate expansion, these key leaders are implementing strategic formulations such as new product development and commercialization, commercial expansion, and distribution agreements. Moreover, these participants are substantially spending on product development, which is fueling revenue generation. July 2022 - Oracle Corporation released Enterprise Performance Management (EPM) 11.2.10, available for download on Oracle Software Delivery Cloud. The new version included features like Java 8 Update 331, an updated Wallet creation section in the EPM Security guide, Oracle 21c database support, and other features. August 2022 - Nissan Motor Co., Ltd selected Anaplan, Inc. to collect and analyze global data worldwide. Nissan aimed to streamline complex operations, making more informed and prompt business decisions by using Anaplan to collect and analyze global data across its businesses, enabling real-time performance management and faster business decisions for the future.Who Should Buy? Or Key stakeholders
- Investors
- Media and Entertainment Companies
- Telecommunication Companies
- E-commerce Companies
- Health Care Industry
- Research Organizations
- Regulatory Authorities
- Institutional & retail players
- Others
Enterprise Performance Management Market Regional Analysis
The Enterprise Performance Management Market by region includes North America, Asia-Pacific (APAC), Europe, South America, and Middle East & Africa (MEA).
- North America: includes the US, Canada, Mexico
- Asia Pacific: includes China, Japan, South Korea, India, Australia, ASEAN, and Rest of APAC
- Europe: includes the UK, Germany, France, Italy, Spain, Russia, and the Rest of Europe
- South America: includes Brazil, Argentina, and Rest of South America
- Middle East & Africa: includes Turkey, UAE, Saudi Arabia, South Africa, and the Rest of MEA
The presence of huge corporations and the rapid uptake of cutting-edge technology in North America have helped to make this region the greatest market for EPM solutions. The area is an excellent market for EPM solutions since it has a significant banking industry and an advanced IT infrastructure. The largest market for EPM solutions in the area is the United States, followed by Canada.
The Asia-Pacific region is expected to be the fastest-growing market for EPM solutions, driven by the increasing adoption of advanced technology, the growing need for data-driven decision-making, and the focus on business agility and resilience. The region has a large number of emerging economies, such as China and India, that are rapidly adopting EPM solutions to support their economic growth.
[caption id="attachment_16536" align="aligncenter" width="1920"]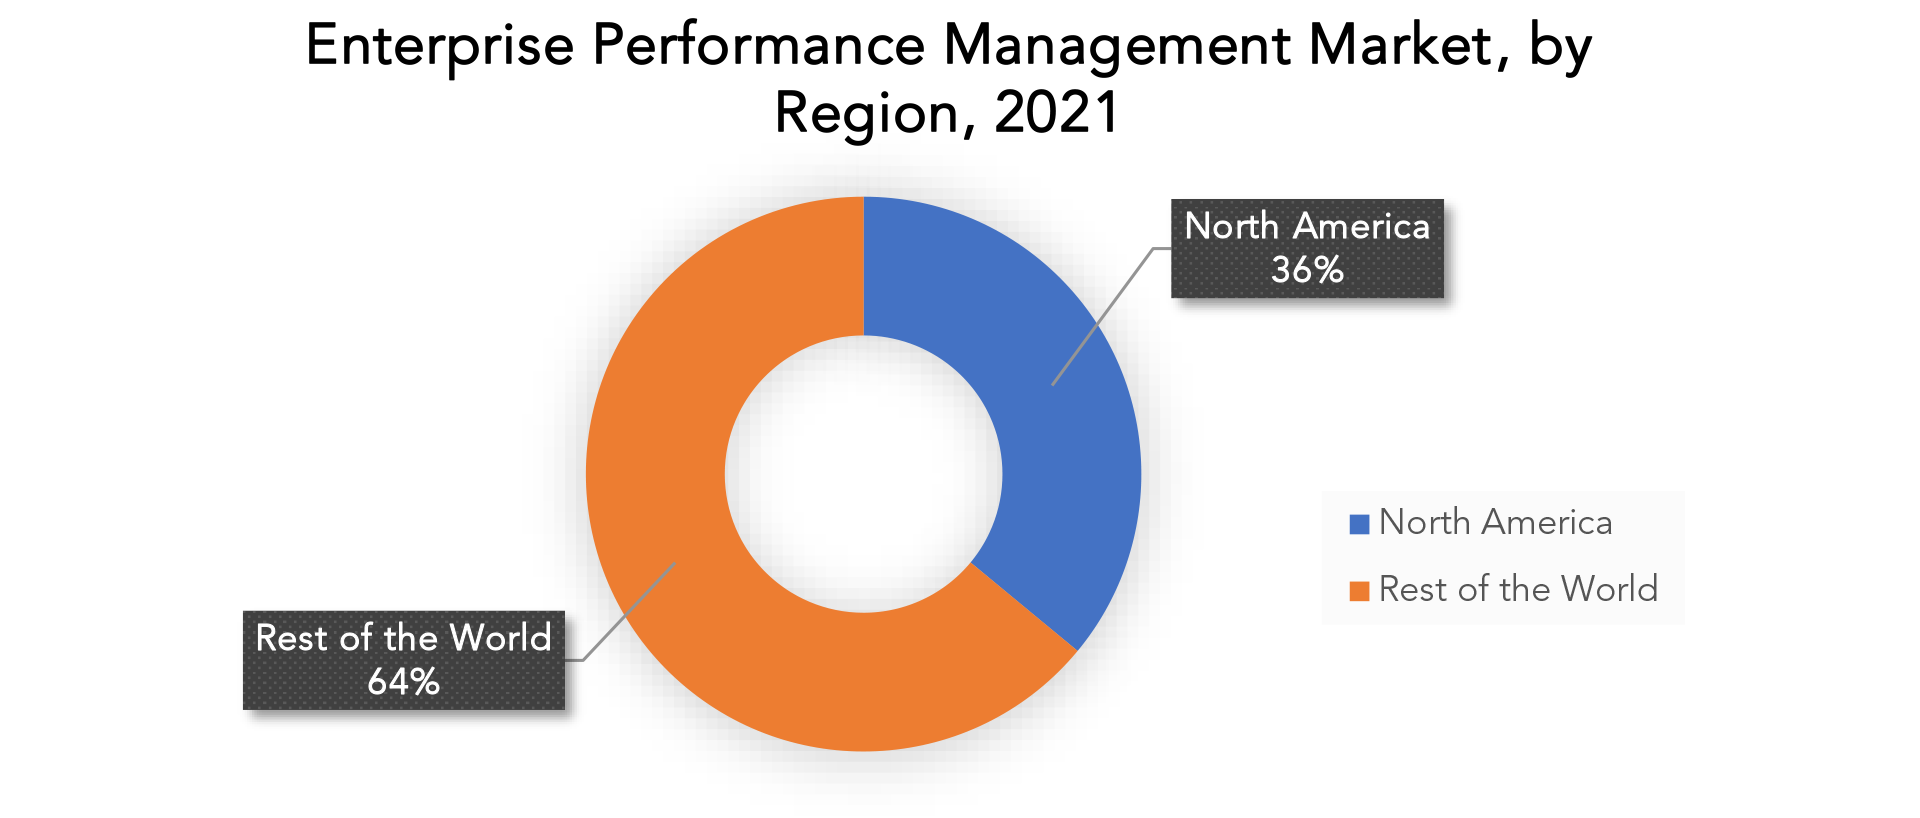
Key Market Segments: Enterprise Performance Management Market
Enterprise Performance Management Market By Component, 2020-2029, (Usd Billion)- Software
- Service
- Cloud Based
- On-Premise
- Finance
- Hr
- Supply Chain
- Bsfi
- It & Telecom
- Retail
- Manufacturing
- North America
- Asia Pacific
- Europe
- South America
- Middle East And Africa
Exactitude Consultancy Services Key Objectives:
- Increasing sales and market share
- Developing new technology
- Improving profitability
- Entering new markets
- Enhancing brand reputation
Key Question Answered
- What is the expected growth rate of the Enterprise Performance Management market over the next 7 years?
- Who are the major players in the Enterprise Performance Management market and what is their market share?
- What are the end-user industries driving demand for market and what is their outlook?
- What are the opportunities for growth in emerging markets such as Asia-pacific, middle east, and Africa?
- How is the economic environment affecting the Enterprise Performance Management market, including factors such as interest rates, inflation, and exchange rates?
- What is the expected impact of government policies and regulations on the Enterprise Performance Management market?
- What is the current and forecasted size and growth rate of the global Enterprise Performance Management market?
- What are the key drivers of growth in the Enterprise Performance Management market?
- Who are the major players in the market and what is their market share?
- What are the distribution channels and supply chain dynamics in the Enterprise Performance Management market?
- What are the technological advancements and innovations in the Enterprise Performance Management market and their impact on product development and growth?
- What are the regulatory considerations and their impact on the market?
- What are the challenges faced by players in the Enterprise Performance Management market and how are they addressing these challenges?
- What are the opportunities for growth and expansion in the Enterprise Performance Management market?
- What are the services offerings and specifications of leading players in the market?
- INTRODUCTION
- MARKET DEFINITION
- MARKET SEGMENTATION
- RESEARCH TIMELINES
- ASSUMPTIONS AND LIMITATIONS
- RESEARCH METHODOLOGY
- DATA MINING
- SECONDARY RESEARCH
- PRIMARY RESEARCH
- SUBJECT-MATTER EXPERTS’ ADVICE
- QUALITY CHECKS
- FINAL REVIEW
- DATA TRIANGULATION
- BOTTOM-UP APPROACH
- TOP-DOWN APPROACH
- RESEARCH FLOW
- DATA SOURCES
- DATA MINING
- EXECUTIVE SUMMARY
- MARKET OVERVIEW
- GLOBAL ENTERPRISE PERFORMANCE MANAGEMENT MARKET OUTLOOK
- MARKET DRIVERS
- MARKET RESTRAINTS
- MARKET OPPORTUNITIES
- IMPACT OF COVID-19 ON ENTERPRISE PERFORMANCE MANAGEMENT MARKET
- PORTER’S FIVE FORCES MODEL
- THREAT FROM NEW ENTRANTS
- THREAT FROM SUBSTITUTES
- BARGAINING POWER OF SUPPLIERS
- BARGAINING POWER OF CUSTOMERS
- DEGREE OF COMPETITION
- INDUSTRY VALUE CHAIN ANALYSIS
- GLOBAL ENTERPRISE PERFORMANCE MANAGEMENT MARKET OUTLOOK
- GLOBAL ENTERPRISE PERFORMANCE MANAGEMENT MARKET BY COMPONENT (USD BILLION), 2020-2029
- SOFTWARE
- SERVICE
- GLOBAL ENTERPRISE PERFORMANCE MANAGEMENT MARKET BY DEPLOYMENT (USD BILLION),2020-2029
- CLOUD BASED
- ON-PREMISE
- GLOBAL ENTERPRISE PERFORMANCE MANAGEMENT MARKET BY PRODUCT (USD BILLION),2020-2029
1. FINANCE
2. HR
3. SUPPLY CHAIN
- GLOBAL ENTERPRISE PERFORMANCE MANAGEMENT MARKET BY APPLICATION (USD BILLION),2020-2029
- BSFI
- IT & TELECOM
- RETAIL
- MANUFACTURING
- GLOBAL ENTERPRISE PERFORMANCE MANAGEMENT MARKET BY REGION (USD BILLION),2020-2029
- NORTH AMERICA
- US
- CANADA
- MEXICO
- SOUTH AMERICA
- BRAZIL
- ARGENTINA
- COLOMBIA
- REST OF SOUTH AMERICA
- EUROPE
- GERMANY
- UK
- FRANCE
- ITALY
- SPAIN
- RUSSIA
- REST OF EUROPE
- ASIA PACIFIC
- INDIA
- CHINA
- JAPAN
- SOUTH KOREA
- AUSTRALIA
- SOUTH-EAST ASIA
- REST OF ASIA PACIFIC
- MIDDLE EAST AND AFRICA
- UAE
- SAUDI ARABIA
- SOUTH AFRICA
- REST OF MIDDLE EAST AND AFRICA
- NORTH AMERICA
- COMPANY PROFILES* (BUSINESS OVERVIEW, COMPANY SNAPSHOT, PRODUCTS OFFERED, RECENT DEVELOPMENTS)
- ADAPTIVE INSIGHTS INC.
- ANAPLAN INC.
- BOARD INTERNATIONAL S.A.
- HOST ANALYTICS INC.
- IBM
- INFOR INC.
- ORACLE
- SAP SE
- CCH TAGETIK (WOLTERS KLUWER NV)
- WORKIVA
- UNICOM SYSTEMS *THE COMPANY LIST IS INDICATIVE
LIST OF TABLES
TABLE 1 GLOBAL ENTERPRISE PERFORMANCE MANAGEMENT MARKET BY COMPONENT (USD BILLION) 2020-2029
TABLE 2 GLOBAL ENTERPRISE PERFORMANCE MANAGEMENT MARKET BY DEPLOYMENT (USD BILLION) 2020-2029
TABLE 3 GLOBAL ENTERPRISE PERFORMANCE MANAGEMENT MARKET BY PRODUCT (USD BILLION) 2020-2029
TABLE 4 GLOBAL ENTERPRISE PERFORMANCE MANAGEMENT MARKET BY APPLICATION (USD BILLION) 2020-2029
TABLE 5 GLOBAL ENTERPRISE PERFORMANCE MANAGEMENT MARKET BY REGION (USD BILLION) 2020-2029
TABLE 6 NORTH AMERICA ENTERPRISE PERFORMANCE MANAGEMENT MARKET BY COUNTRY (USD BILLION) 2020-2029
TABLE 7 NORTH AMERICA ENTERPRISE PERFORMANCE MANAGEMENT MARKET BY COMPONENT (USD BILLION) 2020-2029
TABLE 8 NORTH AMERICA ENTERPRISE PERFORMANCE MANAGEMENT MARKET BY DEPLOYMENT (USD BILLION) 2020-2029
TABLE 9 NORTH AMERICA ENTERPRISE PERFORMANCE MANAGEMENT MARKET BY PRODUCT (USD BILLION) 2020-2029
TABLE 10 NORTH AMERICA ENTERPRISE PERFORMANCE MANAGEMENT MARKET BY APPLICATION (USD BILLION) 2020-2029
TABLE 11 US ENTERPRISE PERFORMANCE MANAGEMENT MARKET BY COMPONENT (USD BILLION) 2020-2029
TABLE 12 US ENTERPRISE PERFORMANCE MANAGEMENT MARKET BY DEPLOYMENT (USD BILLION) 2020-2029
TABLE 13 US ENTERPRISE PERFORMANCE MANAGEMENT MARKET BY PRODUCT (USD BILLION) 2020-2029
TABLE 14 US ENTERPRISE PERFORMANCE MANAGEMENT MARKET BY APPLICATION (USD BILLION) 2020-2029
TABLE 15 CANADA ENTERPRISE PERFORMANCE MANAGEMENT MARKET BY COMPONENT (USD BILLION) 2020-2029
TABLE 16 CANADA ENTERPRISE PERFORMANCE MANAGEMENT MARKET BY DEPLOYMENT (USD BILLION) 2020-2029
TABLE 17 CANADA ENTERPRISE PERFORMANCE MANAGEMENT MARKET BY PRODUCT (USD BILLION) 2020-2029
TABLE 18 CANADA ENTERPRISE PERFORMANCE MANAGEMENT MARKET BY APPLICATION (USD BILLION) 2020-2029
TABLE 19 MEXICO ENTERPRISE PERFORMANCE MANAGEMENT MARKET BY COMPONENT (USD BILLION) 2020-2029
TABLE 20 MEXICO ENTERPRISE PERFORMANCE MANAGEMENT MARKET BY DEPLOYMENT (USD BILLION) 2020-2029
TABLE 21 MEXICO ENTERPRISE PERFORMANCE MANAGEMENT MARKET BY PRODUCT (USD BILLION) 2020-2029
TABLE 22 MEXICO ENTERPRISE PERFORMANCE MANAGEMENT MARKET BY APPLICATION (USD BILLION) 2020-2029
TABLE 23 SOUTH AMERICA ENTERPRISE PERFORMANCE MANAGEMENT MARKET BY COUNTRY (USD BILLION) 2020-2029
TABLE 24 SOUTH AMERICA ENTERPRISE PERFORMANCE MANAGEMENT MARKET BY COMPONENT (USD BILLION) 2020-2029
TABLE 25 SOUTH AMERICA ENTERPRISE PERFORMANCE MANAGEMENT MARKET BY DEPLOYMENT (USD BILLION) 2020-2029
TABLE 26 SOUTH AMERICA ENTERPRISE PERFORMANCE MANAGEMENT MARKET BY PRODUCT (USD BILLION) 2020-2029
TABLE 27 SOUTH AMERICA ENTERPRISE PERFORMANCE MANAGEMENT MARKET BY APPLICATION (USD BILLION) 2020-2029
TABLE 28 BRAZIL ENTERPRISE PERFORMANCE MANAGEMENT MARKET BY COMPONENT (USD BILLION) 2020-2029
TABLE 29 BRAZIL ENTERPRISE PERFORMANCE MANAGEMENT MARKET BY DEPLOYMENT (USD BILLION) 2020-2029
TABLE 30 BRAZIL ENTERPRISE PERFORMANCE MANAGEMENT MARKET BY PRODUCT (USD BILLION) 2020-2029
TABLE 31 BRAZIL ENTERPRISE PERFORMANCE MANAGEMENT MARKET BY APPLICATION (USD BILLION) 2020-2029
TABLE 32 ARGENTINA ENTERPRISE PERFORMANCE MANAGEMENT MARKET BY COMPONENT (USD BILLION) 2020-2029
TABLE 33 ARGENTINA ENTERPRISE PERFORMANCE MANAGEMENT MARKET BY DEPLOYMENT (USD BILLION) 2020-2029
TABLE 34 ARGENTINA ENTERPRISE PERFORMANCE MANAGEMENT MARKET BY PRODUCT (USD BILLION) 2020-2029
TABLE 35 ARGENTINA ENTERPRISE PERFORMANCE MANAGEMENT MARKET BY APPLICATION (USD BILLION) 2020-2029
TABLE 36 COLOMBIA ENTERPRISE PERFORMANCE MANAGEMENT MARKET BY COMPONENT (USD BILLION) 2020-2029
TABLE 37 COLOMBIA ENTERPRISE PERFORMANCE MANAGEMENT MARKET BY DEPLOYMENT (USD BILLION) 2020-2029
TABLE 38 COLOMBIA ENTERPRISE PERFORMANCE MANAGEMENT MARKET BY PRODUCT (USD BILLION) 2020-2029
TABLE 39 COLOMBIA ENTERPRISE PERFORMANCE MANAGEMENT MARKET BY APPLICATION (USD BILLION) 2020-2029
TABLE 40 REST OF SOUTH AMERICA ENTERPRISE PERFORMANCE MANAGEMENT MARKET BY COMPONENT (USD BILLION) 2020-2029
TABLE 41 REST OF SOUTH AMERICA ENTERPRISE PERFORMANCE MANAGEMENT MARKET BY DEPLOYMENT (USD BILLION) 2020-2029
TABLE 42 REST OF SOUTH AMERICA ENTERPRISE PERFORMANCE MANAGEMENT MARKET BY PRODUCT (USD BILLION) 2020-2029
TABLE 43 REST OF SOUTH AMERICA ENTERPRISE PERFORMANCE MANAGEMENT MARKET BY APPLICATION (USD BILLION) 2020-2029
TABLE 44 ASIA-PACIFIC ENTERPRISE PERFORMANCE MANAGEMENT MARKET BY COUNTRY (USD BILLION) 2020-2029
TABLE 45 ASIA-PACIFIC ENTERPRISE PERFORMANCE MANAGEMENT MARKET BY COMPONENT (USD BILLION) 2020-2029
TABLE 46 ASIA-PACIFIC ENTERPRISE PERFORMANCE MANAGEMENT MARKET BY DEPLOYMENT (USD BILLION) 2020-2029
TABLE 47 ASIA-PACIFIC ENTERPRISE PERFORMANCE MANAGEMENT MARKET BY PRODUCT (USD BILLION) 2020-2029
TABLE 48 ASIA-PACIFIC ENTERPRISE PERFORMANCE MANAGEMENT MARKET BY APPLICATION (USD BILLION) 2020-2029
TABLE 49 INDIA ENTERPRISE PERFORMANCE MANAGEMENT MARKET BY COMPONENT (USD BILLION) 2020-2029
TABLE 50 INDIA ENTERPRISE PERFORMANCE MANAGEMENT MARKET BY DEPLOYMENT (USD BILLION) 2020-2029
TABLE 51 INDIA ENTERPRISE PERFORMANCE MANAGEMENT MARKET BY PRODUCT (USD BILLION) 2020-2029
TABLE 52 INDIA ENTERPRISE PERFORMANCE MANAGEMENT MARKET BY APPLICATION (USD BILLION) 2020-2029
TABLE 53 CHINA ENTERPRISE PERFORMANCE MANAGEMENT MARKET BY COMPONENT (USD BILLION) 2020-2029
TABLE 54 CHINA ENTERPRISE PERFORMANCE MANAGEMENT MARKET BY DEPLOYMENT (USD BILLION) 2020-2029
TABLE 55 CHINA ENTERPRISE PERFORMANCE MANAGEMENT MARKET BY PRODUCT (USD BILLION) 2020-2029
TABLE 56 CHINA ENTERPRISE PERFORMANCE MANAGEMENT MARKET BY APPLICATION (USD BILLION) 2020-2029
TABLE 57 JAPAN ENTERPRISE PERFORMANCE MANAGEMENT MARKET BY COMPONENT (USD BILLION) 2020-2029
TABLE 58 JAPAN ENTERPRISE PERFORMANCE MANAGEMENT MARKET BY DEPLOYMENT (USD BILLION) 2020-2029
TABLE 59 JAPAN ENTERPRISE PERFORMANCE MANAGEMENT MARKET BY PRODUCT (USD BILLION) 2020-2029
TABLE 60 JAPAN ENTERPRISE PERFORMANCE MANAGEMENT MARKET BY APPLICATION (USD BILLION) 2020-2029
TABLE 61 SOUTH KOREA ENTERPRISE PERFORMANCE MANAGEMENT MARKET BY COMPONENT (USD BILLION) 2020-2029
TABLE 62 SOUTH KOREA ENTERPRISE PERFORMANCE MANAGEMENT MARKET BY DEPLOYMENT (USD BILLION) 2020-2029
TABLE 63 SOUTH KOREA ENTERPRISE PERFORMANCE MANAGEMENT MARKET BY PRODUCT (USD BILLION) 2020-2029
TABLE 64 SOUTH KOREA ENTERPRISE PERFORMANCE MANAGEMENT MARKET BY APPLICATION (USD BILLION) 2020-2029
TABLE 65 AUSTRALIA ENTERPRISE PERFORMANCE MANAGEMENT MARKET BY COMPONENT (USD BILLION) 2020-2029
TABLE 66 AUSTRALIA ENTERPRISE PERFORMANCE MANAGEMENT MARKET BY DEPLOYMENT (USD BILLION) 2020-2029
TABLE 67 AUSTRALIA ENTERPRISE PERFORMANCE MANAGEMENT MARKET BY PRODUCT (USD BILLION) 2020-2029
TABLE 68 AUSTRALIA ENTERPRISE PERFORMANCE MANAGEMENT MARKET BY APPLICATION (USD BILLION) 2020-2029
TABLE 69 SOUTH-EAST ASIA ENTERPRISE PERFORMANCE MANAGEMENT MARKET BY COMPONENT (USD BILLION) 2020-2029
TABLE 70 SOUTH-EAST ASIA ENTERPRISE PERFORMANCE MANAGEMENT MARKET BY DEPLOYMENT (USD BILLION) 2020-2029
TABLE 71 SOUTH-EAST ASIA ENTERPRISE PERFORMANCE MANAGEMENT MARKET BY PRODUCT (USD BILLION) 2020-2029
TABLE 72 SOUTH-EAST ASIA ENTERPRISE PERFORMANCE MANAGEMENT MARKET BY APPLICATION (USD BILLION) 2020-2029
TABLE 73 REST OF ASIA PACIFIC ENTERPRISE PERFORMANCE MANAGEMENT MARKET BY COMPONENT (USD BILLION) 2020-2029
TABLE 74 REST OF ASIA PACIFIC ENTERPRISE PERFORMANCE MANAGEMENT MARKET BY DEPLOYMENT (USD BILLION) 2020-2029
TABLE 75 REST OF ASIA PACIFIC ENTERPRISE PERFORMANCE MANAGEMENT MARKET BY PRODUCT (USD BILLION) 2020-2029
TABLE 76 REST OF ASIA PACIFIC ENTERPRISE PERFORMANCE MANAGEMENT MARKET BY APPLICATION (USD BILLION) 2020-2029
TABLE 77 EUROPE ENTERPRISE PERFORMANCE MANAGEMENT MARKET BY COUNTRY (USD BILLION) 2020-2029
TABLE 78 GERMANY ENTERPRISE PERFORMANCE MANAGEMENT MARKET BY COMPONENT (USD BILLION) 2020-2029
TABLE 79 GERMANY ENTERPRISE PERFORMANCE MANAGEMENT MARKET BY DEPLOYMENT (USD BILLION) 2020-2029
TABLE 80 GERMANY ENTERPRISE PERFORMANCE MANAGEMENT MARKET BY PRODUCT (USD BILLION) 2020-2029
TABLE 81 GERMANY ENTERPRISE PERFORMANCE MANAGEMENT MARKET BY APPLICATION (USD BILLION) 2020-2029
TABLE 82 UK ENTERPRISE PERFORMANCE MANAGEMENT MARKET BY COMPONENT (USD BILLION) 2020-2029
TABLE 83 UK ENTERPRISE PERFORMANCE MANAGEMENT MARKET BY DEPLOYMENT (USD BILLION) 2020-2029
TABLE 84 UK ENTERPRISE PERFORMANCE MANAGEMENT MARKET BY PRODUCT (USD BILLION) 2020-2029
TABLE 85 UK ENTERPRISE PERFORMANCE MANAGEMENT MARKET BY APPLICATION (USD BILLION) 2020-2029
TABLE 86 FRANCE ENTERPRISE PERFORMANCE MANAGEMENT MARKET BY COMPONENT (USD BILLION) 2020-2029
TABLE 87 FRANCE ENTERPRISE PERFORMANCE MANAGEMENT MARKET BY DEPLOYMENT (USD BILLION) 2020-2029
TABLE 88 FRANCE ENTERPRISE PERFORMANCE MANAGEMENT MARKET BY PRODUCT (USD BILLION) 2020-2029
TABLE 89 FRANCE ENTERPRISE PERFORMANCE MANAGEMENT MARKET BY APPLICATION (USD BILLION) 2020-2029
TABLE 90 ITALY ENTERPRISE PERFORMANCE MANAGEMENT MARKET BY COMPONENT (USD BILLION) 2020-2029
TABLE 91 ITALY ENTERPRISE PERFORMANCE MANAGEMENT MARKET BY DEPLOYMENT (USD BILLION) 2020-2029
TABLE 92 ITALY ENTERPRISE PERFORMANCE MANAGEMENT MARKET BY PRODUCT (USD BILLION) 2020-2029
TABLE 93 ITALY ENTERPRISE PERFORMANCE MANAGEMENT MARKET BY APPLICATION (USD BILLION) 2020-2029
TABLE 94 SPAIN ENTERPRISE PERFORMANCE MANAGEMENT MARKET BY COMPONENT (USD BILLION) 2020-2029
TABLE 95 SPAIN ENTERPRISE PERFORMANCE MANAGEMENT MARKET BY DEPLOYMENT (USD BILLION) 2020-2029
TABLE 96 SPAIN ENTERPRISE PERFORMANCE MANAGEMENT MARKET BY PRODUCT (USD BILLION) 2020-2029
TABLE 97 SPAIN ENTERPRISE PERFORMANCE MANAGEMENT MARKET BY APPLICATION (USD BILLION) 2020-2029
TABLE 98 RUSSIA ENTERPRISE PERFORMANCE MANAGEMENT MARKET BY COMPONENT (USD BILLION) 2020-2029
TABLE 99 RUSSIA ENTERPRISE PERFORMANCE MANAGEMENT MARKET BY DEPLOYMENT (USD BILLION) 2020-2029
TABLE 100 RUSSIA ENTERPRISE PERFORMANCE MANAGEMENT MARKET BY PRODUCT (USD BILLION) 2020-2029
TABLE 101 RUSSIA ENTERPRISE PERFORMANCE MANAGEMENT MARKET BY APPLICATION (USD BILLION) 2020-2029
TABLE 102 REST OF EUROPE ENTERPRISE PERFORMANCE MANAGEMENT MARKET BY COMPONENT (USD BILLION) 2020-2029
TABLE 103 REST OF EUROPE ENTERPRISE PERFORMANCE MANAGEMENT MARKET BY DEPLOYMENT (USD BILLION) 2020-2029
TABLE 104 REST OF EUROPE ENTERPRISE PERFORMANCE MANAGEMENT MARKET BY PRODUCT (USD BILLION) 2020-2029
TABLE 105 REST OF EUROPE ENTERPRISE PERFORMANCE MANAGEMENT MARKET BY APPLICATION (USD BILLION) 2020-2029
TABLE 106 MIDDLE EAST AND AFRICA ENTERPRISE PERFORMANCE MANAGEMENT MARKET BY COUNTRY (USD BILLION) 2020-2029
TABLE 107 MIDDLE EAST AND AFRICA ENTERPRISE PERFORMANCE MANAGEMENT MARKET BY COMPONENT (USD BILLION) 2020-2029
TABLE 108 MIDDLE EAST AND AFRICA ENTERPRISE PERFORMANCE MANAGEMENT MARKET BY DEPLOYMENT (USD BILLION) 2020-2029
TABLE 109 MIDDLE EAST AND AFRICA ENTERPRISE PERFORMANCE MANAGEMENT MARKET BY PRODUCT (USD BILLION) 2020-2029
TABLE 110 MIDDLE EAST AND AFRICA ENTERPRISE PERFORMANCE MANAGEMENT MARKET BY APPLICATION (USD BILLION) 2020-2029
TABLE 111 UAE ENTERPRISE PERFORMANCE MANAGEMENT MARKET BY COMPONENT (USD BILLION) 2020-2029
TABLE 112 UAE ENTERPRISE PERFORMANCE MANAGEMENT MARKET BY DEPLOYMENT (USD BILLION) 2020-2029
TABLE 113 UAE ENTERPRISE PERFORMANCE MANAGEMENT MARKET BY PRODUCT (USD BILLION) 2020-2029
TABLE 114 UAE ENTERPRISE PERFORMANCE MANAGEMENT MARKET BY APPLICATION (USD BILLION) 2020-2029
TABLE 115 SAUDI ARABIA ENTERPRISE PERFORMANCE MANAGEMENT MARKET BY COMPONENT (USD BILLION) 2020-2029
TABLE 116 SAUDI ARABIA ENTERPRISE PERFORMANCE MANAGEMENT MARKET BY DEPLOYMENT (USD BILLION) 2020-2029
TABLE 117 SAUDI ARABIA ENTERPRISE PERFORMANCE MANAGEMENT MARKET BY PRODUCT (USD BILLION) 2020-2029
TABLE 118 SAUDI ARABIA ENTERPRISE PERFORMANCE MANAGEMENT MARKET BY APPLICATION (USD BILLION) 2020-2029
TABLE 119 SOUTH AFRICA ENTERPRISE PERFORMANCE MANAGEMENT MARKET BY COMPONENT (USD BILLION) 2020-2029
TABLE 120 SOUTH AFRICA ENTERPRISE PERFORMANCE MANAGEMENT MARKET BY DEPLOYMENT (USD BILLION) 2020-2029
TABLE 121 SOUTH AFRICA ENTERPRISE PERFORMANCE MANAGEMENT MARKET BY PRODUCT (USD BILLION) 2020-2029
TABLE 122 SOUTH AFRICA ENTERPRISE PERFORMANCE MANAGEMENT MARKET BY APPLICATION (USD BILLION) 2020-2029
TABLE 123 REST OF MIDDLE EAST AND AFRICA ENTERPRISE PERFORMANCE MANAGEMENT MARKET BY COMPONENT (USD BILLION) 2020-2029
TABLE 124 REST OF MIDDLE EAST AND AFRICA ENTERPRISE PERFORMANCE MANAGEMENT MARKET BY DEPLOYMENT (USD BILLION) 2020-2029
TABLE 125 REST OF MIDDLE EAST AND AFRICA ENTERPRISE PERFORMANCE MANAGEMENT MARKET BY PRODUCT (USD BILLION) 2020-2029
TABLE 126 REST OF MIDDLE EAST AND AFRICA ENTERPRISE PERFORMANCE MANAGEMENT MARKET BY APPLICATION (USD BILLION) 2020-2029
LIST OF FIGURES
FIGURE 1 MARKET DYNAMICS
FIGURE 2 MARKET SEGMENTATION
FIGURE 3 REPORT TIMELINES: YEARS CONSIDERED
FIGURE 4 DATA TRIANGULATION
FIGURE 5 BOTTOM-UP APPROACH
FIGURE 6 TOP-DOWN APPROACH
FIGURE 7 RESEARCH FLOW
FIGURE 8 GLOBAL ENTERPRISE PERFORMANCE MANAGEMENT BY COMPONENT, USD BILLON, 2020-2029
FIGURE 9 GLOBAL ENTERPRISE PERFORMANCE MANAGEMENT BY DEPLOYMENT, USD BILLON, 2020-2029
FIGURE 10 GLOBAL ENTERPRISE PERFORMANCE MANAGEMENT BY PRODUCT, USD BILLON, 2020-2029
FIGURE 11 GLOBAL ENTERPRISE PERFORMANCE MANAGEMENT BY APPLICATION, USD BILLON,2020-2029
FIGURE 12 GLOBAL ENTERPRISE PERFORMANCE MANAGEMENT BY REGION, USD BILLON, 2020-2029
FIGURE 13 PORTER’S FIVE FORCES MODEL
FIGURE 14 GLOBAL ENTERPRISE PERFORMANCE MANAGEMENT MARKET BY COMPONENT, USD BILLON, 2021
FIGURE 15 GLOBAL ENTERPRISE PERFORMANCE MANAGEMENT MARKET BY DEPLOYMENT, USD BILLON, 2021
FIGURE 16 GLOBAL ENTERPRISE PERFORMANCE MANAGEMENT MARKET BY PRODCT, USD BILLON, 2021
FIGURE 17 GLOBAL ENTERPRISE PERFORMANCE MANAGEMENT MARKET BY APPLICATION, USD BILLON, 2021
FIGURE 18 GLOBAL ENTERPRISE PERFORMANCE MANAGEMENT MARKET BY REGION 2021
FIGURE 19 MARKET SHARE ANALYSIS
FIGURE 20 ADAPTIVE INSDIGHTS INC.: COMPANY SNAPSHOT
FIGURE 21 ANAPLAN INC.: COMPANY SNAPSHOT
FIGURE 22 BOARD INTERNATIONAL S.A.: COMPANY SNAPSHOT
FIGURE 23 HOST ANALYTICS INC.: COMPANY SNAPSHOT
FIGURE 24 IBM: COMPANY SNAPSHOT
FIGURE 25 INFOR INC.: COMPANY SNAPSHOT
FIGURE 26 ORACLE: COMPANY SNAPSHOT
FIGURE 27 SAP SE: COMPANY SNAPSHOT
FIGURE 28 CCH TAGETIK (WOLTERS KLUWER NV): COMPANY SNAPSHOT
FIGURE 29 WORKIVA: COMPANY SNAPSHOT
FIGURE 30 UNICOM SYSTEMS: COMPANY SNAPSHOT
DOWNLOAD FREE SAMPLE REPORT
License Type
SPEAK WITH OUR ANALYST
Want to know more about the report or any specific requirement?
WANT TO CUSTOMIZE THE REPORT?
Our Clients Speak
We asked them to research ‘ Equipment market’ all over the world, and their whole arrangement was helpful to us. thehealthanalytics.com insightful analysis and reports contributed to our current analysis and in creating a future strategy. Besides, the te
Yosuke Mitsui
Senior Associate Construction Equipment Sales & Marketing
We asked them to research ‘Equipment market’ all over the world, and their whole arrangement was helpful to us. thehealthanalytics.com insightful analysis and reports contributed to our current analysis and in creating a future strategy. Besides, the te


