

Base Year Value ()
x.x %
x.x %
CAGR ()
x.x %
x.x %
Forecast Year Value ()
x.x %
x.x %
Historical Data Period
Largest Region
Forecast Period
Natural Fiber Composites Market by Type (Wood, Non-wood), by Manufacturing Process (Compression molding, Injection molding, Extrusion) by Application (Building and Construction, Automotive, Electronics and electricals) and Region, Global trends and forecast from 2022 to 2029
Instant access to hundreds of data points and trends
- Market estimates from 2014-2029
- Competitive analysis, industry segmentation, financial benchmarks
- Incorporates SWOT, Porter's Five Forces and risk management frameworks
- PDF report or online database with Word, Excel and PowerPoint export options
- 100% money back guarantee
Natural Fiber Composites Market Overview
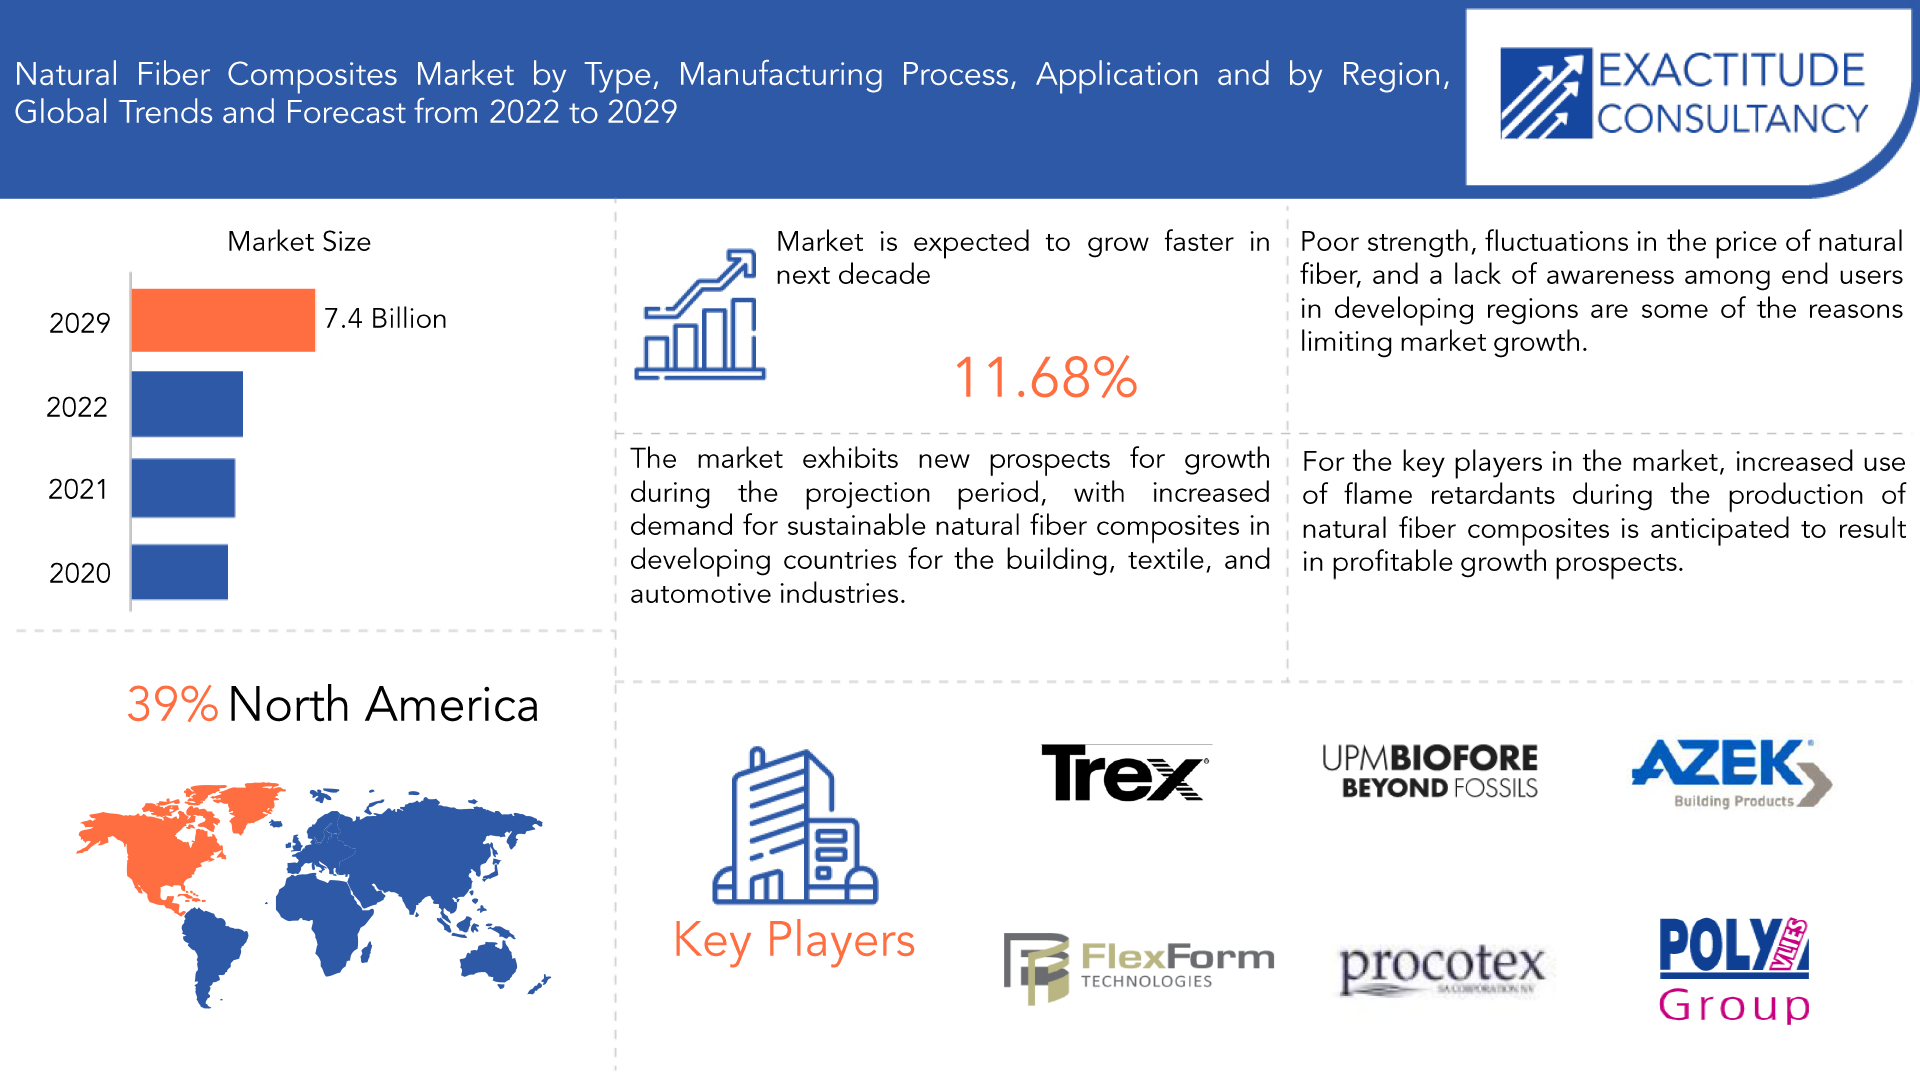
The Natural Fiber Composites Market is expected to grow at 11.68 % CAGR from 2022 to 2029. It is expected to reach above USD 7.4 USD billion by 2029 from USD 2.74 billion in 2020.
Composite materials made of natural fibers like flax, hemp, jute, sisal, and kenaf are known as natural fiber composites. Many products, including consumer items, building and construction materials, and automotive parts, all utilize these composites. Natural fiber composites are more environmentally friendly than conventional composites constructed of synthetic materials since they are renewable, biodegradable, and have a less carbon impact. Because of their environmentally friendly qualities, they are increasingly used as a substitute for synthetic fibers in many applications.
The thermal stability of natural fibers after chemical processing is superior to that of synthetic fibers. These treatments improve the natural fibers’ mechanical, thermal, and wettability properties. The chemical treatment also modifies the morphology, surface chemistry, and pore structure of the fiber. This process strengthens and increases the rigidity of natural fibers while also improving their attachment to the matrix. They are an efficient option for a variety of tasks, including developing roads and bridges as well as working in the aerospace and automotive industries.
| ATTRIBUTE | DETAILS |
| Study period | 2020-2029 |
| Base year | 2022 |
| Estimated year | 2022 |
| Forecasted year | 2022-2029 |
| Historical period | 2018-2020 |
| Unit | Value (USD Million), (KILOTONS) |
| Segmentation | by type, by Manufacturing Process, by application, by region |
| By Type |
|
| BY Manufacturing Process |
|
| By Application |
|
| By Region |
|
Due to the use and production of non-biodegradable synthetic fibers, environmental concerns are on the rise. Non-biodegradable composites are subject to stringent restrictions in regions like Europe and North America, which has led to the emergence of new economic prospects. The market exhibits new prospects for growth during the projection period, with increased demand for sustainable natural fiber composites in developing countries for the building, textile, and automotive industries. The demand for this market is therefore projected to rise throughout the forecast period. Compression molding, injection molding, and extrusion are three manufacturing Process where technological advancements are expected to positively affect growth. Nowadays, natural fibers have replaced glass and carbon fibers because they are more affordable and sustainable. Moreover, Europe and the Asia-Pacific area have an abundance of natural fibers, which supports the market's demand in these regions.
The automotive industry's increasing use of bio-based fiber composites is promoting market expansion. They are being produced as more and more electric car parts due to their lightweight qualities. Also, these composites can be used in floor panels, door panels, seat backs, under floor pans, headliners, and trunk liners in vehicles and trucks because of their competitive stiffness and strength to various synthetic fibers as well as their outstanding acoustic insulation properties.
Poor strength, fluctuations in the price of natural fiber, and a lack of awareness among end users in developing regions are some of the reasons limiting market growth. The expansion prospects are also anticipated to be hindered by characteristics of natural fiber composites such moisture sensitivity and weak bonding with polymer matrix. Studies have shown that when the natural fibers remove the moisture, the physical qualities, such as dimensional instability and glass transition temperature (g), and mechanical properties, such as flexural tensile fracture, and impact, are reduced. This is mostly caused by a decrease in the interfacial adhesion between the matrix and fiber. These moistures have the potential to cause voids to form in the composite matrix. This aspect is anticipated to limit market expansion.
For the key players in the market, increased use of flame retardants during the production of natural fiber composites is anticipated to result in profitable growth prospects. Examples of important flame retardants used in the production of natural fiber composites include ammonium polyphosphate , magnesium , zinc borate , and graphite. Other Kame retardant additions include nano clays, sodium meta silicate, phosphorous compounds, halloysite nanotubes, and others. Natural fiber composite is becoming more prevalent in the construction industry. It is anticipated to offer applications, particularly in civil engineering projects. Wood fiber composites, for example, can be used for fencing, decking, molding, trim. They require little maintenance and are resistant to stains, weathering, and warping.
The COVID-19 pandemic's effects on the natural fiber composites market have been conflicting. On the one hand, the epidemic has caused supply chains and production Process to be disrupted, which has hurt the market. On the other hand, the epidemic has also raised awareness of the value of environmentally friendly and sustainable materials, which has opened up new market potential for natural fiber composites. The market for natural fiber composites has slowed down as a result of the pandemic's effects on production Process and supply chains. This is owing to the fact that some composite industry businesses were forced to curtail their operations or close entirely as a result of limitations related to the epidemic. Further impacting the market, the pandemic has hampered the movement of raw materials and completed goods. The pandemic also created new opportunities as it led to focus on sustainability and eco-friendliness which created a demand for natural fiber composites.
[caption id="attachment_16947" align="aligncenter" width="1920"]
Frequently Asked Questions
• What is the worth of natural fiber composites market?
The Natural Fiber Composites market size is expected to reach above USD 7.4 USD billion by 2029 from USD 2.74 billion in 2020.
• What is the size of the North America natural fiber composites industry?
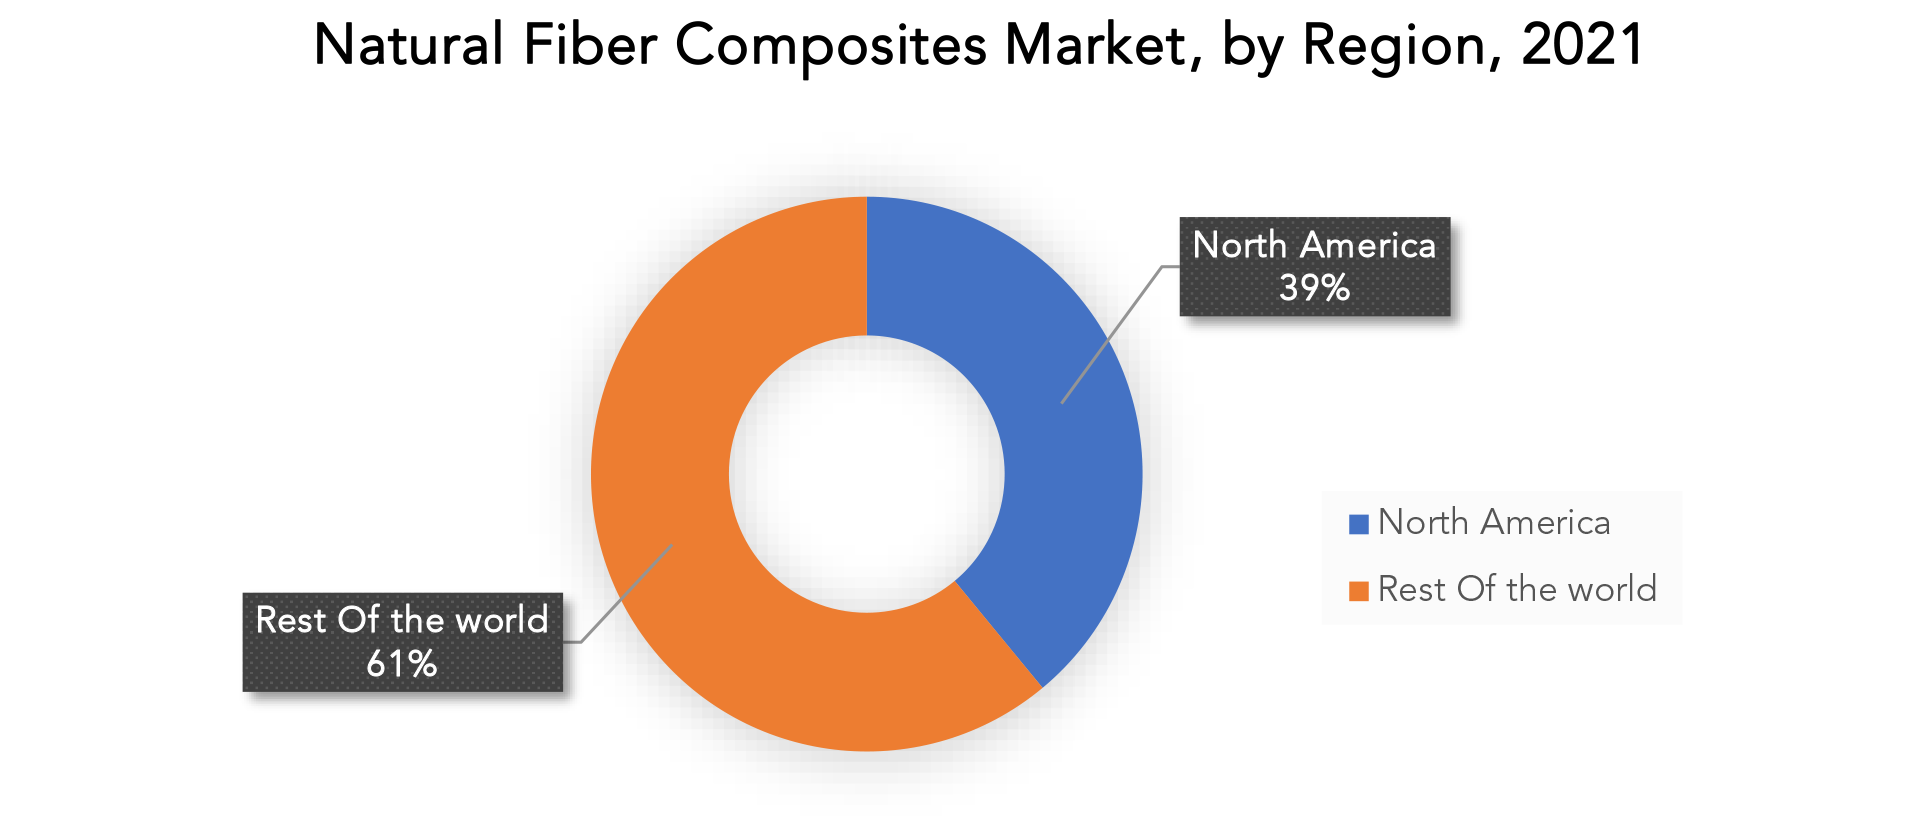
North America held more than 39% of the Natural Fiber Composites market revenue share in 2021 and will witness expansion in the forecast period.
• What are some of the market's driving forces?
The market exhibits new prospects for growth during the projection period, with increased demand for sustainable natural fiber composites in developing countries for the building, textile, and automotive industries
• Which are the top companies to hold the market share in natural fiber composites market?
The Natural Fiber Composites market key players include Trex Company Inc., UPM Biocomposites, The AZEK Company LLC, FlexForm Technologies LLC, GreenCore Composites, Green Dot Bioplastics Inc., Procotex Corp SA, Polyvlies Franz Beyer GmbH, Amorim Cork Composites SA, NPSP BV, Tecnaro Gmbh, and others.
• What is the leading application of natural fiber composites market?
Between the applications of natural fiber composites , it is mostly used in the automotive and construction industries. It is primarily utilized in the construction and automotive industries to make decking, railing, windows, frames, dashboards, truck liners, and door panels. The markets for sporting goods and electronics are both promising. Natural fiber composites are used to make a variety of goods, including snowboards, tennis rackets, bicycles, frames, and laptop and phone cases.
• Which is the largest regional market for natural fiber composites market?
The North America natural fiber composites market is expected to experience significant growth over the next several years, driven by increasing demand for sustainable and eco-friendly materials in various industries. Additionally, advancements in manufacturing Process and the development of new natural fiber composites are also expected to drive the growth in the market.
Natural Fiber Composites Market Segment Analysis
Natural fiber composites market is segmented into type, manufacturing process and application.
Based on the type, market is divided into wood and non-wood. The wood segment accounted for the largest market share. This is because wood fibers are the most commonly used natural fibers in the composite industry due to their abundance, low cost, and excellent mechanical properties. Wood-based natural fiber composites are used in a wide range of applications, including building and construction, automotive, furniture, and consumer goods.
Based on the manufacturing process, market is sub segmented into Compression molding, Injection molding and extrusion. Extrusion is the most common process and the segment is expected to dominate the market. Melting the polymer and then forcing it through a die to form the composite into the required shape is known as extrusion, which is a continuous manufacturing process. The final composite product is produced by extruding a mixture of natural fibers and molten polymer. This method is effective and may be used to create a variety of natural fiber composites, even ones with intricate shapes and dimensions.
Between the applications of natural fiber composites, it is mostly used in the automotive and construction industries. It is primarily utilized in the construction and automotive industries to make decking, railing, windows, frames, dashboards, truck liners, and door panels. The markets for sporting goods and electronics are both promising. Natural fiber composites are used to make a variety of goods, including snowboards, tennis rackets, bicycles, frames, and laptop and phone cases.
[caption id="attachment_16952" align="aligncenter" width="1920"]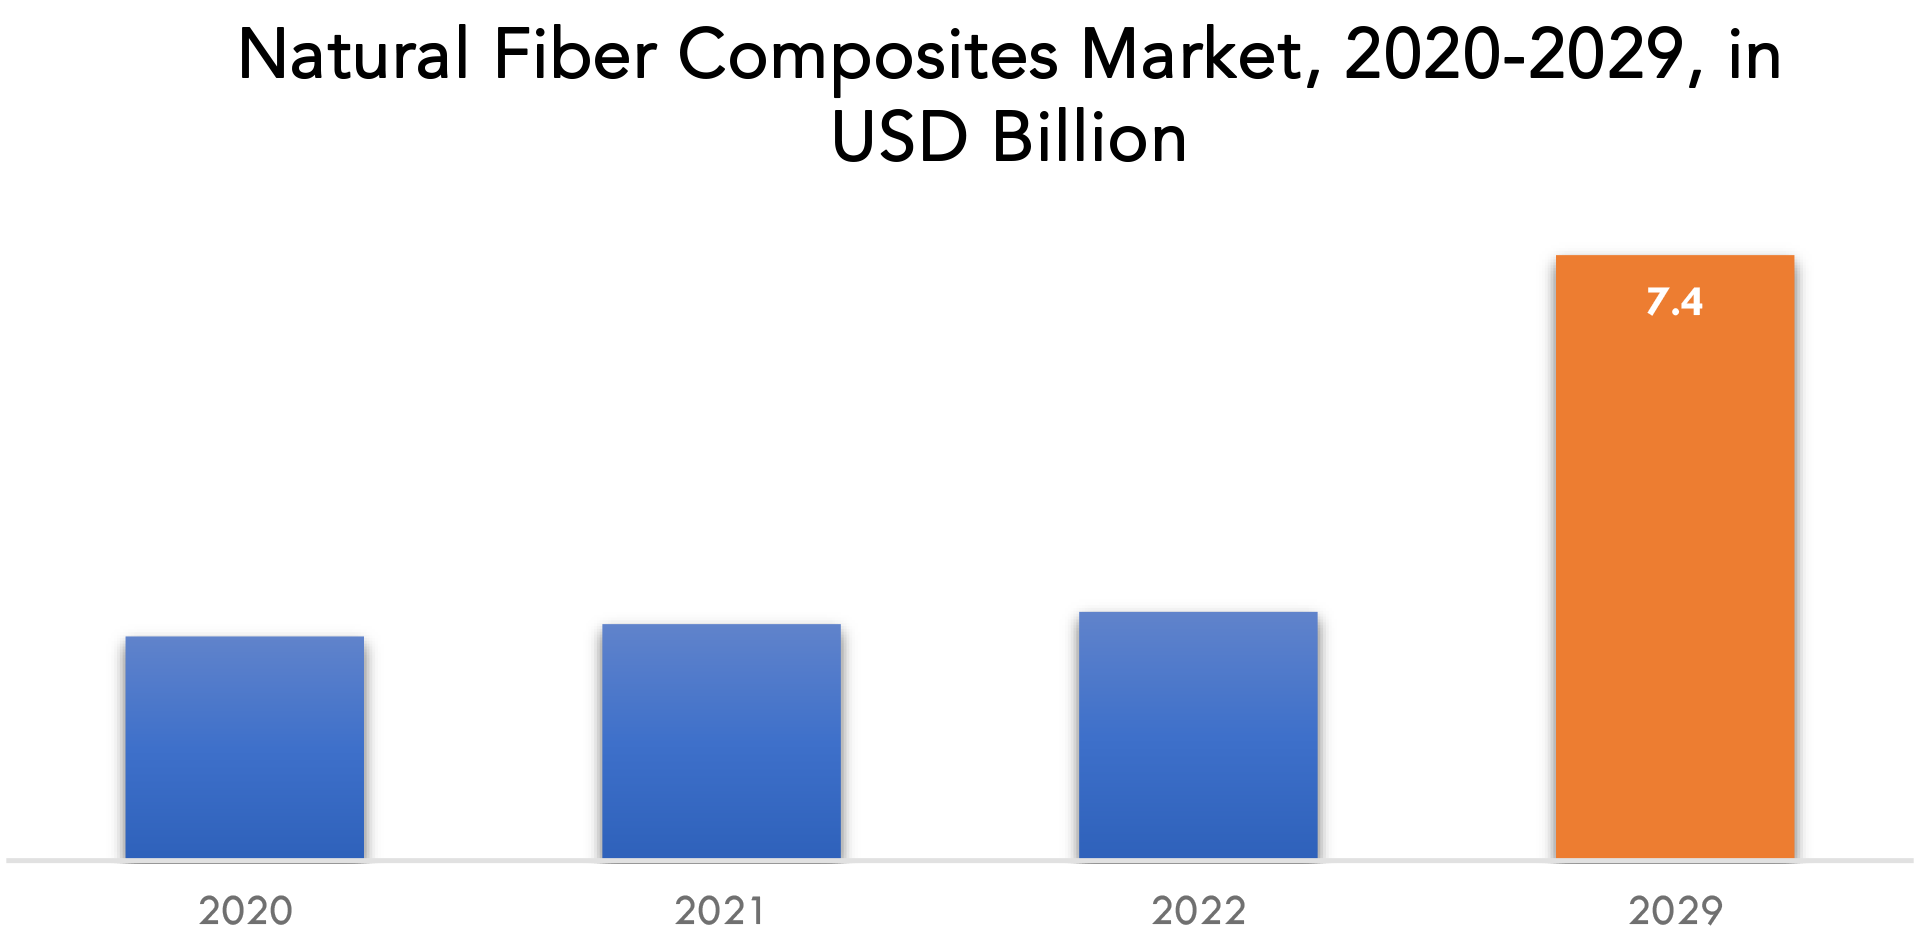
Natural Fiber Composites Market Players
The Natural Fiber Composites market key players include Trex Company Inc., UPM Biocomposites, The AZEK Company LLC, FlexForm Technologies LLC, GreenCore Composites, Green Dot Bioplastics Inc., Procotex Corp SA, Polyvlies Franz Beyer GmbH, Amorim Cork Composites SA, NPSP BV, Tecnaro Gmbh, and others. Recent Developments: October 31, 2022: Trex Teams with Goodwill to Repurpose Plastic Waste into Eco-friendly Composite Decking. Through a regional partnership between three independent Goodwill organizations – Goodwill of Delaware, Goodwill of the Chesapeake (serving Washington, D.C., Maryland and Northern Virginia) and Goodwill of Delaware County, PA – and Trex Company, the world’s largest manufacturer of wood-alternative decking and railing – Goodwill centers across these areas are serving as drop-off locations for recycling discarded plastics to be repurposed into high-performance Trex composite decking via the company’s NexTrex recycling initiative. July 22, 2022: Green Dot Bioplastics launched Expanded Line of Compostable Resins for Packaging and Single-Use Applications. Green Dot Bioplastics, a leading developer and supplier of bioplastic materials for innovative, sustainable end-uses, has expanded its Terratek BD line with nine new compostable grades that are targeted for single-use and packaging applications.Who Should Buy? Or Key stakeholders
- Natural Fiber Composites Suppliers
- Raw Materials Manufacturers
- Research Organizations
- Investors
- Regulatory Authorities
- Others
Natural Fiber Composites Market Regional Analysis
Natural Fiber Composites Market | Exactitude Consultancy [/caption]
The Natural Fiber Composites market by region includes North America, Asia-Pacific (APAC), Europe, South America, and Middle East & Africa (MEA).
- North America: includes the US, Canada, Mexico
- Asia Pacific: includes China, Japan, South Korea, India, Australia, ASEAN and Rest of APAC
- Europe: includes UK, Germany, France, Italy, Spain, Russia, and Rest of Europe
- South America: includes Brazil, Argentina and Rest of South America
- Middle East & Africa: includes Turkey, UAE, Saudi Arabia, South Africa, and Rest of MEA
The North America natural fiber composites market is expected to experience significant growth over the next several years, driven by increasing demand for sustainable and eco-friendly materials in various industries. Additionally, advancements in manufacturing Process and the development of new natural fiber composites are also expected to drive the growth in the market. Over the projected period, North America is anticipated to contribute 39% to the growth of the global market. The regional market is expanding due to the importance of the building sector. The North American market for natural fibre composites is dominated by the US and Canada.
The development of a natural polymer matrix for front and rear door lines, boot lines, and parcel shelves is the subject of intensive research by European automakers. One of Europe's top automakers and a significant importer of hemp is Germany. It is predicted that rising demand for biodegradable and lightweight goods from the automotive industry to improve fuel efficiency will fuel the country's growth.
Because of rising disposable income and rising standards of life, the sporting goods, electronics, and automotive industries in the Asia Pacific region are expected to rise at a strong rate in the future years. In the years to come, China is expected to maintain its dominance in the Asia Pacific market.
[caption id="attachment_16955" align="aligncenter" width="1920"] Key Market Segments: Natural Fiber Composites Market
Natural Fiber Composites Market By Type, 2020-2029, (Usd Billion), (Kilotons)- Wood
- Non-Wood
- Compression Molding
- Injection Molding
- Extrusion
- Building And Construction
- Automotive
- Electronics And Electricals
- North America
- Asia Pacific
- Europe
- South America
- Middle East And Africa
Exactitude Consultancy Services Key Objectives:
- Increasing sales and market share
- Developing new technology
- Improving profitability
- Entering new markets
- Enhancing brand reputation
Key Questions Answered:
- What is the expected growth rate of the natural fiber composites market over the next 7 years?
- Who are the major players in the natural fiber composites market and what is their market share?
- What are the end-user industries driving demand for market and what is their outlook?
- What are the opportunities for growth in emerging markets such as Asia-Pacific, Middle East, and Africa?
- How is the economic environment affecting the natural fiber composites market, including factors such as interest rates, inflation, and exchange rates?
- What is the expected impact of government policies and regulations on the natural fiber composites market?
- What is the current and forecasted size and growth rate of the global natural fiber composites market?
- What are the key drivers of growth in the natural fiber composites market?
- Who are the major players in the market and what is their market share?
- What are the distribution channels and supply chain dynamics in the natural fiber composites market?
- What are the technological advancements and innovations in the natural fiber composites market and their impact on product development and growth?
- What are the regulatory considerations and their impact on the market?
- What are the challenges faced by players in the natural fiber composites market and how are they addressing these challenges?
- What are the opportunities for growth and expansion in the natural fiber composites market?
- What are the product offerings/ service offerings and specifications of leading players in the market?
- What is the pricing trend of natural fiber composites in the market and what is the impact of raw material prices on the price trend?
- INTRODUCTION
- MARKET DEFINITION
- MARKET SEGMENTATION
- RESEARCH TIMELINES
- ASSUMPTIONS AND LIMITATIONS
- RESEARCH METHODOLOGY
- DATA MINING
- SECONDARY RESEARCH
- PRIMARY RESEARCH
- SUBJECT-MATTER EXPERTS’ ADVICE
- QUALITY CHECKS
- FINAL REVIEW
- DATA TRIANGULATION
- BOTTOM-UP APPROACH
- TOP-DOWN APPROACH
- RESEARCH FLOW
- DATA SOURCES
- DATA MINING
- EXECUTIVE SUMMARY
- MARKET OVERVIEW
- GLOBAL NATURAL FIBER COMPOSITES MARKET OUTLOOK
- MARKET DRIVERS
- MARKET RESTRAINTS
- MARKET OPPORTUNITIES
- IMPACT OF COVID-19 ON NATURAL FIBER COMPOSITES MARKET
- PORTER’S FIVE FORCES MODEL
- THREAT FROM NEW ENTRANTS
- THREAT FROM SUBSTITUTES
- BARGAINING POWER OF SUPPLIERS
- BARGAINING POWER OF CUSTOMERS
- DEGREE OF COMPETITION
- INDUSTRY VALUE CHAIN ANALYSIS
- GLOBAL NATURAL FIBER COMPOSITES MARKET OUTLOOK
- GLOBAL NATURAL FIBER COMPOSITES MARKET BY TYPE, (USD BILLION, KILOTONS)
- WOOD
- NON-WOOD
- GLOBAL NATURAL FIBER COMPOSITES MARKET BY MANUFACTURING PROCESS, (USD BILLION, KILOTONS)
- COMPRESSION MOLDING
- INJECTION MOLDING
- EXTRUSION
- GLOBAL NATURAL FIBER COMPOSITES MARKET BY APPLICATION, (USD BILLION, KILOTONS)
- BUILDING AND CONSTRUCTION
- AUTOMOTIVE
- ELECTRONICS AND ELECTRICALS
- GLOBAL NATURAL FIBER COMPOSITES MARKET BY REGION, (USD BILLION, KILOTONS)
- NORTH AMERICA
- US
- CANADA
- MEXICO
- SOUTH AMERICA
- BRAZIL
- ARGENTINA
- COLOMBIA
- REST OF SOUTH AMERICA
- EUROPE
- GERMANY
- UK
- FRANCE
- ITALY
- SPAIN
- RUSSIA
- REST OF EUROPE
- ASIA PACIFIC
- INDIA
- CHINA
- JAPAN
- SOUTH KOREA
- AUSTRALIA
- SOUTH-EAST ASIA
- REST OF ASIA PACIFIC
- MIDDLE EAST AND AFRICA
- UAE
- SAUDI ARABIA
- SOUTH AFRICA
- REST OF MIDDLE EAST AND AFRICA
- NORTH AMERICA
- COMPANY PROFILES* (BUSINESS OVERVIEW, COMPANY SNAPSHOT, PRODUCTS OFFERED, RECENT DEVELOPMENTS)
- TREX COMPANY INC.
- UPM BIO COMPOSITES
- THE AZEK COMPANY LLC
- FLEXFORM TECHNOLOGIES LLC
- GREENCORE COMPOSITES
- GREEN DOT BIOPLASTICS INC.
- PROCOTEX CORP SA
- POLYVLIES FRANZ BEYER GMBH
- AMORIM CORK COMPOSITES SA
- NPSP BV
- TECNARO GMBH *THE COMPANY LIST IS INDICATIVE
LIST OF TABLES
TABLE 1 GLOBAL NATURAL FIBER COMPOSITES MARKET BY TYPE (USD BILLION), 2020-2029
TABLE 2 GLOBAL NATURAL FIBER COMPOSITES MARKET BY TYPE (KILOTONS), 2020-2029
TABLE 3 GLOBAL NATURAL FIBER COMPOSITES MARKET BY MANUFACTURING PROCESS (USD BILLION), 2020-2029
TABLE 4 GLOBAL NATURAL FIBER COMPOSITES MARKET BY MANUFACTURING PROCESS (KILOTONS), 2020-2029
TABLE 5 GLOBAL NATURAL FIBER COMPOSITES MARKET BY APPLICATION (USD BILLION), 2020-2029
TABLE 6 GLOBAL NATURAL FIBER COMPOSITES MARKET BY APPLICATION (KILOTONS), 2020-2029
TABLE 7 GLOBAL NATURAL FIBER COMPOSITES MARKET BY REGION (USD BILLION), 2020-2029
TABLE 8 GLOBAL NATURAL FIBER COMPOSITES MARKET BY REGION (KILOTONS), 2020-2029
TABLE 9 NORTH AMERICA NATURAL FIBER COMPOSITES MARKET BY TYPE (USD BILLION), 2020-2029
TABLE 10 NORTH AMERICA NATURAL FIBER COMPOSITES MARKET BY TYPE (KILOTONS), 2020-2029
TABLE 11 NORTH AMERICA NATURAL FIBER COMPOSITES MARKET BY MANUFACTURING PROCESS (USD BILLION), 2020-2029
TABLE 12 NORTH AMERICA NATURAL FIBER COMPOSITES MARKET BY MANUFACTURING PROCESS (KILOTONS), 2020-2029
TABLE 13 NORTH AMERICA NATURAL FIBER COMPOSITES MARKET BY APPLICATION (USD BILLION), 2020-2029
TABLE 14 NORTH AMERICA NATURAL FIBER COMPOSITES MARKET BY APPLICATION (KILOTONS), 2020-2029
TABLE 15 NORTH AMERICA NATURAL FIBER COMPOSITES MARKET BY COUNTRY (USD BILLION), 2020-2029
TABLE 16 NORTH AMERICA NATURAL FIBER COMPOSITES MARKET BY COUNTRY (KILOTONS), 2020-2029
TABLE 17 US NATURAL FIBER COMPOSITES MARKET BY TYPE (USD BILLION), 2020-2029
TABLE 18 US NATURAL FIBER COMPOSITES MARKET BY TYPE (KILOTONS), 2020-2029
TABLE 19 US NATURAL FIBER COMPOSITES MARKET BY MANUFACTURING PROCESS (USD BILLION), 2020-2029
TABLE 20 US NATURAL FIBER COMPOSITES MARKET BY MANUFACTURING PROCESS (KILOTONS), 2020-2029
TABLE 21 US NATURAL FIBER COMPOSITES MARKET BY APPLICATION (USD BILLION), 2020-2029
TABLE 22 US NATURAL FIBER COMPOSITES MARKET BY APPLICATION (KILOTONS), 2020-2029
TABLE 23 CANADA NATURAL FIBER COMPOSITES MARKET BY TYPE (BILLION), 2020-2029
TABLE 24 CANADA NATURAL FIBER COMPOSITES MARKET BY TYPE (KILOTONS), 2020-2029
TABLE 25 CANADA NATURAL FIBER COMPOSITES MARKET BY MANUFACTURING PROCESS (USD BILLION), 2020-2029
TABLE 26 CANADA NATURAL FIBER COMPOSITES MARKET BY MANUFACTURING PROCESS (KILOTONS), 2020-2029
TABLE 27 CANADA NATURAL FIBER COMPOSITES MARKET BY APPLICATION (USD BILLION), 2020-2029
TABLE 28 CANADA NATURAL FIBER COMPOSITES MARKET BY APPLICATION (KILOTONS), 2020-2029
TABLE 29 MEXICO NATURAL FIBER COMPOSITES MARKET BY TYPE (USD BILLION), 2020-2029
TABLE 30 MEXICO NATURAL FIBER COMPOSITES MARKET BY TYPE (KILOTONS), 2020-2029
TABLE 31 MEXICO NATURAL FIBER COMPOSITES MARKET BY MANUFACTURING PROCESS (USD BILLION), 2020-2029
TABLE 32 MEXICO NATURAL FIBER COMPOSITES MARKET BY MANUFACTURING PROCESS (KILOTONS), 2020-2029
TABLE 33 MEXICO NATURAL FIBER COMPOSITES MARKET BY APPLICATION (USD BILLION), 2020-2029
TABLE 34 MEXICO NATURAL FIBER COMPOSITES MARKET BY APPLICATION (KILOTONS), 2020-2029
TABLE 35 SOUTH AMERICA NATURAL FIBER COMPOSITES MARKET BY TYPE (USD BILLION), 2020-2029
TABLE 36 SOUTH AMERICA NATURAL FIBER COMPOSITES MARKET BY TYPE (KILOTONS), 2020-2029
TABLE 37 SOUTH AMERICA NATURAL FIBER COMPOSITES MARKET BY MANUFACTURING PROCESS (USD BILLION), 2020-2029
TABLE 38 SOUTH AMERICA NATURAL FIBER COMPOSITES MARKET BY MANUFACTURING PROCESS (KILOTONS), 2020-2029
TABLE 39 SOUTH AMERICA NATURAL FIBER COMPOSITES MARKET BY APPLICATION (USD BILLION), 2020-2029
TABLE 40 SOUTH AMERICA NATURAL FIBER COMPOSITES MARKET BY APPLICATION (KILOTONS), 2020-2029
TABLE 41 SOUTH AMERICA NATURAL FIBER COMPOSITES MARKET BY COUNTRY (USD BILLION), 2020-2029
TABLE 42 SOUTH AMERICA NATURAL FIBER COMPOSITES MARKET BY COUNTRY (KILOTONS), 2020-2029
TABLE 43 BRAZIL NATURAL FIBER COMPOSITES MARKET BY TYPE (USD BILLION), 2020-2029
TABLE 44 BRAZIL NATURAL FIBER COMPOSITES MARKET BY TYPE (KILOTONS), 2020-2029
TABLE 45 BRAZIL NATURAL FIBER COMPOSITES MARKET BY MANUFACTURING PROCESS (USD BILLION), 2020-2029
TABLE 46 BRAZIL NATURAL FIBER COMPOSITES MARKET BY MANUFACTURING PROCESS (KILOTONS), 2020-2029
TABLE 47 BRAZIL NATURAL FIBER COMPOSITES MARKET BY APPLICATION (USD BILLION), 2020-2029
TABLE 48 BRAZIL NATURAL FIBER COMPOSITES MARKET BY APPLICATION (KILOTONS), 2020-2029
TABLE 49 ARGENTINA NATURAL FIBER COMPOSITES MARKET BY TYPE (USD BILLION), 2020-2029
TABLE 50 ARGENTINA NATURAL FIBER COMPOSITES MARKET BY TYPE (KILOTONS), 2020-2029
TABLE 51 ARGENTINA NATURAL FIBER COMPOSITES MARKET BY MANUFACTURING PROCESS (USD BILLION), 2020-2029
TABLE 52 ARGENTINA NATURAL FIBER COMPOSITES MARKET BY MANUFACTURING PROCESS (KILOTONS), 2020-2029
TABLE 53 ARGENTINA NATURAL FIBER COMPOSITES MARKET BY APPLICATION (USD BILLION), 2020-2029
TABLE 54 ARGENTINA NATURAL FIBER COMPOSITES MARKET BY APPLICATION (KILOTONS), 2020-2029
TABLE 55 COLOMBIA NATURAL FIBER COMPOSITES MARKET BY TYPE (USD BILLION), 2020-2029
TABLE 56 COLOMBIA NATURAL FIBER COMPOSITES MARKET BY TYPE (KILOTONS), 2020-2029
TABLE 57 COLOMBIA NATURAL FIBER COMPOSITES MARKET BY MANUFACTURING PROCESS (USD BILLION), 2020-2029
TABLE 58 COLOMBIA NATURAL FIBER COMPOSITES MARKET BY MANUFACTURING PROCESS (KILOTONS), 2020-2029
TABLE 59 COLOMBIA NATURAL FIBER COMPOSITES MARKET BY APPLICATION (USD BILLION), 2020-2029
TABLE 60 COLOMBIA NATURAL FIBER COMPOSITES MARKET BY APPLICATION (KILOTONS), 2020-2029
TABLE 61 REST OF SOUTH AMERICA NATURAL FIBER COMPOSITES MARKET BY TYPE (USD BILLION), 2020-2029
TABLE 62 REST OF SOUTH AMERICA NATURAL FIBER COMPOSITES MARKET BY TYPE (KILOTONS), 2020-2029
TABLE 63 REST OF SOUTH AMERICA NATURAL FIBER COMPOSITES MARKET BY MANUFACTURING PROCESS (USD BILLION), 2020-2029
TABLE 64 REST OF SOUTH AMERICA NATURAL FIBER COMPOSITES MARKET BY MANUFACTURING PROCESS (KILOTONS), 2020-2029
TABLE 65 REST OF SOUTH AMERICA NATURAL FIBER COMPOSITES MARKET BY APPLICATION (USD BILLION), 2020-2029
TABLE 66 REST OF SOUTH AMERICA NATURAL FIBER COMPOSITES MARKET BY APPLICATION (KILOTONS), 2020-2029
TABLE 67 ASIA-PACIFIC NATURAL FIBER COMPOSITES MARKET BY TYPE (USD BILLION), 2020-2029
TABLE 68 ASIA-PACIFIC NATURAL FIBER COMPOSITES MARKET BY TYPE (KILOTONS), 2020-2029
TABLE 69 ASIA-PACIFIC NATURAL FIBER COMPOSITES MARKET BY MANUFACTURING PROCESS (USD BILLION), 2020-2029
TABLE 70 ASIA-PACIFIC NATURAL FIBER COMPOSITES MARKET BY MANUFACTURING PROCESS (KILOTONS), 2020-2029
TABLE 71 ASIA-PACIFIC NATURAL FIBER COMPOSITES MARKET BY APPLICATION (USD BILLION), 2020-2029
TABLE 72 ASIA-PACIFIC NATURAL FIBER COMPOSITES MARKET BY APPLICATION (KILOTONS), 2020-2029
TABLE 73 ASIA-PACIFIC NATURAL FIBER COMPOSITES MARKET BY COUNTRY (USD BILLION), 2020-2029
TABLE 74 ASIA-PACIFIC NATURAL FIBER COMPOSITES MARKET BY COUNTRY (KILOTONS), 2020-2029
TABLE 75 INDIA NATURAL FIBER COMPOSITES MARKET BY TYPE (USD BILLION), 2020-2029
TABLE 76 INDIA NATURAL FIBER COMPOSITES MARKET BY TYPE (KILOTONS), 2020-2029
TABLE 77 INDIA NATURAL FIBER COMPOSITES MARKET BY MANUFACTURING PROCESS (USD BILLION), 2020-2029
TABLE 78 INDIA NATURAL FIBER COMPOSITES MARKET BY MANUFACTURING PROCESS (KILOTONS), 2020-2029
TABLE 79 INDIA NATURAL FIBER COMPOSITES MARKET BY APPLICATION (USD BILLION), 2020-2029
TABLE 80 INDIA NATURAL FIBER COMPOSITES MARKET BY APPLICATION (KILOTONS), 2020-2029
TABLE 81 CHINA NATURAL FIBER COMPOSITES MARKET BY TYPE (USD BILLION), 2020-2029
TABLE 82 CHINA NATURAL FIBER COMPOSITES MARKET BY TYPE (KILOTONS), 2020-2029
TABLE 83 CHINA NATURAL FIBER COMPOSITES MARKET BY MANUFACTURING PROCESS (USD BILLION), 2020-2029
TABLE 84 CHINA NATURAL FIBER COMPOSITES MARKET BY MANUFACTURING PROCESS (KILOTONS), 2020-2029
TABLE 85 CHINA NATURAL FIBER COMPOSITES MARKET BY APPLICATION (USD BILLION), 2020-2029
TABLE 86 CHINA NATURAL FIBER COMPOSITES MARKET BY APPLICATION (KILOTONS), 2020-2029
TABLE 87 JAPAN NATURAL FIBER COMPOSITES MARKET BY TYPE (USD BILLION), 2020-2029
TABLE 88 JAPAN NATURAL FIBER COMPOSITES MARKET BY TYPE (KILOTONS), 2020-2029
TABLE 89 JAPAN NATURAL FIBER COMPOSITES MARKET BY MANUFACTURING PROCESS (USD BILLION), 2020-2029
TABLE 90 JAPAN NATURAL FIBER COMPOSITES MARKET BY MANUFACTURING PROCESS (KILOTONS), 2020-2029
TABLE 91 JAPAN NATURAL FIBER COMPOSITES MARKET BY APPLICATION (USD BILLION), 2020-2029
TABLE 92 JAPAN NATURAL FIBER COMPOSITES MARKET BY APPLICATION (KILOTONS), 2020-2029
TABLE 93 SOUTH KOREA NATURAL FIBER COMPOSITES MARKET BY TYPE (USD BILLION), 2020-2029
TABLE 94 SOUTH KOREA NATURAL FIBER COMPOSITES MARKET BY TYPE (KILOTONS), 2020-2029
TABLE 95 SOUTH KOREA NATURAL FIBER COMPOSITES MARKET BY MANUFACTURING PROCESS (USD BILLION), 2020-2029
TABLE 96 SOUTH KOREA NATURAL FIBER COMPOSITES MARKET BY MANUFACTURING PROCESS (KILOTONS), 2020-2029
TABLE 97 SOUTH KOREA NATURAL FIBER COMPOSITES MARKET BY APPLICATION (USD BILLION), 2020-2029
TABLE 98 SOUTH KOREA NATURAL FIBER COMPOSITES MARKET BY APPLICATION (KILOTONS), 2020-2029
TABLE 99 AUSTRALIA NATURAL FIBER COMPOSITES MARKET BY TYPE (USD BILLION), 2020-2029
TABLE 100 AUSTRALIA NATURAL FIBER COMPOSITESBY TYPE (KILOTONS), 2020-2029
TABLE 101 AUSTRALIA NATURAL FIBER COMPOSITES MARKET BY MANUFACTURING PROCESS (USD BILLION), 2020-2029
TABLE 102 AUSTRALIA NATURAL FIBER COMPOSITES MARKET BY MANUFACTURING PROCESS (KILOTONS), 2020-2029
TABLE 103 AUSTRALIA NATURAL FIBER COMPOSITES MARKET BY APPLICATION (USD BILLION), 2020-2029
TABLE 104 AUSTRALIA NATURAL FIBER COMPOSITES MARKET BY APPLICATION (KILOTONS), 2020-2029
TABLE 105 SOUTH EAST ASIA NATURAL FIBER COMPOSITES MARKET BY TYPE (USD BILLION), 2020-2029
TABLE 106 SOUTH EAST ASIA NATURAL FIBER COMPOSITESBY TYPE (KILOTONS), 2020-2029
TABLE 107 SOUTH EAST ASIA NATURAL FIBER COMPOSITES MARKET BY MANUFACTURING PROCESS (USD BILLION), 2020-2029
TABLE 108 SOUTH EAST ASIA NATURAL FIBER COMPOSITES MARKET BY MANUFACTURING PROCESS (KILOTONS), 2020-2029
TABLE 109 SOUTH EAST ASIA NATURAL FIBER COMPOSITES MARKET BY APPLICATION (USD BILLION), 2020-2029
TABLE 110 SOUTH EAST ASIA NATURAL FIBER COMPOSITES MARKET BY APPLICATION (KILOTONS), 2020-2029
TABLE 111 REST OF ASIA PACIFIC NATURAL FIBER COMPOSITES MARKET BY TYPE (USD BILLION), 2020-2029
TABLE 112 REST OF ASIA PACIFIC NATURAL FIBER COMPOSITESBY TYPE (KILOTONS), 2020-2029
TABLE 113 REST OF ASIA PACIFIC NATURAL FIBER COMPOSITES MARKET BY MANUFACTURING PROCESS (USD BILLION), 2020-2029
TABLE 114 REST OF ASIA PACIFIC NATURAL FIBER COMPOSITES MARKET BY MANUFACTURING PROCESS (KILOTONS), 2020-2029
TABLE 115 REST OF ASIA PACIFIC NATURAL FIBER COMPOSITES MARKET BY APPLICATION (USD BILLION), 2020-2029
TABLE 116 REST OF ASIA PACIFIC NATURAL FIBER COMPOSITES MARKET BY APPLICATION (KILOTONS), 2020-2029
TABLE 117 EUROPE NATURAL FIBER COMPOSITES MARKET BY TYPE (USD BILLION), 2020-2029
TABLE 118 EUROPE NATURAL FIBER COMPOSITES MARKET BY TYPE (KILOTONS), 2020-2029
TABLE 119 EUROPE NATURAL FIBER COMPOSITES MARKET BY MANUFACTURING PROCESS (USD BILLION), 2020-2029
TABLE 120 EUROPE NATURAL FIBER COMPOSITES MARKET BY MANUFACTURING PROCESS (KILOTONS), 2020-2029
TABLE 121 EUROPE NATURAL FIBER COMPOSITES MARKET BY APPLICATION (USD BILLION), 2020-2029
TABLE 122 EUROPE NATURAL FIBER COMPOSITES MARKET BY APPLICATION (KILOTONS), 2020-2029
TABLE 123 EUROPE NATURAL FIBER COMPOSITES MARKET BY COUNTRY (USD BILLION), 2020-2029
TABLE 124 EUROPE NATURAL FIBER COMPOSITES MARKET BY COUNTRY (KILOTONS), 2020-2029
TABLE 125 GERMANY NATURAL FIBER COMPOSITES MARKET BY TYPE (USD BILLION), 2020-2029
TABLE 126 GERMANY NATURAL FIBER COMPOSITES MARKET BY TYPE (KILOTONS), 2020-2029
TABLE 127 GERMANY NATURAL FIBER COMPOSITES MARKET BY MANUFACTURING PROCESS (USD BILLION), 2020-2029
TABLE 128 GERMANY NATURAL FIBER COMPOSITES MARKET BY MANUFACTURING PROCESS (KILOTONS), 2020-2029
TABLE 129 GERMANY NATURAL FIBER COMPOSITES MARKET BY APPLICATION (USD BILLION), 2020-2029
TABLE 130 GERMANY NATURAL FIBER COMPOSITES MARKET BY APPLICATION (KILOTONS), 2020-2029
TABLE 131 UK NATURAL FIBER COMPOSITES MARKET BY TYPE (USD BILLION), 2020-2029
TABLE 132 UK NATURAL FIBER COMPOSITES MARKET BY TYPE (KILOTONS), 2020-2029
TABLE 133 UK NATURAL FIBER COMPOSITES MARKET BY MANUFACTURING PROCESS (USD BILLION), 2020-2029
TABLE 134 UK NATURAL FIBER COMPOSITES MARKET BY MANUFACTURING PROCESS (KILOTONS), 2020-2029
TABLE 135 UK NATURAL FIBER COMPOSITES MARKET BY APPLICATION (USD BILLION), 2020-2029
TABLE 136 UK NATURAL FIBER COMPOSITES MARKET BY APPLICATION (KILOTONS), 2020-2029
TABLE 137 FRANCE NATURAL FIBER COMPOSITES MARKET BY TYPE (USD BILLION), 2020-2029
TABLE 138 FRANCE NATURAL FIBER COMPOSITES MARKET BY TYPE (KILOTONS), 2020-2029
TABLE 139 FRANCE NATURAL FIBER COMPOSITES MARKET BY MANUFACTURING PROCESS (USD BILLION), 2020-2029
TABLE 140 FRANCE NATURAL FIBER COMPOSITES MARKET BY MANUFACTURING PROCESS (KILOTONS), 2020-2029
TABLE 141 FRANCE NATURAL FIBER COMPOSITES MARKET BY APPLICATION (USD BILLION), 2020-2029
TABLE 142 FRANCE NATURAL FIBER COMPOSITES MARKET BY APPLICATION (KILOTONS), 2020-2029
TABLE 143 ITALY NATURAL FIBER COMPOSITES MARKET BY TYPE (USD BILLION), 2020-2029
TABLE 144 ITALY NATURAL FIBER COMPOSITES MARKET BY TYPE (KILOTONS), 2020-2029
TABLE 145 ITALY NATURAL FIBER COMPOSITES MARKET BY MANUFACTURING PROCESS (USD BILLION), 2020-2029
TABLE 146 ITALY NATURAL FIBER COMPOSITES MARKET BY MANUFACTURING PROCESS (KILOTONS), 2020-2029
TABLE 147 ITALY NATURAL FIBER COMPOSITES MARKET BY APPLICATION (USD BILLION), 2020-2029
TABLE 148 ITALY NATURAL FIBER COMPOSITES MARKET BY APPLICATION (KILOTONS), 2020-2029
TABLE 149 SPAIN NATURAL FIBER COMPOSITES MARKET BY TYPE (USD BILLION), 2020-2029
TABLE 150 SPAIN NATURAL FIBER COMPOSITES MARKET BY TYPE (KILOTONS), 2020-2029
TABLE 151 SPAIN NATURAL FIBER COMPOSITES MARKET BY MANUFACTURING PROCESS (USD BILLION), 2020-2029
TABLE 152 SPAIN NATURAL FIBER COMPOSITES MARKET BY MANUFACTURING PROCESS (KILOTONS), 2020-2029
TABLE 153 SPAIN NATURAL FIBER COMPOSITES MARKET BY APPLICATION (USD BILLION), 2020-2029
TABLE 154 SPAIN NATURAL FIBER COMPOSITES MARKET BY APPLICATION (KILOTONS), 2020-2029
TABLE 155 RUSSIA NATURAL FIBER COMPOSITES MARKET BY TYPE (USD BILLION), 2020-2029
TABLE 156 RUSSIA NATURAL FIBER COMPOSITES MARKET BY TYPE (KILOTONS), 2020-2029
TABLE 157 RUSSIA NATURAL FIBER COMPOSITES MARKET BY MANUFACTURING PROCESS (USD BILLION), 2020-2029
TABLE 158 RUSSIA NATURAL FIBER COMPOSITES MARKET BY MANUFACTURING PROCESS (KILOTONS), 2020-2029
TABLE 159 RUSSIA NATURAL FIBER COMPOSITES MARKET BY APPLICATION (USD BILLION), 2020-2029
TABLE 160 RUSSIA NATURAL FIBER COMPOSITES MARKET BY APPLICATION (KILOTONS), 2020-2029
TABLE 161 REST OF EUROPE NATURAL FIBER COMPOSITES MARKET BY TYPE (USD BILLION), 2020-2029
TABLE 162 REST OF EUROPE NATURAL FIBER COMPOSITES MARKET BY TYPE (KILOTONS), 2020-2029
TABLE 163 REST OF EUROPE NATURAL FIBER COMPOSITES MARKET BY MANUFACTURING PROCESS (USD BILLION), 2020-2029
TABLE 164 REST OF EUROPE NATURAL FIBER COMPOSITES MARKET BY MANUFACTURING PROCESS (KILOTONS), 2020-2029
TABLE 165 REST OF EUROPE NATURAL FIBER COMPOSITES MARKET BY APPLICATION (USD BILLION), 2020-2029
TABLE 166 REST OF EUROPE NATURAL FIBER COMPOSITES MARKET BY APPLICATION (KILOTONS), 2020-2029
TABLE 167 MIDDLE EAST AND AFRICA NATURAL FIBER COMPOSITES MARKET BY TYPE (USD BILLION), 2020-2029
TABLE 168 MIDDLE EAST AND AFRICA NATURAL FIBER COMPOSITES MARKET BY TYPE (KILOTONS), 2020-2029
TABLE 169 MIDDLE EAST AND AFRICA NATURAL FIBER COMPOSITES MARKET BY MANUFACTURING PROCESS (USD BILLION), 2020-2029
TABLE 170 MIDDLE EAST AND AFRICA NATURAL FIBER COMPOSITES MARKET BY MANUFACTURING PROCESS (KILOTONS), 2020-2029
TABLE 171 MIDDLE EAST AND AFRICA NATURAL FIBER COMPOSITES MARKET BY APPLICATION (USD BILLION), 2020-2029
TABLE 172 MIDDLE EAST AND AFRICA NATURAL FIBER COMPOSITES MARKET BY APPLICATION (KILOTONS), 2020-2029
TABLE 173 MIDDLE EAST AND AFRICA NATURAL FIBER COMPOSITES MARKET BY COUNTRY (USD BILLION), 2020-2029
TABLE 174 MIDDLE EAST AND AFRICA NATURAL FIBER COMPOSITES MARKET BY COUNTRY (KILOTONS), 2020-2029
TABLE 175 UAE NATURAL FIBER COMPOSITES MARKET BY TYPE (USD BILLION), 2020-2029
TABLE 176 UAE NATURAL FIBER COMPOSITES MARKET BY TYPE (KILOTONS), 2020-2029
TABLE 177 UAE NATURAL FIBER COMPOSITES MARKET BY MANUFACTURING PROCESS (USD BILLION), 2020-2029
TABLE 178 UAE NATURAL FIBER COMPOSITES MARKET BY MANUFACTURING PROCESS (KILOTONS), 2020-2029
TABLE 179 UAE NATURAL FIBER COMPOSITES MARKET BY APPLICATION (USD BILLION), 2020-2029
TABLE 180 UAE NATURAL FIBER COMPOSITES MARKET BY APPLICATION (KILOTONS), 2020-2029
TABLE 181 SAUDI ARABIA NATURAL FIBER COMPOSITES MARKET BY TYPE (USD BILLION), 2020-2029
TABLE 182 SAUDI ARABIA NATURAL FIBER COMPOSITES MARKET BY TYPE (KILOTONS), 2020-2029
TABLE 183 SAUDI ARABIA NATURAL FIBER COMPOSITES MARKET BY MANUFACTURING PROCESS (USD BILLION), 2020-2029
TABLE 184 SAUDI ARABIA NATURAL FIBER COMPOSITES MARKET BY MANUFACTURING PROCESS (KILOTONS), 2020-2029
TABLE 185 SAUDI ARABIA NATURAL FIBER COMPOSITES MARKET BY APPLICATION (USD BILLION), 2020-2029
TABLE 186 SAUDI ARABIA NATURAL FIBER COMPOSITES MARKET BY APPLICATION (KILOTONS), 2020-2029
TABLE 187 SOUTH AFRICA NATURAL FIBER COMPOSITES MARKET BY TYPE (USD BILLION), 2020-2029
TABLE 188 SOUTH AFRICA NATURAL FIBER COMPOSITES MARKET BY TYPE (KILOTONS), 2020-2029
TABLE 189 SOUTH AFRICA NATURAL FIBER COMPOSITES MARKET BY MANUFACTURING PROCESS (USD BILLION), 2020-2029
TABLE 190 SOUTH AFRICA NATURAL FIBER COMPOSITES MARKET BY MANUFACTURING PROCESS (KILOTONS), 2020-2029
TABLE 191 SOUTH AFRICA NATURAL FIBER COMPOSITES MARKET BY APPLICATION (USD BILLION), 2020-2029
TABLE 192 SOUTH AFRICA NATURAL FIBER COMPOSITES MARKET BY APPLICATION (KILOTONS), 2020-2029
TABLE 193 REST OF MIDDLE EAST AND AFRICA NATURAL FIBER COMPOSITES MARKET BY TYPE (USD BILLION), 2020-2029
TABLE 194 REST OF MIDDLE EAST AND AFRICA NATURAL FIBER COMPOSITES MARKET BY TYPE (KILOTONS), 2020-2029
TABLE 195 REST OF MIDDLE EAST AND AFRICA NATURAL FIBER COMPOSITES MARKET BY MANUFACTURING PROCESS (USD BILLION), 2020-2029
TABLE 196 REST OF MIDDLE EAST AND AFRICA NATURAL FIBER COMPOSITES MARKET BY MANUFACTURING PROCESS (KILOTONS), 2020-2029
TABLE 197 REST OF MIDDLE EAST AND AFRICA NATURAL FIBER COMPOSITES MARKET BY APPLICATION (USD BILLION), 2020-2029
TABLE 198 REST OF MIDDLE EAST AND AFRICA NATURAL FIBER COMPOSITES MARKET BY APPLICATION (KILOTONS), 2020-2029
LIST OF FIGURES
FIGURE 1 MARKET DYNAMICS
FIGURE 2 MARKET SEGMENTATION
FIGURE 3 REPORT TIMELINES: YEARS CONSIDERED
FIGURE 4 DATA TRIANGULATION
FIGURE 5 BOTTOM-UP APPROACH
FIGURE 6 TOP-DOWN APPROACH
FIGURE 7 RESEARCH FLOW
FIGURE 8 GLOBAL NATURAL FIBER COMPOSITES BY TYPE, USD BILLION, 2020-2029
FIGURE 9 GLOBAL NATURAL FIBER COMPOSITES BY MANUFACTURING PROCESS, USD BILLION, 2020-2029
FIGURE 10 GLOBAL NATURAL FIBER COMPOSITES BY APPLICATION, USD BILLION, 2020-2029
FIGURE 11 GLOBAL NATURAL FIBER COMPOSITES BY REGION, USD BILLION, 2020-2029
FIGURE 12 PORTER’S FIVE FORCES MODEL
FIGURE 13 GLOBAL NATURAL FIBER COMPOSITES MARKET BY REGION 2021
FIGURE 14 GLOBAL NATURAL FIBER COMPOSITES MARKET BY MANUFACTURING PROCESS 2021
FIGURE 15 GLOBAL NATURAL FIBER COMPOSITES MARKET BY TYPE 2021
FIGURE 16 GLOBAL NATURAL FIBER COMPOSITES MARKET BY APPLICATION 2021
FIGURE 17 MARKET SHARE ANALYSIS
FIGURE 18 TREX COMPANY INC: COMPANY SNAPSHOT
FIGURE 19 UPM BIOCOMPOSITES: COMPANY SNAPSHOT
FIGURE 20 THE AZEK COMPANY LLC: COMPANY SNAPSHOT
FIGURE 21 FLEXFORM TECHNOLOGIES LLC: COMPANY SNAPSHOT
FIGURE 22 GREENCORE COMPOSITES: COMPANY SNAPSHOT
FIGURE 23 GREEN DOT BIOPLASTICS INC.: COMPANY SNAPSHOT
FIGURE 24 PROCOTEX CORP SA: COMPANY SNAPSHOT
FIGURE 25 POLYVLIES FRANZ BEYER GMBH: COMPANY SNAPSHOT
FIGURE 26 AMORIM CORK COMPOSITES SA: COMPANY SNAPSHOT
FIGURE 27 NPSP BV: COMPANY SNAPSHOT
FIGURE 28 TECNARO GMBH: COMPANY SNAPSHOT
DOWNLOAD FREE SAMPLE REPORT
License Type
SPEAK WITH OUR ANALYST
Want to know more about the report or any specific requirement?
WANT TO CUSTOMIZE THE REPORT?
Our Clients Speak
We asked them to research ‘ Equipment market’ all over the world, and their whole arrangement was helpful to us. thehealthanalytics.com insightful analysis and reports contributed to our current analysis and in creating a future strategy. Besides, the te
Yosuke Mitsui
Senior Associate Construction Equipment Sales & Marketing
We asked them to research ‘Equipment market’ all over the world, and their whole arrangement was helpful to us. thehealthanalytics.com insightful analysis and reports contributed to our current analysis and in creating a future strategy. Besides, the te


