

Base Year Value ()
x.x %
x.x %
CAGR ()
x.x %
x.x %
Forecast Year Value ()
x.x %
x.x %
Historical Data Period
Largest Region
Forecast Period
3D Radar Market by Platform (Ground, Airborne, Naval), Range (Short Range (up to 75 Km), Medium Range (75-150Km), Long Range (more than 150Km)), Frequency Band (L Band, C/S/X Band, E/F Band, Others) and Region, Global trends and forecast from 2022 to 2029
Instant access to hundreds of data points and trends
- Market estimates from 2014-2029
- Competitive analysis, industry segmentation, financial benchmarks
- Incorporates SWOT, Porter's Five Forces and risk management frameworks
- PDF report or online database with Word, Excel and PowerPoint export options
- 100% money back guarantee
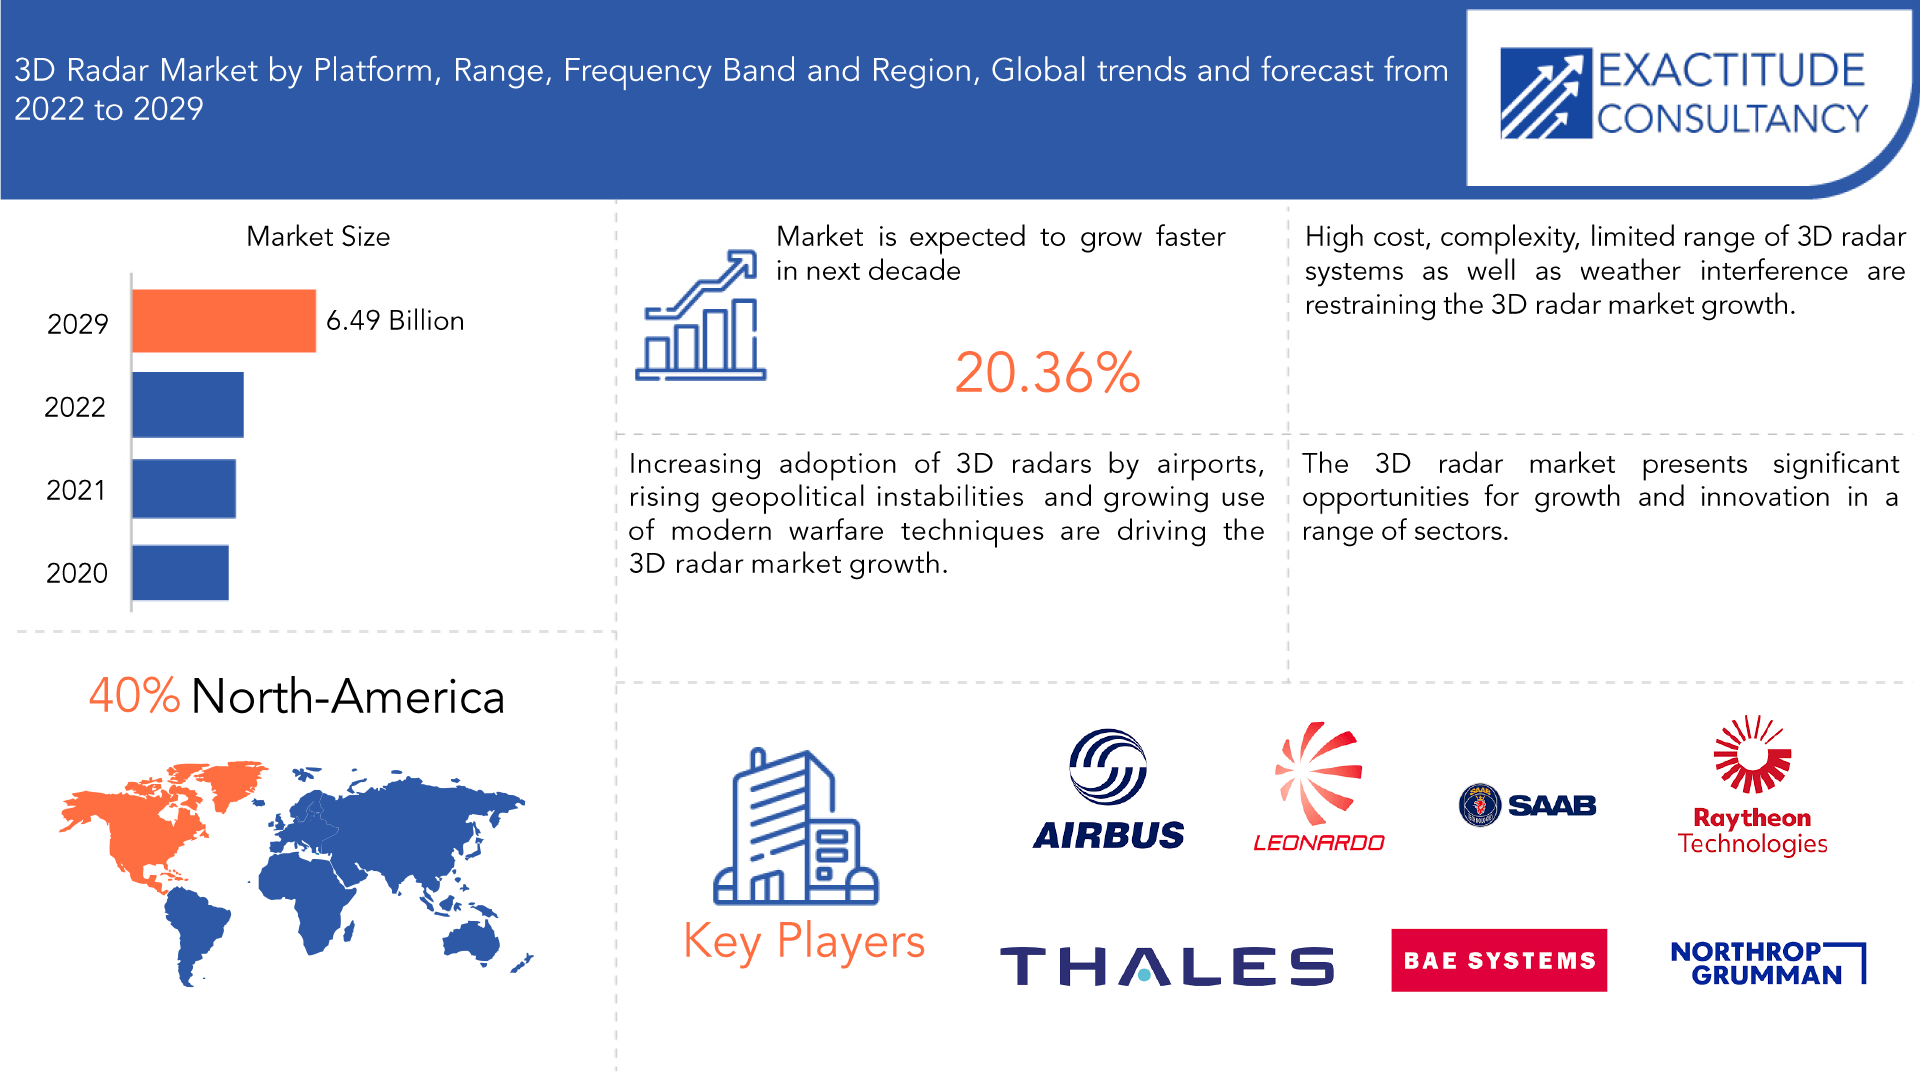
3D Radar Market Overview
The 3D radar market is expected to grow at 20.36% CAGR from 2022 to 2029. It is expected to reach above USD 6.494 billion by 2029 from USD 1.225 billion in 2020.
Radio detection and ranging system is what radar stands for. Radars with three dimensions are an improvement over two. A three-dimensional image of the object's elevation, range, and speed is provided by 3D radar. The market for 3D radar systems, which use cutting-edge sensing and detection technologies to deliver precise information about the immediate surroundings in three dimensions, including distance, direction, and velocity, is referred to as this market. Real-time monitoring and analysis are made possible by 3D radar systems, which provide comprehensive images of the environment using radar waves. They have a wide range of uses in many different sectors, including infrastructural, automotive, industrial, and defense. The growing need for dependable and high-quality 3D sensing and detection technology, technological breakthroughs, and the uptake of autonomous systems and IoT technologies are what are driving the market for 3D radar systems. Furthermore, modern warfare strategies that have quickly improved technologically have made it possible to replace conventional combat systems with cutting-edge combat technologies like electronic warfare and network-centric warfare. As autonomous vehicles and radar gain in popularity, there will be a rise in the demand for 3D radar technology. Overall, the market for 3D radar is expanding quickly and is predicted to do so over the next few years as more industries seek highly accurate and dependable 3D sensing and detection.
| ATTRIBUTE | DETAILS |
| Study period | 2020-2029 |
| Base year | 2021 |
| Estimated year | 2022 |
| Forecasted year | 2022-2029 |
| Historical period | 2018-2020 |
| Unit | Value (USD BILLION) |
| Segmentation | By Platform, By Range, By Frequency Band, By Region |
| By Platform |
|
| By Range |
|
| By Frequency Band |
|
| By Region |
|
Modern warfare tactics have spread around the world, and as a result, old combat systems have been replaced by cutting-edge combat technology including electronic warfare and network-centric warfare. The wars that are erupting on a worldwide scale are fraught with difficulties. Radars are essential for detecting any incoming items from exterior areas, and rising geopolitical instability may be the result. Two-dimensional radar, which is more prevalent, simply offers the horizontal angle or direction of a compass bearing, but three-dimensional radar also provides elevation. In the event of severe weather, increased aviation traffic may occasionally result in crashes. By spreading 3D radar across the regions, it can be prevented since flying objects can be tracked continually and guided to avert calamities. Airports all over the world are projected to use 3D radar more frequently, which will increase market income.
Governments employed 3D radar systems to locate stranded individuals during assaults, and they were critical in assisting the emergency response teams in reaching key sites in time to offer the necessary medical treatment and other necessities. To enhance their market share, many respected companies are focusing on developing cutting-edge military equipment that uses 3D radar technology. The increasing usage of modern battle tactics and the deployment of 3D radar by airports are some of the major factors driving the growth of the 3D radar market. Additionally, it is anticipated that the market for 3D radar would be stimulated by the growing deployment of air and missile defense systems.
There are some significant restraints that the 3D radar market must overcome, which may reduce its room for expansion. The high cost of designing and installing 3D radar systems is one of the key obstacles, and it can be a substantial entrance barrier for smaller businesses or organizations with tighter budgets. Furthermore, 3D radar technology can be complicated, necessitating advanced training and understanding to operate and maintain efficiently. Some users may find it difficult to utilise all of its features as a result. Also, the short range of 3D radar systems can be a problem in some situations, such long-range monitoring. The accuracy and efficiency of 3D radar signals might also be hampered by weather conditions. Last but not least, regulatory difficulties include following rules in sensitive locations like airports and military bases can be difficult and time-consuming. For the 3D radar market to grow and succeed, it will be essential to recognize and solve these restraints.
There are tremendous opportunities for development and innovation in the 3D radar market. One of the industries that uses 3D radar technology the most extensively is the defense and security industry. Advanced 3D radar systems are increasingly in demand for surveillance, reconnaissance, and target detection both on land and at sea. The use of 3D radar technology in the automobile sector for driver assistance systems and driverless vehicles is developing quickly. The market for electric vehicles is expanding, and safety is becoming an even bigger priority. This presents a large opportunity for 3D radar systems.
Global research and development for 3D radars has been delayed as a result of the COVID-19 issue due to government bans on public gatherings and stated lockdowns. Due to the COVID-19 pandemic, it is anticipated that government spending will move to economic recovery, which will result in a reduction in 3D radar orders for the industry. The COVID-19 epidemic has had a detrimental effect on the manufacturing rates of companies that make 3D radar because of the manpower shortage. Due to the low demand for necessary spare parts, the market for military radars has been significantly impacted by the cancellation of several training exercises between states and the worldwide reduction in military operations as a result of COVID-19. After COVID-19, the market for 3D radars is predicted to experience great development because several nations have either already purchased or are preparing to buy such radars for their military forces.
[caption id="attachment_17157" align="aligncenter" width="1920"]
Frequently Asked Questions
• What is the expected CAGR in terms of revenue for the global 3D Radar Market over the forecast period (2020–2029)?
The global 3D Radar Market revenue is projected to expand at a CAGR of 20.36% during the forecast period.
• What was the global 3D Radar Market valued at in 2020?
The global 3D Radar Market was valued at USD 1.225 Billion in 2020.
• Who are the key players in the 3D Radar Market?
Some key players operating in the 3D Radar Market include Airbus S.A.S., Northrop Grumman Corporation, Thales Group, BAE Systems, Raytheon Technologies Corporation, Saab AB, Leonardo S.p.A., ASELSAN A., L3Harris Technologies Inc., Rheinmetall AG, ELTA Systems Ltd., Honeywell International Inc.
• What are the factors driving the 3D Radar Market?
The emergence of modern warfare techniques with fast-technological progressions has contributed to the substitution of conventional combat systems with advanced combat technologies, such as electronic warfare and network-centric warfare. The demand for 3D radar technology will increase as autonomous vehicles and radar become more popular.
• What are the different segments of the Global 3D Radar Market?
The Global 3D Radar Market is divided into Range, Platform, Frequency Band, and Region.
• Which region will lead the global 3D Radar Market?
North America region will lead the global 3D Radar Market during the forecast period 2022 to 2029.
3D Radar Market Segment Analysis
The 3D radar market is segmented based on platform, range, frequency band, and region.
By platform the market is bifurcated into ground, naval, airborne; by range the market is bifurcated into short range (up to 75 km), medium range (75-150km), long range (more than 150km); by frequency band the market is bifurcated into L band, C/S/X band, E/F band, others, and region.
Based on platform, in 2021 the ground sector dominated the world market for 3D radar. Increasing military modernization initiatives and rising defense budgets of nations like China and India are anticipated to fuel the segment's expansion in the global market. The airborne category is predicted to develop with the greatest CAGR during the forecast period, owing to rising government efforts for the usage of 3D radars in military choppers and aircraft. Also, several initiatives launched by the governments of different nations to update their air forces are anticipated to fuel the segment's expansion in the global market. Due to the increasing adoption of cutting-edge naval boats by nations like the US, the UK, and Russia, the marine segment is anticipated to experience a noticeable development rate in the global market.
Based on range, the long-range segment continued to rule in 2021, and it is anticipated that it would continue to do so throughout the projection period. Due to its growing usefulness in weather monitoring applications, long-range 3D radar has gained popularity recently. This is because it allows for the accurate prediction of natural disasters like floods, earthquakes, cyclones, and hurricanes, which is what is fueling the segment's rise.
The C/S/X band sector dominates the global market for 3D radar in terms of frequency band. Military personnel use the C-band as a satellite transponder for long-range tracking and surveillance purposes frequently when operating in combat zones. Additionally, increasing adoption of C/S/X band in various emerged as well as emerging economies is consequently likely to drive the expansion of 3D radar market globally.
[caption id="attachment_17161" align="aligncenter" width="1920"]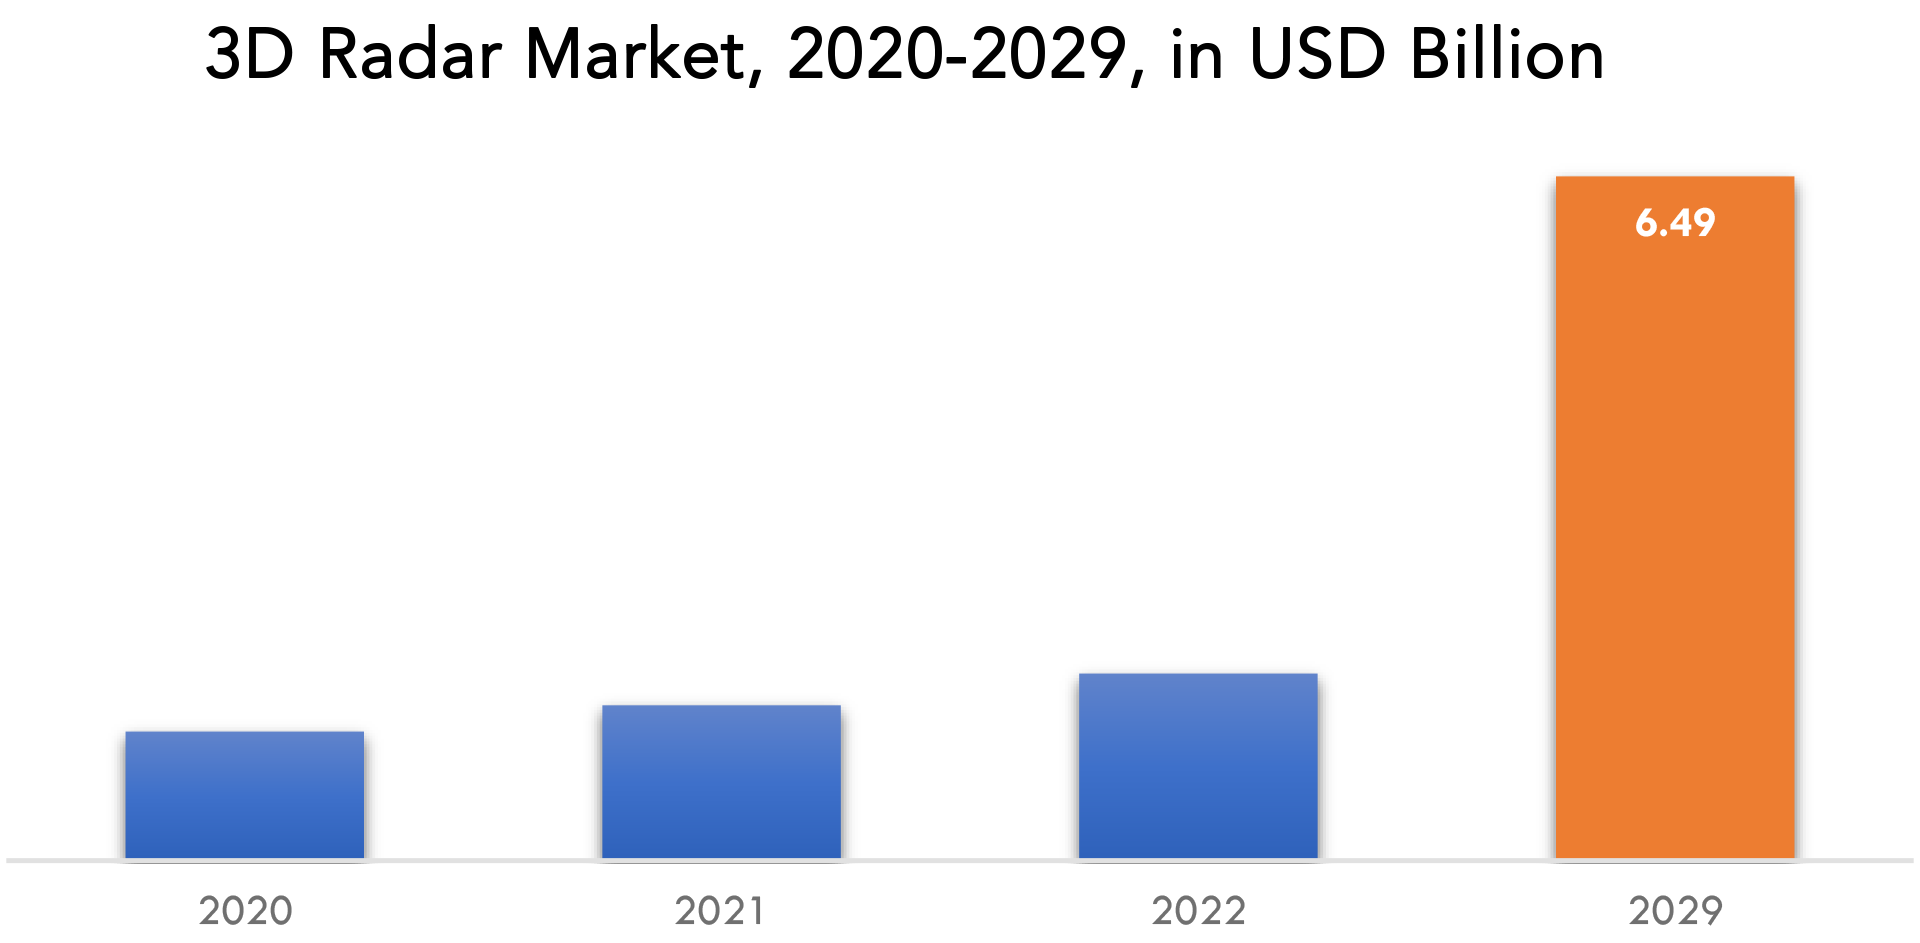
3D Radar Market Key Players
The 3D Radar Market key players include Airbus S.A.S., Northrop Grumman Corporation, Thales Group, BAE Systems, Raytheon Technologies Corporation, Saab AB, Leonardo S.p.A., ASELSAN A., L3Harris Technologies Inc., Rheinmetall AG, ELTA Systems Ltd., Honeywell International Inc., and others. Recent News 27 February 2023: The Airbus Foundation has signed an agreement with the Polar POD expedition to support both the scientific programme and the operational phase of the mission. The Airbus Foundation will provide access to products and services such as Earth observation satellite data, as well as offering additional capabilities for reliable high-speed telecommunications. 03 November 2022: Raytheon Technologies collaborated with Microsoft Corp. to equip the aerospace and defense company's employees with cloud-based tools, technologies, and platforms to enhance collaboration, optimize operations and unlock intelligent insights that drive greater value for customers.Who Should Buy? Or Key Stakeholders
- Military Organizations
- Aerospace Industries
- Scientific Research & Development
- End-users Companies
- Investors
- Government Organization
- Regulatory Authorities
- Others
3D Radar Market Regional Analysis
The 3D Radar Market by region includes North America, Asia-Pacific (APAC), Europe, South America, and Middle East & Africa (MEA).
- North America: includes the US, Canada, Mexico, and Rest of North America
- Asia Pacific: includes China, Japan, South Korea, India, Australia, and Rest of APAC
- Europe: includes UK, Germany, France, Italy, Spain, Russia, and Rest of Europe
- South America: includes Brazil, Argentina, and Rest of South America
- Middle East & Africa: includes UAE, South Africa, Saudi Arabia and Rest of MEA
There is significant market growth in Europe as a result of increased government efforts to install technologically advanced surveillance systems and even some European governments' encouragement of the installation of novel radar systems in cars that help drivers better localize nearby objects and support the European Union's effort to reduce traffic fatalities.
The 3D radar market in the Asia-Pacific region is predicted to have a substantial revenue share. As more cargo is transported through the Indian and Arabian Seas' marine waterways, the need for sophisticated radars will increase. Nations in the APAC region actively invest in cutting-edge radar technologies to bolster their national security protocols and military systems. The development of network-centric military tactics and electronic warfare techniques by defense organizations in response to the rising demand for intelligence and surveillance as well as the geopolitical unrest in the Middle East is another factor that is expected to boost the global market for 3D radar systems.
[caption id="attachment_17165" align="aligncenter" width="1920"]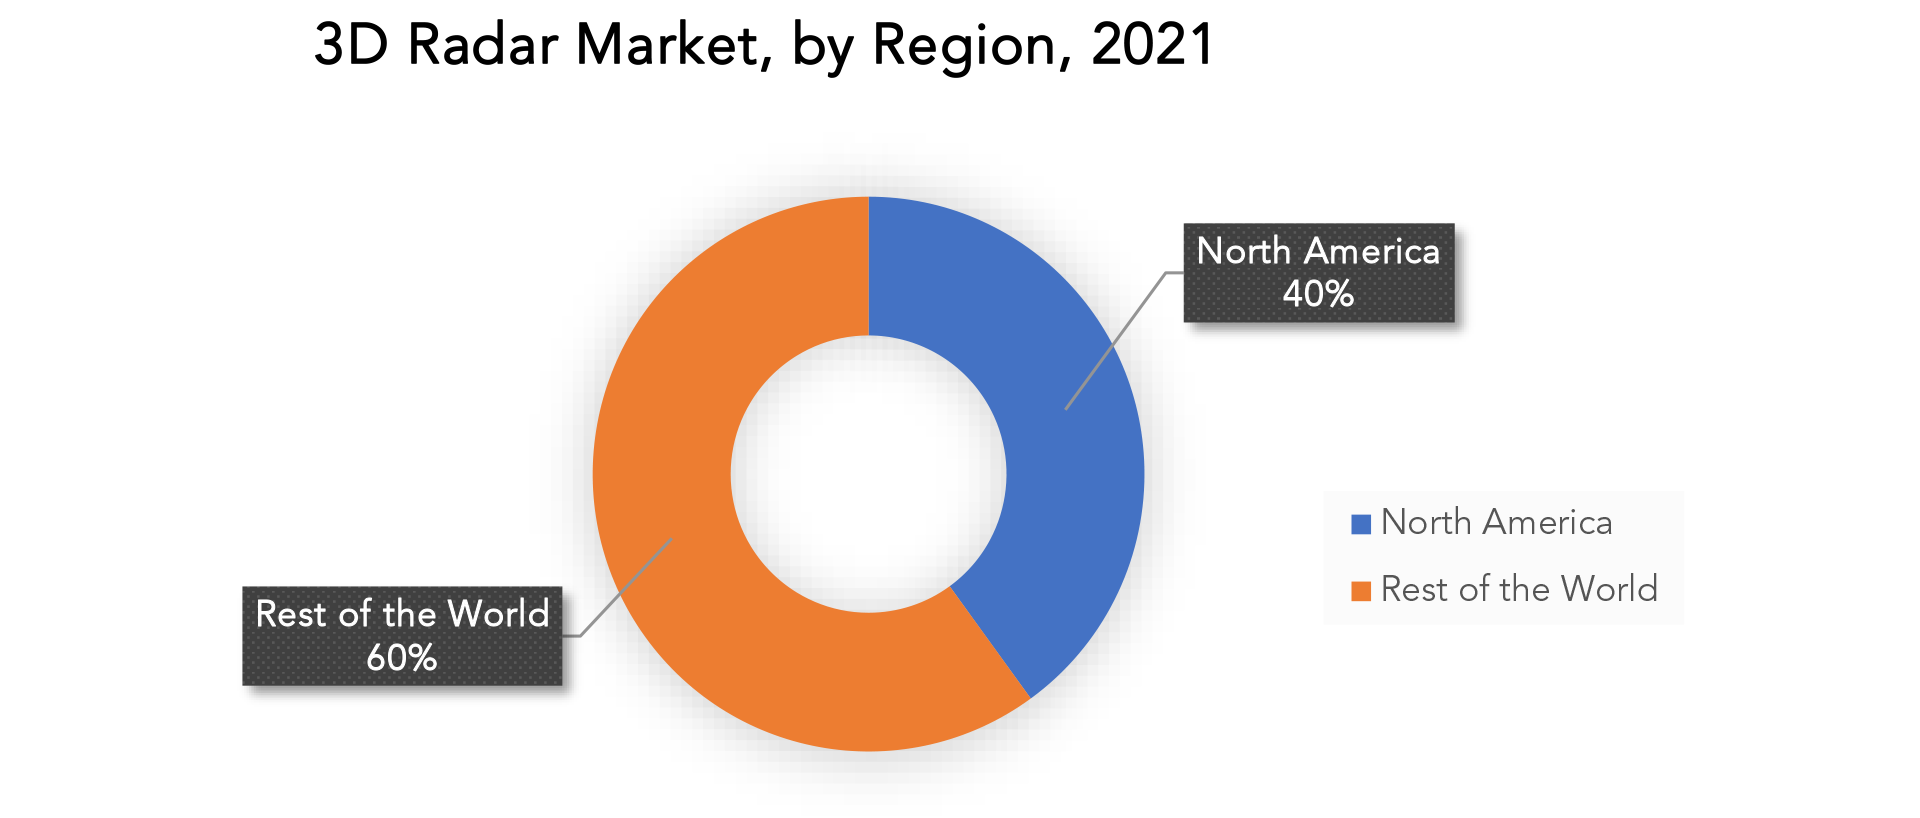
Key Market Segments: 3D Radar Market
3d Radar Market by Platform, 2020-2029, (USD Billion)- Airborne
- Ground
- Naval
- Short Range (Up To 75 Km)
- Medium Range (75-150 Km)
- Long Range (More Than 150 Km)
- L Band
- C/S/X Band
- E/F Band
- Others
- North America
- Asia Pacific
- Europe
- South America
- Middle East And Africa
Exactitude Consultancy Services Key Objectives
- Increasing sales and market share
- Developing new technology
- Improving profitability
- Entering new markets
- Enhancing brand reputation
Key Question Answered
- What is the expected growth rate of the 3D radar market over the next 7 years?
- Who are the major players in the 3D radar market and what is their market share?
- What are the end-user industries driving demand for market and what is their outlook?
- What are the opportunities for growth in emerging markets such as Asia-Pacific, Middle East, and Africa?
- How is the economic environment affecting the 3D radar market, including factors such as interest rates, inflation, and exchange rates?
- What is the expected impact of government policies and regulations on the 3D radar market?
- What is the current and forecasted size and growth rate of the global 3D radar market?
- What are the key drivers of growth in the 3D radar market?
- Who are the major players in the market and what is their market share?
- What are the distribution channels and supply chain dynamics in the 3D radar market?
- What are the technological advancements and innovations in the 3D radar market and their impact on product development and growth?
- What are the regulatory considerations and their impact on the market?
- What are the challenges faced by players in the 3D radar market and how are they addressing these challenges?
- What are the opportunities for growth and expansion in the 3D radar market?
- What are the service offerings and specifications of leading players in the market?
- INTRODUCTION
- MARKET DEFINITION
- MARKET SEGMENTATION
- RESEARCH TIMELINES
- ASSUMPTIONS AND LIMITATIONS
- RESEARCH METHODOLOGY
- DATA MINING
- SECONDARY RESEARCH
- PRIMARY RESEARCH
- SUBJECT-MATTER EXPERTS’ ADVICE
- QUALITY CHECKS
- FINAL REVIEW
- DATA TRIANGULATION
- BOTTOM-UP APPROACH
- TOP-DOWN APPROACH
- RESEARCH FLOW
- DATA SOURCES
- DATA MINING
- EXECUTIVE SUMMARY
- MARKET OVERVIEW
- GLOBAL 3D RADAR MARKET OUTLOOK
- MARKET DRIVERS
- MARKET RESTRAINTS
- MARKET OPPORTUNITIES
- IMPACT OF COVID-19 ON 3D RADAR MARKET
- PORTER’S FIVE FORCES MODEL
- THREAT FROM NEW ENTRANTS
- THREAT FROM SUBSTITUTES
- BARGAINING POWER OF SUPPLIERS
- BARGAINING POWER OF CUSTOMERS
- DEGREE OF COMPETITION
- INDUSTRY VALUE CHAIN ANALYSIS
- GLOBAL 3D RADAR MARKET OUTLOOK
- GLOBAL 3D RADAR MARKET BY PLATFORM (USD BILLION), 2020-2029
- AIRBORNE
- GROUND
- NAVAL
- GLOBAL 3D RADAR MARKET BY RANGE (USD BILLION), 2020-2029
- SHORT RANGE (UP TO 75 KM)
- MEDIUM RANGE (75-150 KM)
- LONG RANGE (MORE THAN 150 KM)
- GLOBAL 3D RADAR MARKET BY FREQUENCY BAND (USD BILLION), 2020-2029
- L BAND
- C/S/X BAND
- E/F BAND
- OTHERS
- GLOBAL 3D RADAR MARKET BY REGION (USD BILLION), 2020-2029
- NORTH AMERICA
- US
- CANADA
- MEXICO
- SOUTH AMERICA
- BRAZIL
- ARGENTINA
- COLOMBIA
- REST OF SOUTH AMERICA
- EUROPE
- GERMANY
- UK
- FRANCE
- ITALY
- SPAIN
- RUSSIA
- REST OF EUROPE
- ASIA PACIFIC
- INDIA
- CHINA
- JAPAN
- SOUTH KOREA
- AUSTRALIA
- REST OF ASIA PACIFIC
- MIDDLE EAST AND AFRICA
- UAE
- SAUDI ARABIA
- SOUTH AFRICA
- REST OF MIDDLE EAST AND AFRICA
- NORTH AMERICA
- COMPANY PROFILES* (BUSINESS OVERVIEW, COMPANY SNAPSHOT, PRODUCTS OFFERED, RECENT DEVELOPMENTS)
- AIRBUS S.A.S.
- NORTHROP GRUMMAN CORPORATION
- THALES GROUP
- BAE SYSTEMS
- RAYTHEON TECHNOLOGIES CORPORATION
- SAAB AB
- LEONARDO S.P.A.
- ASELSAN A.
- L3HARRIS TECHNOLOGIES INC.
- RHEINMETALL AG
- ELTA SYSTEMS LTD.
- HONEYWELL INTERNATIONAL INC. *THE COMPANY LIST IS INDICATIVE
LIST OF TABLES
TABLE 1 GLOBAL 3D RADAR MARKET BY PLATFORM (USD BILLION), 2020-2029
TABLE 2 GLOBAL 3D RADAR MARKET BY RANGE (USD BILLION), 2020-2029
TABLE 3 GLOBAL 3D RADAR MARKET BY FREQUENCY BAND (USD BILLION), 2020-2029
TABLE 4 GLOBAL 3D RADAR MARKET BY REGION (USD BILLION), 2020-2029
TABLE 5 NORTH AMERICA 3D RADAR MARKET BY PLATFORM (USD BILLION), 2020-2029
TABLE 6 NORTH AMERICA 3D RADAR MARKET BY RANGE (USD BILLION), 2020-2029
TABLE 7 NORTH AMERICA 3D RADAR MARKET BY FREQUENCY BAND (USD BILLION), 2020-2029
TABLE 8 NORTH AMERICA 3D RADAR MARKET BY COUNTRY (USD BILLION), 2020-2029
TABLE 9 US 3D RADAR MARKET BY PLATFORM (USD BILLION), 2020-2029
TABLE 10 US 3D RADAR MARKET BY RANGE (USD BILLION), 2020-2029
TABLE 11 US 3D RADAR MARKET BY FREQUENCY BAND (USD BILLION), 2020-2029
TABLE 12 CANADA 3D RADAR MARKET BY PLATFORM (BILLION), 2020-2029
TABLE 13 CANADA 3D RADAR MARKET BY RANGE (USD BILLION), 2020-2029
TABLE 14 CANADA 3D RADAR MARKET BY FREQUENCY BAND (USD BILLION), 2020-2029
TABLE 15 MEXICO 3D RADAR MARKET BY PLATFORM (USD BILLION), 2020-2029
TABLE 16 MEXICO 3D RADAR MARKET BY RANGE (USD BILLION), 2020-2029
TABLE 17 MEXICO 3D RADAR MARKET BY FREQUENCY BAND (USD BILLION), 2020-2029
TABLE 18 REST OF NORTH AMERICA 3D RADAR MARKET BY PLATFORM (USD BILLION), 2020-2029
TABLE 19 REST OF NORTH AMERICA 3D RADAR MARKET BY RANGE (USD BILLION), 2020-2029
TABLE 20 REST OF NORTH AMERICA 3D RADAR MARKET BY FREQUENCY BAND (USD BILLION), 2020-2029
TABLE 21 SOUTH AMERICA 3D RADAR MARKET BY PLATFORM (USD BILLION), 2020-2029
TABLE 22 SOUTH AMERICA 3D RADAR MARKET BY RANGE (USD BILLION), 2020-2029
TABLE 23 SOUTH AMERICA 3D RADAR MARKET BY FREQUENCY BAND (USD BILLION), 2020-2029
TABLE 24 SOUTH AMERICA 3D RADAR MARKET BY COUNTRY (USD BILLION), 2020-2029
TABLE 25 BRAZIL 3D RADAR MARKET BY PLATFORM (USD BILLION), 2020-2029
TABLE 26 BRAZIL 3D RADAR MARKET BY RANGE (USD BILLION), 2020-2029
TABLE 27 BRAZIL 3D RADAR MARKET BY FREQUENCY BAND (USD BILLION), 2020-2029
TABLE 28 ARGENTINA 3D RADAR MARKET BY PLATFORM (USD BILLION), 2020-2029
TABLE 29 ARGENTINA 3D RADAR MARKET BY RANGE (USD BILLION), 2020-2029
TABLE 30 ARGENTINA 3D RADAR MARKET BY FREQUENCY BAND (USD BILLION), 2020-2029
TABLE 31 COLOMBIA 3D RADAR MARKET BY PLATFORM (USD BILLION), 2020-2029
TABLE 32 COLOMBIA 3D RADAR MARKET BY RANGE (USD BILLION), 2020-2029
TABLE 33 COLOMBIA 3D RADAR MARKET BY FREQUENCY BAND (USD BILLION), 2020-2029
TABLE 34 REST OF SOUTH AMERICA 3D RADAR MARKET BY PLATFORM (USD BILLION), 2020-2029
TABLE 35 REST OF SOUTH AMERICA 3D RADAR MARKET BY RANGE (USD BILLION), 2020-2029
TABLE 36 REST OF SOUTH AMERICA 3D RADAR MARKET BY FREQUENCY BAND (USD BILLION), 2020-2029
TABLE 37 ASIA-PACIFIC 3D RADAR MARKET BY PLATFORM (USD BILLION), 2020-2029
TABLE 38 ASIA-PACIFIC 3D RADAR MARKET BY RANGE (USD BILLION), 2020-2029
TABLE 39 ASIA-PACIFIC 3D RADAR MARKET BY FREQUENCY BAND (USD BILLION), 2020-2029
TABLE 40 ASIA-PACIFIC 3D RADAR MARKET BY COUNTRY (USD BILLION), 2020-2029
TABLE 41 INDIA 3D RADAR MARKET BY PLATFORM (USD BILLION), 2020-2029
TABLE 42 INDIA 3D RADAR MARKET BY RANGE (USD BILLION), 2020-2029
TABLE 43 INDIA 3D RADAR MARKET BY FREQUENCY BAND (USD BILLION), 2020-2029
TABLE 44 CHINA 3D RADAR MARKET BY PLATFORM (USD BILLION), 2020-2029
TABLE 45 CHINA 3D RADAR MARKET BY RANGE (USD BILLION), 2020-2029
TABLE 46 CHINA 3D RADAR MARKET BY FREQUENCY BAND (USD BILLION), 2020-2029
TABLE 47 JAPAN 3D RADAR MARKET BY PLATFORM (USD BILLION), 2020-2029
TABLE 48 JAPAN 3D RADAR MARKET BY RANGE (USD BILLION), 2020-2029
TABLE 49 JAPAN 3D RADAR MARKET BY FREQUENCY BAND (USD BILLION), 2020-2029
TABLE 50 SOUTH KOREA 3D RADAR MARKET BY PLATFORM (USD BILLION), 2020-2029
TABLE 51 SOUTH KOREA 3D RADAR MARKET BY RANGE (USD BILLION), 2020-2029
TABLE 52 SOUTH KOREA 3D RADAR MARKET BY FREQUENCY BAND (USD BILLION), 2020-2029
TABLE 53 AUSTRALIA 3D RADAR MARKET BY PLATFORM (USD BILLION), 2020-2029
TABLE 54 AUSTRALIA 3D RADAR MARKET BY RANGE (USD BILLION), 2020-2029
TABLE 55 AUSTRALIA 3D RADAR MARKET BY FREQUENCY BAND (USD BILLION), 2020-2029
TABLE 56 REST OF ASIA PACIFIC 3D RADAR MARKET BY PLATFORM (USD BILLION), 2020-2029
TABLE 57 REST OF ASIA PACIFIC 3D RADAR MARKET BY RANGE (USD BILLION), 2020-2029
TABLE 58 REST OF ASIA PACIFIC 3D RADAR MARKET BY FREQUENCY BAND (USD BILLION), 2020-2029
TABLE 59 EUROPE 3D RADAR MARKET BY PLATFORM (USD BILLION), 2020-2029
TABLE 60 EUROPE 3D RADAR MARKET BY RANGE (USD BILLION), 2020-2029
TABLE 61 EUROPE 3D RADAR MARKET BY FREQUENCY BAND (USD BILLION), 2020-2029
TABLE 62 EUROPE 3D RADAR MARKET BY COUNTRY (USD BILLION), 2020-2029
TABLE 63 GERMANY 3D RADAR MARKET BY PLATFORM (USD BILLION), 2020-2029
TABLE 64 GERMANY 3D RADAR MARKET BY RANGE (USD BILLION), 2020-2029
TABLE 65 GERMANY 3D RADAR MARKET BY FREQUENCY BAND (USD BILLION), 2020-2029
TABLE 66 UK 3D RADAR MARKET BY PLATFORM (USD BILLION), 2020-2029
TABLE 67 UK 3D RADAR MARKET BY RANGE (USD BILLION), 2020-2029
TABLE 68 UK 3D RADAR MARKET BY FREQUENCY BAND (USD BILLION), 2020-2029
TABLE 69 FRANCE 3D RADAR MARKET BY PLATFORM (USD BILLION), 2020-2029
TABLE 70 FRANCE 3D RADAR MARKET BY RANGE (USD BILLION), 2020-2029
TABLE 71 FRANCE 3D RADAR MARKET BY FREQUENCY BAND (USD BILLION), 2020-2029
TABLE 72 ITALY 3D RADAR MARKET BY PLATFORM (USD BILLION), 2020-2029
TABLE 73 ITALY 3D RADAR MARKET BY RANGE (USD BILLION), 2020-2029
TABLE 74 ITALY 3D RADAR MARKET BY FREQUENCY BAND (USD BILLION), 2020-2029
TABLE 75 SPAIN 3D RADAR MARKET BY PLATFORM (USD BILLION), 2020-2029
TABLE 76 SPAIN 3D RADAR MARKET BY RANGE (USD BILLION), 2020-2029
TABLE 77 SPAIN 3D RADAR MARKET BY FREQUENCY BAND (USD BILLION), 2020-2029
TABLE 78 RUSSIA 3D RADAR MARKET BY PLATFORM (USD BILLION), 2020-2029
TABLE 79 RUSSIA 3D RADAR MARKET BY RANGE (USD BILLION), 2020-2029
TABLE 80 RUSSIA 3D RADAR MARKET BY FREQUENCY BAND (USD BILLION), 2020-2029
TABLE 81 REST OF EUROPE 3D RADAR MARKET BY PLATFORM (USD BILLION), 2020-2029
TABLE 82 REST OF EUROPE 3D RADAR MARKET BY RANGE (USD BILLION), 2020-2029
TABLE 83 REST OF EUROPE 3D RADAR MARKET BY FREQUENCY BAND (USD BILLION), 2020-2029
TABLE 84 MIDDLE EAST AND AFRICA 3D RADAR MARKET BY PLATFORM (USD BILLION), 2020-2029
TABLE 85 MIDDLE EAST AND AFRICA 3D RADAR MARKET BY RANGE (USD BILLION), 2020-2029
TABLE 86 MIDDLE EAST AND AFRICA 3D RADAR MARKET BY FREQUENCY BAND (USD BILLION), 2020-2029
TABLE 87 MIDDLE EAST AND AFRICA 3D RADAR MARKET BY COUNTRY (USD BILLION), 2020-2029
TABLE 88 UAE 3D RADAR MARKET BY PLATFORM (USD BILLION), 2020-2029
TABLE 89 UAE 3D RADAR MARKET BY RANGE (USD BILLION), 2020-2029
TABLE 90 UAE 3D RADAR MARKET BY FREQUENCY BAND (USD BILLION), 2020-2029
TABLE 91 SAUDI ARABIA 3D RADAR MARKET BY PLATFORM (USD BILLION), 2020-2029
TABLE 92 SAUDI ARABIA 3D RADAR MARKET BY RANGE (USD BILLION), 2020-2029
TABLE 93 SAUDI ARABIA 3D RADAR MARKET BY FREQUENCY BAND (USD BILLION), 2020-2029
TABLE 94 SOUTH AFRICA 3D RADAR MARKET BY PLATFORM (USD BILLION), 2020-2029
TABLE 95 SOUTH AFRICA 3D RADAR MARKET BY RANGE (USD BILLION), 2020-2029
TABLE 96 SOUTH AFRICA 3D RADAR MARKET BY FREQUENCY BAND (USD BILLION), 2020-2029
TABLE 97 REST OF MIDDLE EAST AND AFRICA 3D RADAR MARKET BY PLATFORM (USD BILLION), 2020-2029
TABLE 98 REST OF MIDDLE EAST AND AFRICA 3D RADAR MARKET BY RANGE (USD BILLION), 2020-2029
TABLE 99 REST OF MIDDLE EAST AND AFRICA 3D RADAR MARKET BY FREQUENCY BAND (USD BILLION), 2020-2029
LIST OF FIGURES
FIGURE 1 MARKET DYNAMICS
FIGURE 2 MARKET SEGMENTATION
FIGURE 3 REPORT TIMELINES: YEARS CONSIDERED
FIGURE 4 DATA TRIANGULATION
FIGURE 5 BOTTOM-UP APPROACH
FIGURE 6 TOP-DOWN APPROACH
FIGURE 7 RESEARCH FLOW
FIGURE 8 GLOBAL 3D RADAR MARKET BY PLATFORM, USD BILLION, 2020-2029
FIGURE 9 GLOBAL 3D RADAR MARKET BY RANGE, USD BILLION, 2020-2029
FIGURE 10 GLOBAL 3D RADAR MARKET BY FREQUENCY BAND, USD BILLION, 2020-2029
FIGURE 11 GLOBAL 3D RADAR MARKET BY REGION, USD BILLION, 2020-2029
FIGURE 12 PORTER’S FIVE FORCES MODEL
FIGURE 13 GLOBAL 3D RADAR MARKET BY REGION 2021
FIGURE 14 GLOBAL 3D RADAR MARKET BY PLATFORM 2021
FIGURE 15 GLOBAL 3D RADAR MARKET BY RANGE 2021
FIGURE 16 GLOBAL 3D RADAR MARKET BY FREQUENCY BAND 2021
FIGURE 17 MARKET SHARE ANALYSIS
FIGURE 18 AIRBUS S.A.S.: COMPANY SNAPSHOT
FIGURE 19 NORTHROP GRUMMAN CORPORATIONS: COMPANY SNAPSHOT
FIGURE 20 THALES GROUP: COMPANY SNAPSHOT
FIGURE 21 BAE SYSTEMS: COMPANY SNAPSHOT
FIGURE 22 RAYTHEON TECHNOLOGIES CORPORATION: COMPANY SNAPSHOT
FIGURE 23 SAAB AB: COMPANY SNAPSHOT
FIGURE 24 LEONARDO S.P.A.: COMPANY SNAPSHOT
FIGURE 25 ASELSAN A.: COMPANY SNAPSHOT
FIGURE 26 L3HARRIS TECHNOLOGIES INC.: COMPANY SNAPSHOT
FIGURE 27 RHEINMETALL AG: COMPANY SNAPSHOT
FIGURE 28 ELTA SYSTEMS LTD.: COMPANY SNAPSHOT
FIGURE 29 HONEYWELL INTERNATIONAL INC.: COMPANY SNAPSHOT
DOWNLOAD FREE SAMPLE REPORT
License Type
SPEAK WITH OUR ANALYST
Want to know more about the report or any specific requirement?
WANT TO CUSTOMIZE THE REPORT?
Our Clients Speak
We asked them to research ‘ Equipment market’ all over the world, and their whole arrangement was helpful to us. thehealthanalytics.com insightful analysis and reports contributed to our current analysis and in creating a future strategy. Besides, the te
Yosuke Mitsui
Senior Associate Construction Equipment Sales & Marketing
We asked them to research ‘Equipment market’ all over the world, and their whole arrangement was helpful to us. thehealthanalytics.com insightful analysis and reports contributed to our current analysis and in creating a future strategy. Besides, the te


