

Base Year Value ()
x.x %
x.x %
CAGR ()
x.x %
x.x %
Forecast Year Value ()
x.x %
x.x %
Historical Data Period
Largest Region
Forecast Period
Gas Mixtures Market by Mixture (Oxygen Mixtures, Nitrogen Mixtures, Carbon Dioxide Mixtures, Argon Mixtures, Hydrogen Mixtures, Specialty Gas Mixtures), by End User (Fabrication, Chemical, Medical & Healthcare, Food & Beverage, Electronics) and Region, Global Trends and Forecast From 2022 To 2029
Instant access to hundreds of data points and trends
- Market estimates from 2014-2029
- Competitive analysis, industry segmentation, financial benchmarks
- Incorporates SWOT, Porter's Five Forces and risk management frameworks
- PDF report or online database with Word, Excel and PowerPoint export options
- 100% money back guarantee
Gas Mixtures Market Overview
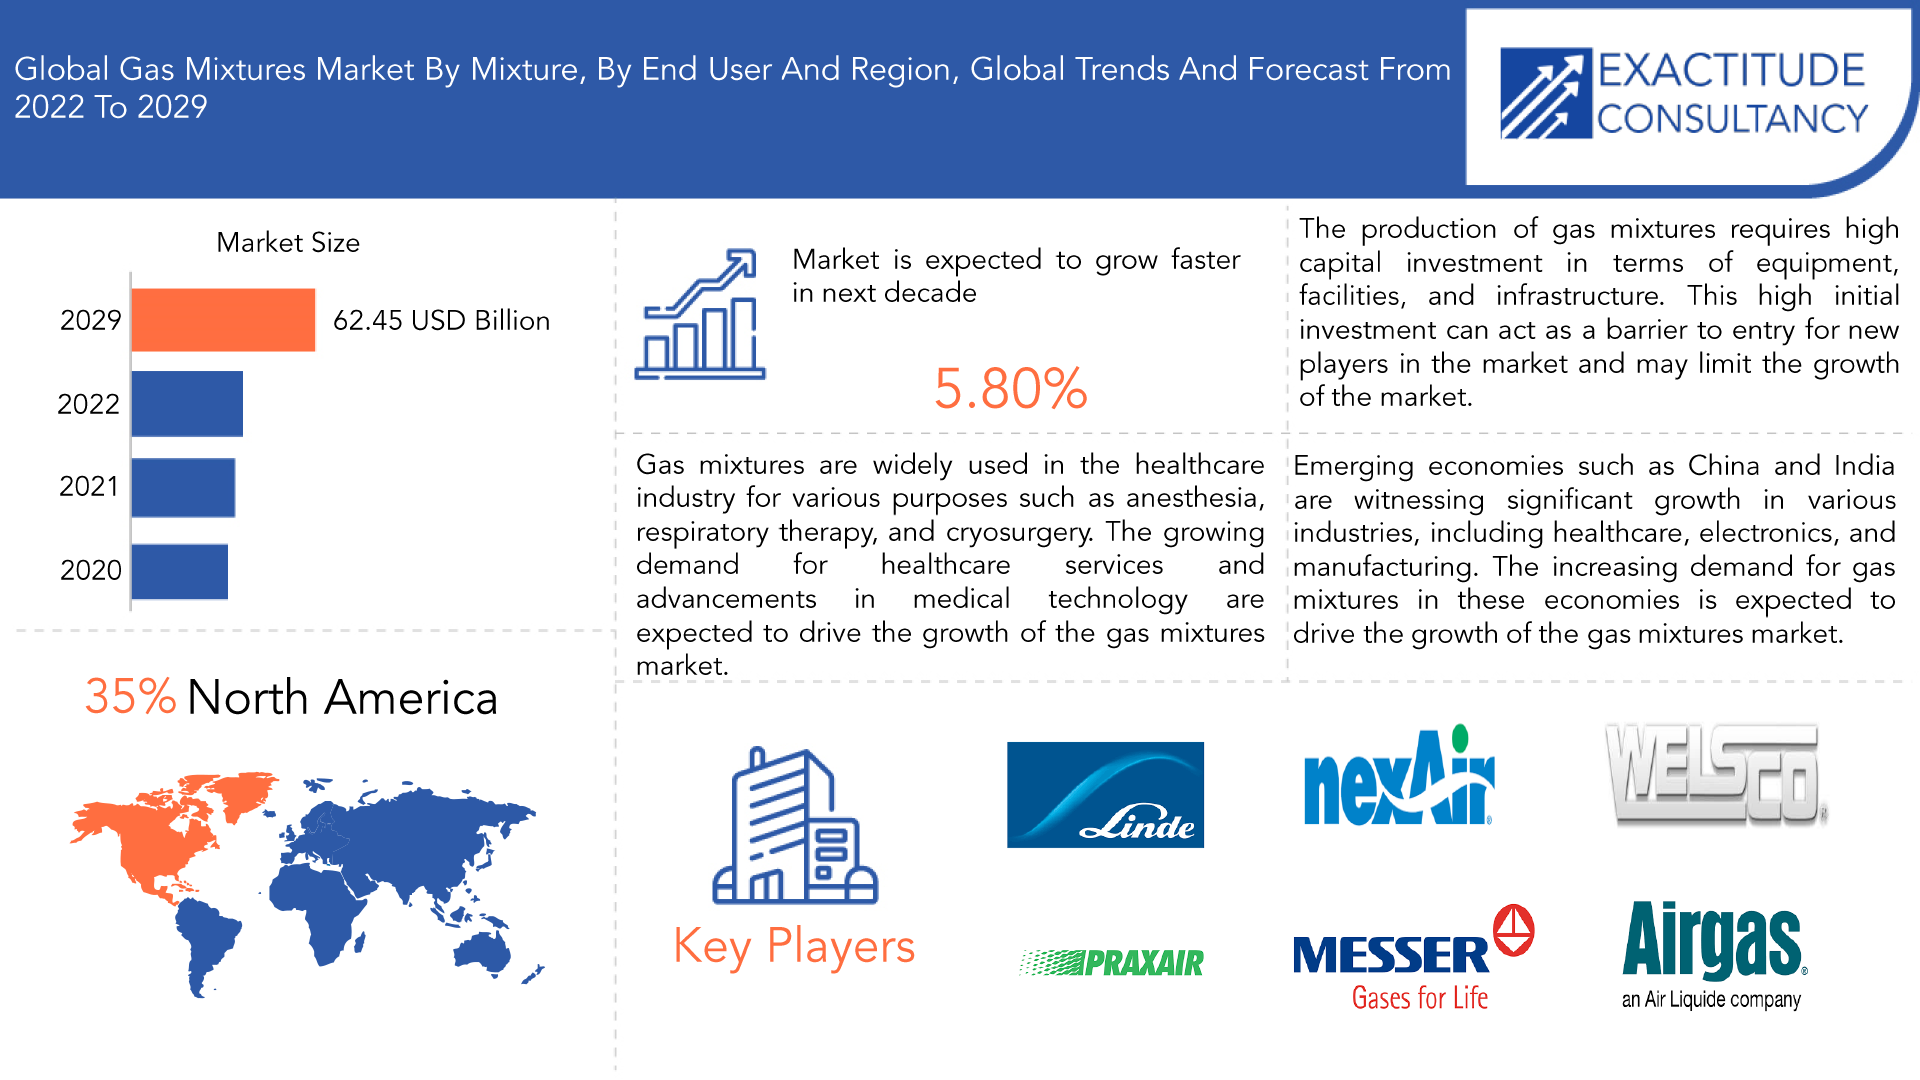
The global gas mixtures market is expected to grow at 5.80 % CAGR from 2020 to 2029. It is expected to reach above USD 62.45 Billion by 2029 from USD 37.60 Billion in 2020.
A gas mixture is a combination of two or more gases, each present in a specific proportion or concentration. The gases in the mixture can be either pure elements or compounds, and they are typically mixed together to create a gas with specific properties or characteristics that are required for a particular application or process. Gas mixtures can be used in various industries such as healthcare, manufacturing, electronics, and food and beverage. The proportions of gases in a mixture can be adjusted to achieve specific properties such as reactivity, inertness, or flame temperature, depending on the intended application.
| ATTRIBUTE | DETAILS |
| Study period | 2020-2029 |
| Base year | 2021 |
| Estimated year | 2022 |
| Forecasted year | 2022-2029 |
| Historical period | 2018-2020 |
| Unit | Value (USD Billion), (Kilotons) |
| Segmentation | By Mixtures, End User and region. |
| By Mixtures |
|
| By End User |
|
| By Region |
|
The need for gas mixtures is rising as healthcare technology advances. The expansion of medical sectors as a consequence of gas-assist equipment suppliers has resulted in a diverse variety of equipment and controls, but the basic approach stays the same in all forms. The fundamental reason for the modifications in steam and pressure management is to allow for more ordered control of process variables. The increased demand for gas mixture in the healthcare sector for a variety of applications is likely to propel the worldwide gas mixture market forward.
The gas mixtures market faces challenges due to structural and regulatory restrictions, as well as high prices. Regulations and safety standards add to the costs and complexity of producing and distributing gas mixtures, while the limited availability of raw materials and high production costs can make it difficult to produce them at a reasonable cost. Additionally, the gas mixtures market is highly consolidated, creating barriers to entry and limiting competition. Finally, price volatility in the market can create uncertainty and risks for manufacturers and distributors, which can lead to higher prices for consumers.
The expansion of the electronics industry is a major opportunity for the gas mixtures market. Gas mixtures are widely used in various manufacturing processes in the electronics industry, including semiconductor fabrication and LCD display manufacturing. The growing demand for consumer electronics, such as smartphones, tablets, and other electronic devices, is driving the growth of the electronics industry, which in turn is increasing the demand for gas mixtures. The development of advanced technologies and the increasing use of automation and digitization in the electronics industry are also driving the demand for high-purity gases and gas mixtures. As a result, the electronics industry is expected to continue to drive the growth of the gas mixtures market in the future.
The COVID-19 pandemic has had a significant impact on the gas mixtures market. The pandemic has led to a decline in demand for gas mixtures in industries such as automotive, aerospace, and oil and gas due to the slowdown in these industries caused by the pandemic and the associated economic downturn. However, the pandemic has also created new opportunities for the gas mixtures market, particularly in the healthcare industry, where there has been a surge in demand for medical-grade oxygen and other medical gases used in the treatment of severe COVID-19 cases. Additionally, the COVID-19 pandemic has disrupted global supply chains, making it difficult for gas mixture manufacturers to source raw materials and distribute products, which has led to supply shortages and price increases in some cases. On the other hand, the pandemic has also accelerated the adoption of digital technologies in the gas mixture industry, enabling manufacturers to improve efficiency, reduce costs, and better serve customers remotely. Overall, the impact of COVID-19 on the gas mixtures market has been mixed, with both positive and negative effects.
[caption id="attachment_18123" align="aligncenter" width="1920"]
Frequently Asked Questions
• What is the worth of the Global Gas Mixtures Market?
The Global Gas Mixtures Market is expected to grow at 5.80 % CAGR from 2020 to 2029. It is expected to reach above USD 62.45 Billion by 2029 from USD 37.60 Billion in 2020.
• What is the size of the North America Gas Mixtures Market?
North America held more than 35% of the Gas Mixtures Market revenue share in 2020 and will witness tremendous expansion during the forecast period.
• What are some of the market's driving forces?
The need for gas mixtures is rising as healthcare technology advances. The expansion of medical sectors as a consequence of gas-assist equipment suppliers has resulted in a diverse variety of equipment and controls, but the basic approach stays the same in all forms.
• Which are the top companies to hold the market share in the Gas Mixtures Market?
The Gas Mixtures Market key players include Linde Plc, Praxair Inc., Air Liquide S.A., Air Products and Chemicals, Inc., Airgas Inc., Advanced Specialty Gases Inc., Alpha Packaging, Inc, Nexair LLC, Messer Group, Welsco Inc.
• What is the leading Application of the Gas Mixtures Market?
The Health Care sector is major sector where the application of Gas Mixtures has seen more.
• Which is the largest regional market for Gas Mixtures Market?
The Markets largest share is in the North America region.
Gas Mixtures Market Segment Analysis
The market is divided based on mixtures into oxygen, nitrogen, hydrogen, carbon dioxide, argon and specialty gas mixtures. A significant portion of the market for this product category was dominated by oxygen mixtures. Medical-grade oxygen is used in hospitals and clinics for respiratory support, including ventilation and oxygen therapy. Oxygen mixtures are also used in medical research, including studies of respiratory diseases, anesthesia, and other areas of medical research. Additionally, oxygen mixtures are used in emergency medical services (EMS), where they are transported to the site of an accident or injury and administered to patients to stabilize their breathing. During the COVID-19 pandemic, there has been a surge in demand for medical-grade oxygen, leading to shortages and price increases in some regions. Oxygen mixtures have played a critical role in the treatment of severe COVID-19 cases, where patients require high-flow oxygen therapy or mechanical ventilation. As a result, the demand for oxygen mixtures is expected to grow further in the healthcare industry.
The market is divided based on the end user into fabrication, chemicals, medical and healthcare, electronics, food and beverages. metal fabrication industry is the largest market for gas mixtures. In this industry, gas mixtures are used for shielding and cutting purposes to protect the weld pool from atmospheric contamination and improve the quality and strength of the weld. The most commonly used gas mixtures for welding and metal fabrication are argon-carbon dioxide mixtures, which are used for welding carbon and low-alloy steels. Other gas mixtures, such as argon-helium mixtures and oxygen-acetylene mixtures, are also used for specific welding applications.
[caption id="attachment_18124" align="aligncenter" width="1920"]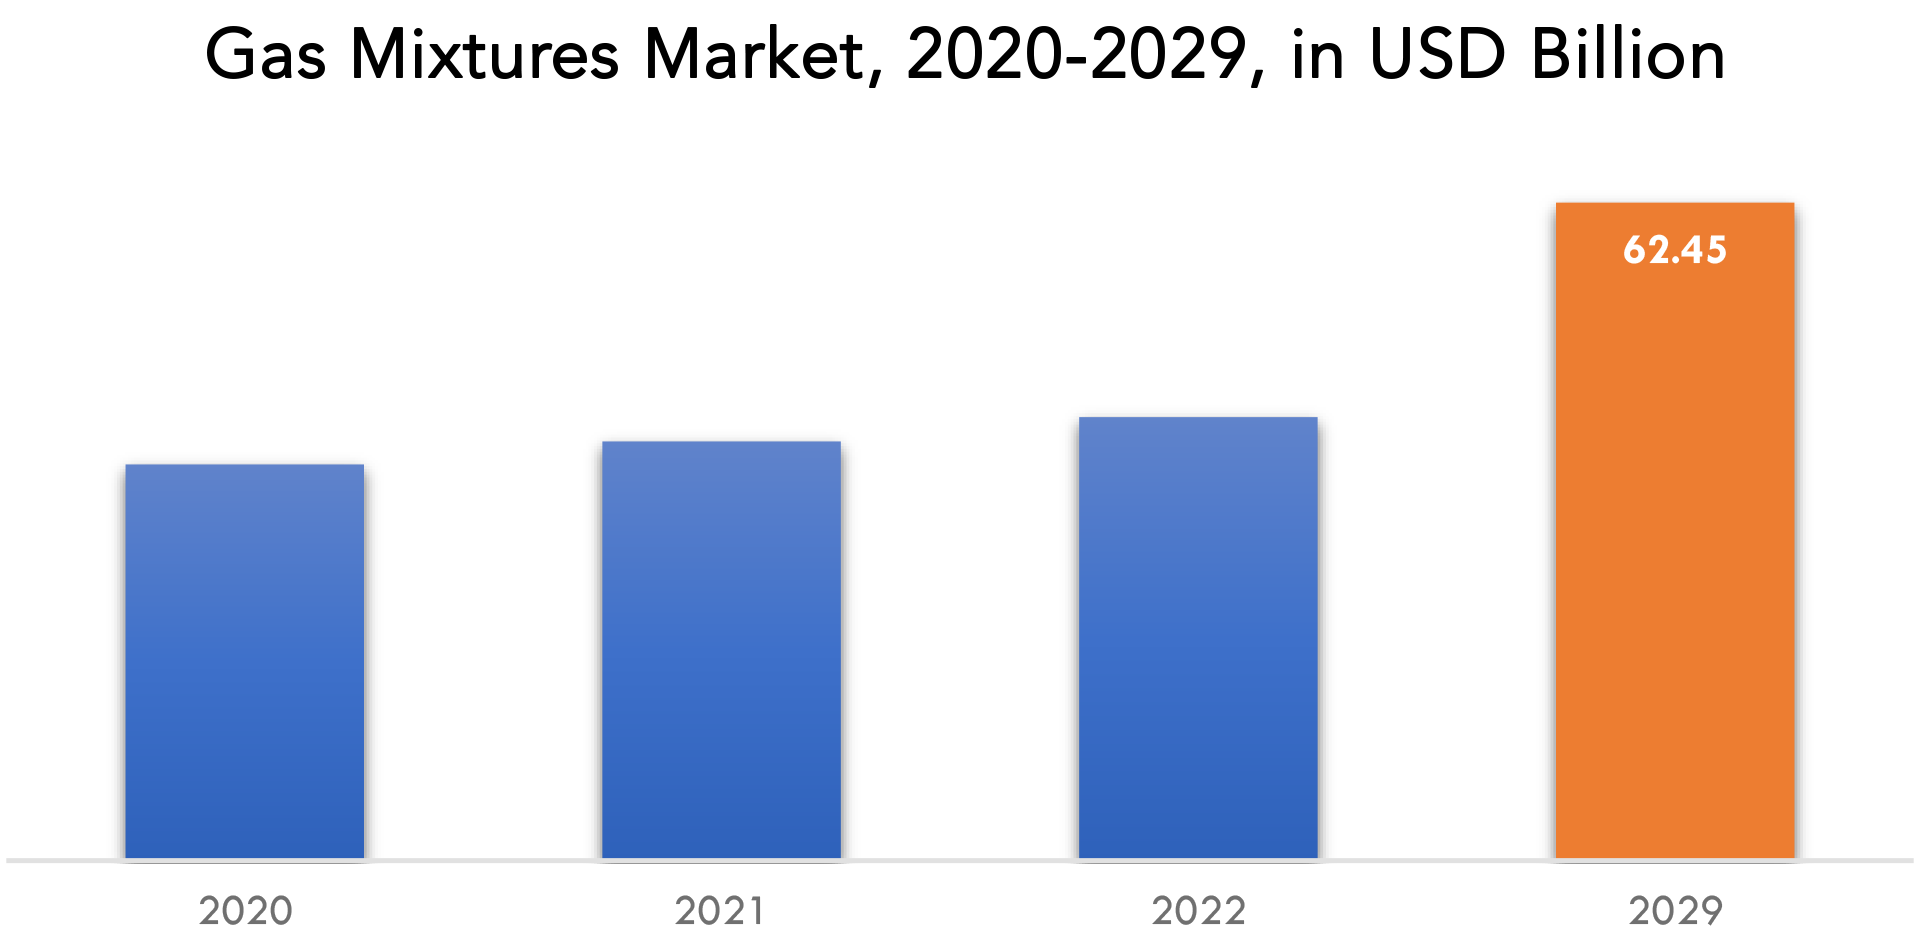
Gas Mixtures Market Players
The gas mixtures market key players include Linde Plc, Praxair Inc., Air Liquide S.A., Air Products and Chemicals, Inc., Airgas Inc., Advanced Specialty Gases Inc., Alpha Packaging, Inc, Nexair LLC, Messer Group, Welsco Inc.
For corporate expansion, these key leaders are implementing strategic formulations such as new product development and commercialization, commercial expansion, and distribution agreements. Moreover, these participants are substantially spending on product development, which is fueling revenue generation. Recent News July 2023- Linde announced it had started up its new on-site facility in Qinzhou, China, supplying oxygen and other industrial gases to Shanghai Huayi's new chemical complex. November 2022 - ET, Rob Tessier, Airgas’ National Director of Advanced Fabrication Technologies and an Air Liquide International Scientific Fellow, will lead “Welding Productivity for Welding Enthusiasts,” as part of the Welding track, to share perspective on welding economics and overcoming productivity limitations.Who Should Buy? Or Key stakeholders
- Investors
- Raw Materials Manufacturer
- Healthcare Companies
- Chemical Industries
- Electronic Manufacturer
- Supplier and Distributor
- Research Organizations
- Regulatory Authorities
- Institutional & retail players
- Others
Gas Mixtures Market Regional Analysis
The Gas Mixtures Market by region includes North America, Asia-Pacific (APAC), Europe, South America, and Middle East & Africa (MEA).
- North America: includes the US, Canada, Mexico
- Asia Pacific: includes China, Japan, South Korea, India, Australia, ASEAN, and Rest of APAC
- Europe: includes the UK, Germany, France, Italy, Spain, Russia, and the Rest of Europe
- South America: includes Brazil, Argentina, and Rest of South America
- Middle East & Africa: includes Turkey, UAE, Saudi Arabia, South Africa, and the Rest of MEA
North America is the largest markets for gas mixtures. The growth of the market in this region is driven by the presence of a large number of end-use industries, such as healthcare, electronics, and chemicals. The demand for gas mixtures in the healthcare industry is expected to grow due to the increasing prevalence of respiratory diseases and the aging population. In addition, the increasing demand for high-purity gases in the semiconductor industry is expected to drive the growth of the gas mixtures market in this region.
Asia Pacific is the fastest-growing market for gas mixtures. The growth of the market in this region is driven by the increasing demand for gas mixtures in various end-use industries, such as electronics, healthcare, and chemicals. The rapid industrialization and urbanization in countries such as China and India are also expected to drive the growth of the gas mixtures market in this region.
[caption id="attachment_18125" align="aligncenter" width="1920"]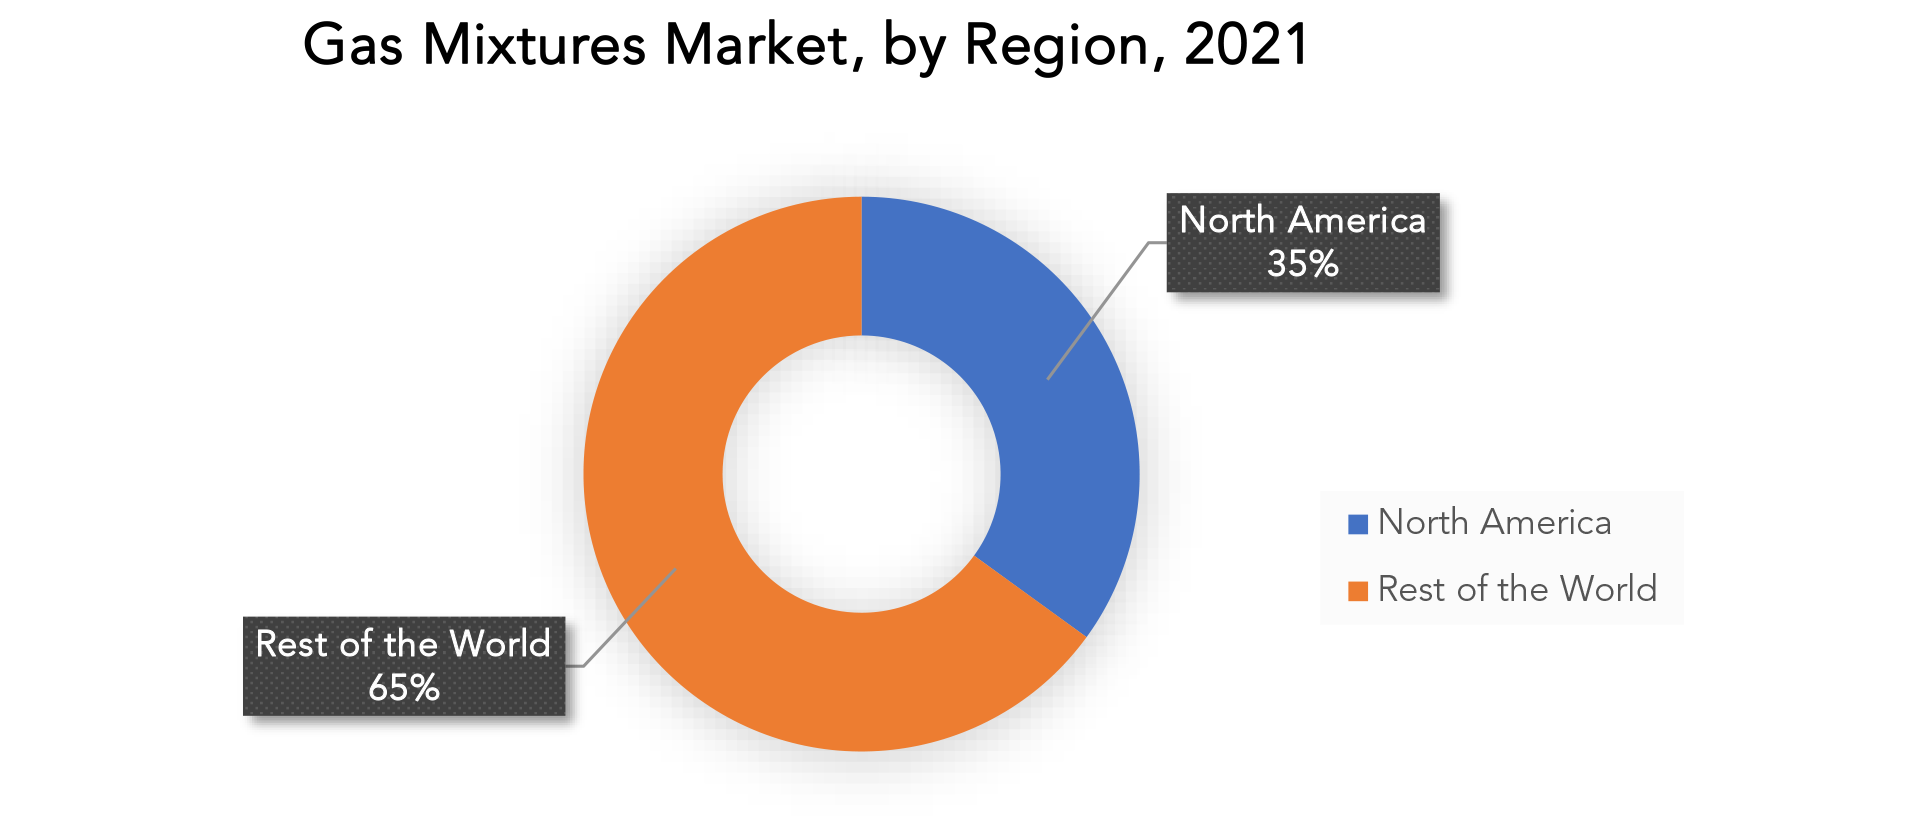
Key Market Segments: Gas Mixtures Market
Gas Mixtures Market by Mixture, 2020-2029, (USD Billion), (Kilotons)- Oxygen Mixtures
- Nitrogen Mixtures
- Carbon Dioxide Mixtures
- Argon Mixtures
- Hydrogen Mixtures
- Specialty Gas Mixtures
- Fabrication
- Chemical
- Medical & Healthcare
- Food & Beverage
- Electronics
- North America
- Asia Pacific
- Europe
- South America
- Middle East And Africa
Exactitude Consultancy Services Key Objectives
- Increasing sales and market share
- Developing new technology
- Improving profitability
- Entering new markets
- Enhancing brand reputation
Key Question Answered
- What is the expected growth rate of the gas mixtures market over the next 7 years?
- Who are the major players in the gas mixtures market and what is their market share?
- What are the end-user industries driving demand for market and what is their outlook?
- What are the opportunities for growth in emerging markets such as Asia-Pacific, Middle East, and Africa?
- How is the economic environment affecting the gas mixtures market, including factors such as interest rates, inflation, and exchange rates?
- What is the expected impact of government policies and regulations on the gas mixtures market?
- What is the current and forecasted size and growth rate of the global gas mixtures market?
- What are the key drivers of growth in the gas mixtures market?
- What are the distribution channels and supply chain dynamics in the gas mixtures market?
- What are the technological advancements and innovations in the gas mixtures market and their impact on product development and growth?
- What are the regulatory considerations and their impact on the market?
- What are the challenges faced by players in the gas mixtures market and how are they addressing these challenges?
- What are the opportunities for growth and expansion in the gas mixtures market?
- What are the product offerings and specifications of leading players in the market?
- What is the pricing trend of gas mixtures in the market and what is the impact of raw material prices on the price trend?
- INTRODUCTION
- MARKET DEFINITION
- MARKET SEGMENTATION
- RESEARCH TIMELINES
- ASSUMPTIONS AND LIMITATIONS
- RESEARCH METHODOLOGY
- DATA MINING
- SECONDARY RESEARCH
- PRIMARY RESEARCH
- SUBJECT-MATTER EXPERTS’ ADVICE
- QUALITY CHECKS
- FINAL REVIEW
- DATA TRIANGULATION
- BOTTOM-UP APPROACH
- TOP-DOWN APPROACH
- RESEARCH FLOW
- DATA SOURCES
- DATA MINING
- EXECUTIVE SUMMARY
- MARKET OVERVIEW
- GLOBAL GAS MIXTURES MARKET OUTLOOK
- MARKET DRIVERS
- MARKET RESTRAINTS
- MARKET OPPORTUNITIES
- IMPACT OF COVID-19 ON GAS MIXTURES MARKET
- PORTER’S FIVE FORCES MODEL
- THREAT FROM NEW ENTRANTS
- THREAT FROM SUBSTITUTES
- BARGAINING POWER OF SUPPLIERS
- BARGAINING POWER OF CUSTOMERS
- DEGREE OF COMPETITION
- INDUSTRY VALUE CHAIN ANALYSIS
- GLOBAL GAS MIXTURES MARKET OUTLOOK
- GLOBAL GAS MIXTURES MARKET BY MIXTURE, 2020-2029, (USD BILLION), (KILOTONS)
- OXYGEN MIXTURES
- NITROGEN MIXTURES
- CARBON DIOXIDE MIXTURES
- ARGON MIXTURES
- HYDROGEN MIXTURES
- SPECIALTY GAS MIXTURES
- GLOBAL GAS MIXTURES MARKET BY END USER, 2020-2029, (USD BILLION), (KILOTONS)
- FABRICATION
- CHEMICAL
- MEDICAL & HEALTHCARE
- FOOD & BEVERAGE
- ELECTRONICS
- GLOBAL GAS MIXTURES MARKET BY REGION, 2020-2029, (USD BILLION), (KILOTONS)
- NORTH AMERICA
- US
- CANADA
- MEXICO
- SOUTH AMERICA
- BRAZIL
- ARGENTINA
- COLOMBIA
- REST OF SOUTH AMERICA
- EUROPE
- GERMANY
- UK
- FRANCE
- ITALY
- SPAIN
- RUSSIA
- REST OF EUROPE
- ASIA PACIFIC
- INDIA
- CHINA
- JAPAN
- SOUTH KOREA
- AUSTRALIA
- SOUTH-EAST ASIA
- REST OF ASIA PACIFIC
- MIDDLE EAST AND AFRICA
- UAE
- SAUDI ARABIA
- SOUTH AFRICA
- REST OF MIDDLE EAST AND AFRICA
- NORTH AMERICA
- COMPANY PROFILES* (BUSINESS OVERVIEW, COMPANY SNAPSHOT, PRODUCTS OFFERED, RECENT DEVELOPMENTS)
- LINDE PLC
- PRAXAIR INC.
- AIR LIQUIDE S.A.
- AIR MIXTURES AND CHEMICALS INC.
- AIRGAS INC.
- ADVANCED SPECIALTY GASES INC.
- ALPHA PACKAGING INC
- NEXAIR LLC
- MESSER GROUP
- WELSCO INC. *THE COMPANY LIST IS INDICATIVE
LIST OF TABLES
TABLE 1 GLOBAL GAS MIXTURES MARKET BY MIXTURE (USD BILLION), 2020-2029
TABLE 2 GLOBAL GAS MIXTURES MARKET BY MIXTURE (KILOTONS), 2020-2029
TABLE 3 GLOBAL GAS MIXTURES MARKET BY END USER (USD BILLION), 2020-2029
TABLE 4 GLOBAL GAS MIXTURES MARKET BY END USER (KILOTONS), 2020-2029
TABLE 5 GLOBAL GAS MIXTURES MARKET BY REGION (USD BILLION), 2020-2029
TABLE 6 GLOBAL GAS MIXTURES MARKET BY REGION (KILOTONS), 2020-2029
TABLE 7 NORTH AMERICA GAS MIXTURES MARKET BY MIXTURE (USD BILLION), 2020-2029
TABLE 8 NORTH AMERICA GAS MIXTURES MARKET BY MIXTURE (KILOTONS), 2020-2029
TABLE 9 NORTH AMERICA GAS MIXTURES MARKET BY END USER (USD BILLION), 2020-2029
TABLE 10 NORTH AMERICA GAS MIXTURES MARKET BY END USER (KILOTONS), 2020-2029
TABLE 11 NORTH AMERICA GAS MIXTURES MARKET BY COUNTRY (USD BILLION), 2020-2029
TABLE 12 NORTH AMERICA GAS MIXTURES MARKET BY COUNTRY (KILOTONS), 2020-2029
TABLE 13 US GAS MIXTURES MARKET BY MIXTURE (USD BILLION), 2020-2029
TABLE 14 US GAS MIXTURES MARKET BY MIXTURE (KILOTONS), 2020-2029
TABLE 15 US GAS MIXTURES MARKET BY END USER (USD BILLION), 2020-2029
TABLE 16 US GAS MIXTURES MARKET BY END USER (KILOTONS), 2020-2029
TABLE 17 CANADA GAS MIXTURES MARKET BY MIXTURE (USD BILLION), 2020-2029
TABLE 18 CANADA GAS MIXTURES MARKET BY MIXTURE (KILOTONS), 2020-2029
TABLE 19 CANADA GAS MIXTURES MARKET BY END USER (USD BILLION), 2020-2029
TABLE 20 CANADA GAS MIXTURES MARKET BY END USER (KILOTONS), 2020-2029
TABLE 21 MEXICO GAS MIXTURES MARKET BY MIXTURE (USD BILLION), 2020-2029
TABLE 22 MEXICO GAS MIXTURES MARKET BY MIXTURE (KILOTONS), 2020-2029
TABLE 23 MEXICO GAS MIXTURES MARKET BY END USER (USD BILLION), 2020-2029
TABLE 24 MEXICO GAS MIXTURES MARKET BY END USER (KILOTONS), 2020-2029
TABLE 25 SOUTH AMERICA GAS MIXTURES MARKET BY MIXTURE (USD BILLION), 2020-2029
TABLE 26 SOUTH AMERICA GAS MIXTURES MARKET BY MIXTURE (KILOTONS), 2020-2029
TABLE 27 SOUTH AMERICA GAS MIXTURES MARKET BY COUNTRY (USD BILLION), 2020-2029
TABLE 28 SOUTH AMERICA GAS MIXTURES MARKET BY COUNTRY (KILOTONS), 2020-2029
TABLE 29 SOUTH AMERICA GAS MIXTURES MARKET BY END USER (USD BILLION), 2020-2029
TABLE 30 SOUTH AMERICA GAS MIXTURES MARKET BY END USER (KILOTONS), 2020-2029
TABLE 31 BRAZIL GAS MIXTURES MARKET BY MIXTURE (USD BILLION), 2020-2029
TABLE 32 BRAZIL GAS MIXTURES MARKET BY MIXTURE (KILOTONS), 2020-2029
TABLE 33 BRAZIL GAS MIXTURES MARKET BY END USER (USD BILLION), 2020-2029
TABLE 34 BRAZIL GAS MIXTURES MARKET BY END USER (KILOTONS), 2020-2029
TABLE 35 ARGENTINA GAS MIXTURES MARKET BY MIXTURE (USD BILLION), 2020-2029
TABLE 36 ARGENTINA GAS MIXTURES MARKET BY MIXTURE (KILOTONS), 2020-2029
TABLE 37 ARGENTINA GAS MIXTURES MARKET BY END USER (USD BILLION), 2020-2029
TABLE 38 ARGENTINA GAS MIXTURES MARKET BY END USER (KILOTONS), 2020-2029
TABLE 39 COLOMBIA GAS MIXTURES MARKET BY MIXTURE (USD BILLION), 2020-2029
TABLE 40 COLOMBIA GAS MIXTURES MARKET BY MIXTURE (KILOTONS), 2020-2029
TABLE 41 COLOMBIA GAS MIXTURES MARKET BY END USER (USD BILLION), 2020-2029
TABLE 42 COLOMBIA GAS MIXTURES MARKET BY END USER (KILOTONS), 2020-2029
TABLE 43 REST OF SOUTH AMERICA GAS MIXTURES MARKET BY MIXTURE (USD BILLION), 2020-2029
TABLE 44 REST OF SOUTH AMERICA GAS MIXTURES MARKET BY MIXTURE (KILOTONS), 2020-2029
TABLE 45 REST OF SOUTH AMERICA GAS MIXTURES MARKET BY END USER (USD BILLION), 2020-2029
TABLE 46 REST OF SOUTH AMERICA GAS MIXTURES MARKET BY END USER (KILOTONS), 2020-2029
TABLE 47 ASIA-PACIFIC GAS MIXTURES MARKET BY MIXTURE (USD BILLION), 2020-2029
TABLE 48 ASIA-PACIFIC GAS MIXTURES MARKET BY MIXTURE (KILOTONS), 2020-2029
TABLE 49 ASIA-PACIFIC GAS MIXTURES MARKET BY END USER (USD BILLION), 2020-2029
TABLE 50 ASIA-PACIFIC GAS MIXTURES MARKET BY END USER (KILOTONS), 2020-2029
TABLE 51 ASIA-PACIFIC GAS MIXTURES MARKET BY COUNTRY (USD BILLION), 2020-2029
TABLE 52 ASIA-PACIFIC GAS MIXTURES MARKET BY COUNTRY (KILOTONS), 2020-2029
TABLE 53 INDIA GAS MIXTURES MARKET BY MIXTURE (USD BILLION), 2020-2029
TABLE 54 INDIA GAS MIXTURES MARKET BY MIXTURE (KILOTONS), 2020-2029
TABLE 55 INDIA GAS MIXTURES MARKET BY END USER (USD BILLION), 2020-2029
TABLE 56 INDIA GAS MIXTURES MARKET BY END USER (KILOTONS), 2020-2029
TABLE 57 CHINA GAS MIXTURES MARKET BY MIXTURE (USD BILLION), 2020-2029
TABLE 58 CHINA GAS MIXTURES MARKET BY MIXTURE (KILOTONS), 2020-2029
TABLE 59 CHINA GAS MIXTURES MARKET BY END USER (USD BILLION), 2020-2029
TABLE 60 CHINA GAS MIXTURES MARKET BY END USER (KILOTONS), 2020-2029
TABLE 61 JAPAN GAS MIXTURES MARKET BY MIXTURE (USD BILLION), 2020-2029
TABLE 62 JAPAN GAS MIXTURES MARKET BY MIXTURE (KILOTONS), 2020-2029
TABLE 63 JAPAN GAS MIXTURES MARKET BY END USER (USD BILLION), 2020-2029
TABLE 64 JAPAN GAS MIXTURES MARKET BY END USER (KILOTONS), 2020-2029
TABLE 65 SOUTH KOREA GAS MIXTURES MARKET BY MIXTURE (USD BILLION), 2020-2029
TABLE 66 SOUTH KOREA GAS MIXTURES MARKET BY MIXTURE (KILOTONS), 2020-2029
TABLE 67 SOUTH KOREA GAS MIXTURES MARKET BY END USER (USD BILLION), 2020-2029
TABLE 68 SOUTH KOREA GAS MIXTURES MARKET BY END USER (KILOTONS), 2020-2029
TABLE 69 AUSTRALIA GAS MIXTURES MARKET BY MIXTURE (USD BILLION), 2020-2029
TABLE 70 AUSTRALIA GAS MIXTURES MARKET BY MIXTURE (KILOTONS), 2020-2029
TABLE 71 AUSTRALIA GAS MIXTURES MARKET BY END USER (USD BILLION), 2020-2029
TABLE 72 AUSTRALIA GAS MIXTURES MARKET BY END USER (KILOTONS), 2020-2029
TABLE 73 SOUTH EAST ASIA GAS MIXTURES MARKET BY MIXTURE (USD BILLION), 2020-2029
TABLE 74 SOUTH EAST ASIA GAS MIXTURES MARKET BY MIXTURE (KILOTONS), 2020-2029
TABLE 75 SOUTH EAST ASIA GAS MIXTURES MARKET BY END USER (USD BILLION), 2020-2029
TABLE 76 SOUTH EAST ASIA GAS MIXTURES MARKET BY END USER (KILOTONS), 2020-2029
TABLE 77 REST OF ASIA PACIFIC GAS MIXTURES MARKET BY MIXTURE (USD BILLION), 2020-2029
TABLE 78 REST OF ASIA PACIFIC GAS MIXTURES MARKET BY MIXTURE (KILOTONS), 2020-2029
TABLE 79 REST OF ASIA PACIFIC GAS MIXTURES MARKET BY END USER (USD BILLION), 2020-2029
TABLE 80 REST OF ASIA PACIFIC GAS MIXTURES MARKET BY END USER (KILOTONS), 2020-2029
TABLE 81 EUROPE GAS MIXTURES MARKET BY MIXTURE (USD BILLION), 2020-2029
TABLE 82 EUROPE GAS MIXTURES MARKET BY MIXTURE (KILOTONS), 2020-2029
TABLE 83 EUROPE GAS MIXTURES MARKET BY END USER (USD BILLION), 2020-2029
TABLE 84 EUROPE GAS MIXTURES MARKET BY END USER (KILOTONS), 2020-2029
TABLE 85 EUROPE GAS MIXTURES MARKET BY COUNTRY (USD BILLION), 2020-2029
TABLE 86 EUROPE GAS MIXTURES MARKET BY COUNTRY (KILOTONS), 2020-2029
TABLE 87 GERMANY GAS MIXTURES MARKET BY MIXTURE (USD BILLION), 2020-2029
TABLE 88 GERMANY GAS MIXTURES MARKET BY MIXTURE (KILOTONS), 2020-2029
TABLE 89 GERMANY GAS MIXTURES MARKET BY END USER (USD BILLION), 2020-2029
TABLE 90 GERMANY GAS MIXTURES MARKET BY END USER (KILOTONS), 2020-2029
TABLE 91 UK GAS MIXTURES MARKET BY MIXTURE (USD BILLION), 2020-2029
TABLE 92 UK GAS MIXTURES MARKET BY MIXTURE (KILOTONS), 2020-2029
TABLE 93 UK GAS MIXTURES MARKET BY END USER (USD BILLION), 2020-2029
TABLE 94 UK GAS MIXTURES MARKET BY END USER (KILOTONS), 2020-2029
TABLE 95 FRANCE GAS MIXTURES MARKET BY MIXTURE (USD BILLION), 2020-2029
TABLE 96 FRANCE GAS MIXTURES MARKET BY MIXTURE (KILOTONS), 2020-2029
TABLE 97 FRANCE GAS MIXTURES MARKET BY END USER (USD BILLION), 2020-2029
TABLE 98 FRANCE GAS MIXTURES MARKET BY END USER (KILOTONS), 2020-2029
TABLE 99 ITALY GAS MIXTURES MARKET BY MIXTURE (USD BILLION), 2020-2029
TABLE 100 ITALY GAS MIXTURES MARKET BY MIXTURE (KILOTONS), 2020-2029
TABLE 101 ITALY GAS MIXTURES MARKET BY END USER (USD BILLION), 2020-2029
TABLE 102 ITALY GAS MIXTURES MARKET BY END USER (KILOTONS), 2020-2029
TABLE 103 SPAIN GAS MIXTURES MARKET BY MIXTURE (USD BILLION), 2020-2029
TABLE 104 SPAIN GAS MIXTURES MARKET BY MIXTURE (KILOTONS), 2020-2029
TABLE 105 SPAIN GAS MIXTURES MARKET BY END USER (USD BILLION), 2020-2029
TABLE 106 SPAIN GAS MIXTURES MARKET BY END USER (KILOTONS), 2020-2029
TABLE 107 RUSSIA GAS MIXTURES MARKET BY MIXTURE (USD BILLION), 2020-2029
TABLE 108 RUSSIA GAS MIXTURES MARKET BY MIXTURE (KILOTONS), 2020-2029
TABLE 109 RUSSIA GAS MIXTURES MARKET BY END USER (USD BILLION), 2020-2029
TABLE 110 RUSSIA GAS MIXTURES MARKET BY END USER (KILOTONS), 2020-2029
TABLE 111 REST OF EUROPE GAS MIXTURES MARKET BY MIXTURE (USD BILLION), 2020-2029
TABLE 112 REST OF EUROPE GAS MIXTURES MARKET BY MIXTURE (KILOTONS), 2020-2029
TABLE 113 REST OF EUROPE GAS MIXTURES MARKET BY END USER (USD BILLION), 2020-2029
TABLE 114 REST OF EUROPE GAS MIXTURES MARKET BY END USER (KILOTONS), 2020-2029
TABLE 115 MIDDLE EAST AND AFRICA GAS MIXTURES MARKET BY MIXTURE (USD BILLION), 2020-2029
TABLE 116 MIDDLE EAST AND AFRICA GAS MIXTURES MARKET BY MIXTURE (KILOTONS), 2020-2029
TABLE 117 MIDDLE EAST AND AFRICA GAS MIXTURES MARKET BY END USER (USD BILLION), 2020-2029
TABLE 118 MIDDLE EAST AND AFRICA GAS MIXTURES MARKET BY END USER (KILOTONS), 2020-2029
TABLE 119 MIDDLE EAST AND AFRICA GAS MIXTURES MARKET BY COUNTRY (USD BILLION), 2020-2029
TABLE 120 MIDDLE EAST AND AFRICA GAS MIXTURES MARKET BY COUNTRY (KILOTONS), 2020-2029
TABLE 121 UAE GAS MIXTURES MARKET BY MIXTURE (USD BILLION), 2020-2029
TABLE 122 UAE GAS MIXTURES MARKET BY MIXTURE (KILOTONS), 2020-2029
TABLE 123 UAE GAS MIXTURES MARKET BY END USER (USD BILLION), 2020-2029
TABLE 124 UAE GAS MIXTURES MARKET BY END USER (KILOTONS), 2020-2029
TABLE 125 SAUDI ARABIA GAS MIXTURES MARKET BY MIXTURE (USD BILLION), 2020-2029
TABLE 126 SAUDI ARABIA GAS MIXTURES MARKET BY MIXTURE (KILOTONS), 2020-2029
TABLE 127 SAUDI ARABIA GAS MIXTURES MARKET BY END USER (USD BILLION), 2020-2029
TABLE 128 SAUDI ARABIA GAS MIXTURES MARKET BY END USER (KILOTONS), 2020-2029
TABLE 129 SOUTH AFRICA GAS MIXTURES MARKET BY MIXTURE (USD BILLION), 2020-2029
TABLE 130 SOUTH AFRICA GAS MIXTURES MARKET BY MIXTURE (KILOTONS), 2020-2029
TABLE 131 SOUTH AFRICA GAS MIXTURES MARKET BY END USER (USD BILLION), 2020-2029
TABLE 132 SOUTH AFRICA GAS MIXTURES MARKET BY END USER (KILOTONS), 2020-2029
TABLE 133 REST OF MIDDLE EAST AND AFRICA GAS MIXTURES MARKET BY MIXTURE (USD BILLION), 2020-2029
TABLE 134 REST OF MIDDLE EAST AND AFRICA GAS MIXTURES MARKET BY MIXTURE (KILOTONS), 2020-2029
TABLE 135 REST OF MIDDLE EAST AND AFRICA GAS MIXTURES MARKET BY END USER (USD BILLION), 2020-2029
TABLE 136 REST OF MIDDLE EAST AND AFRICA GAS MIXTURES MARKET BY END USER (KILOTONS), 2020-2029
LIST OF FIGURES
FIGURE 1 MARKET DYNAMICS
FIGURE 2 MARKET SEGMENTATION
FIGURE 3 REPORT TIMELINES: YEARS CONSIDERED
FIGURE 4 DATA TRIANGULATION
FIGURE 5 BOTTOM-UP APPROACH
FIGURE 6 TOP-DOWN APPROACH
FIGURE 7 RESEARCH FLOW
FIGURE 8 GLOBAL GAS MIXTURES BY MIXTURE, USD BILLION, 2020-2029
FIGURE 9 GLOBAL GAS MIXTURES BY END USER, USD BILLION, 2020-2029
FIGURE 10 GLOBAL GAS MIXTURES BY REGION, USD BILLION, 2020-2029
FIGURE 11 PORTER’S FIVE FORCES MODEL
FIGURE 12 GLOBAL GAS MIXTURES BY MIXTURE, USD BILLION, 2021
FIGURE 13 GLOBAL GAS MIXTURES BY END USER, USD BILLION, 2021
FIGURE 14 GLOBAL GAS MIXTURES BY REGION, USD BILLION, 2021
FIGURE 15 MARKET SHARE ANALYSIS
FIGURE 16 LINDE PLC: COMPANY SNAPSHOT
FIGURE 17 PRAXAIR INC.: COMPANY SNAPSHOT
FIGURE 18 THERMO FISHER SCIENTIFIC INC.: COMPANY SNAPSHOT
FIGURE 19 AIR LIQUIDE S.A.: COMPANY SNAPSHOT
FIGURE 20 AIR PRODUCTS AND CHEMICALS INC.: COMPANY SNAPSHOT
FIGURE 21 AIRGAS INC.: COMPANY SNAPSHOT
FIGURE 22 ADVANCED SPECIALTY GASES INC.: COMPANY SNAPSHOT
FIGURE 23 ALPHA PACKAGING INC.: COMPANY SNAPSHOT
FIGURE 24 NEXAIR LLC: COMPANY SNAPSHOT
FIGURE 25 MESSER GROUP: COMPANY SNAPSHOT
FIGURE 26 WELSCO INC.: COMPANY SNAPSHOT
DOWNLOAD FREE SAMPLE REPORT
License Type
SPEAK WITH OUR ANALYST
Want to know more about the report or any specific requirement?
WANT TO CUSTOMIZE THE REPORT?
Our Clients Speak
We asked them to research ‘ Equipment market’ all over the world, and their whole arrangement was helpful to us. thehealthanalytics.com insightful analysis and reports contributed to our current analysis and in creating a future strategy. Besides, the te
Yosuke Mitsui
Senior Associate Construction Equipment Sales & Marketing
We asked them to research ‘Equipment market’ all over the world, and their whole arrangement was helpful to us. thehealthanalytics.com insightful analysis and reports contributed to our current analysis and in creating a future strategy. Besides, the te


