

Base Year Value ()
x.x %
x.x %
CAGR ()
x.x %
x.x %
Forecast Year Value ()
x.x %
x.x %
Historical Data Period
Largest Region
Forecast Period
CubeSat Market by Size (25U to 1U,1U to 3U,3U to 6U,6U to 12U,12U, and Above) Subsystem (Payloads, Structures, Electrical Power Systems, Command and Data Handling, Propulsion Systems, Attitude Determination, and Control Systems) Application (Earth Observation and Traffic Monitoring, Science, Technology, and Education, Space Observation, Communication) End User (Government and Military, Commercial, Non-profit Organizations) and by Region Global Trends and Forecast from 2023 to 2029
Instant access to hundreds of data points and trends
- Market estimates from 2014-2029
- Competitive analysis, industry segmentation, financial benchmarks
- Incorporates SWOT, Porter's Five Forces and risk management frameworks
- PDF report or online database with Word, Excel and PowerPoint export options
- 100% money back guarantee
CubeSat Market Overview
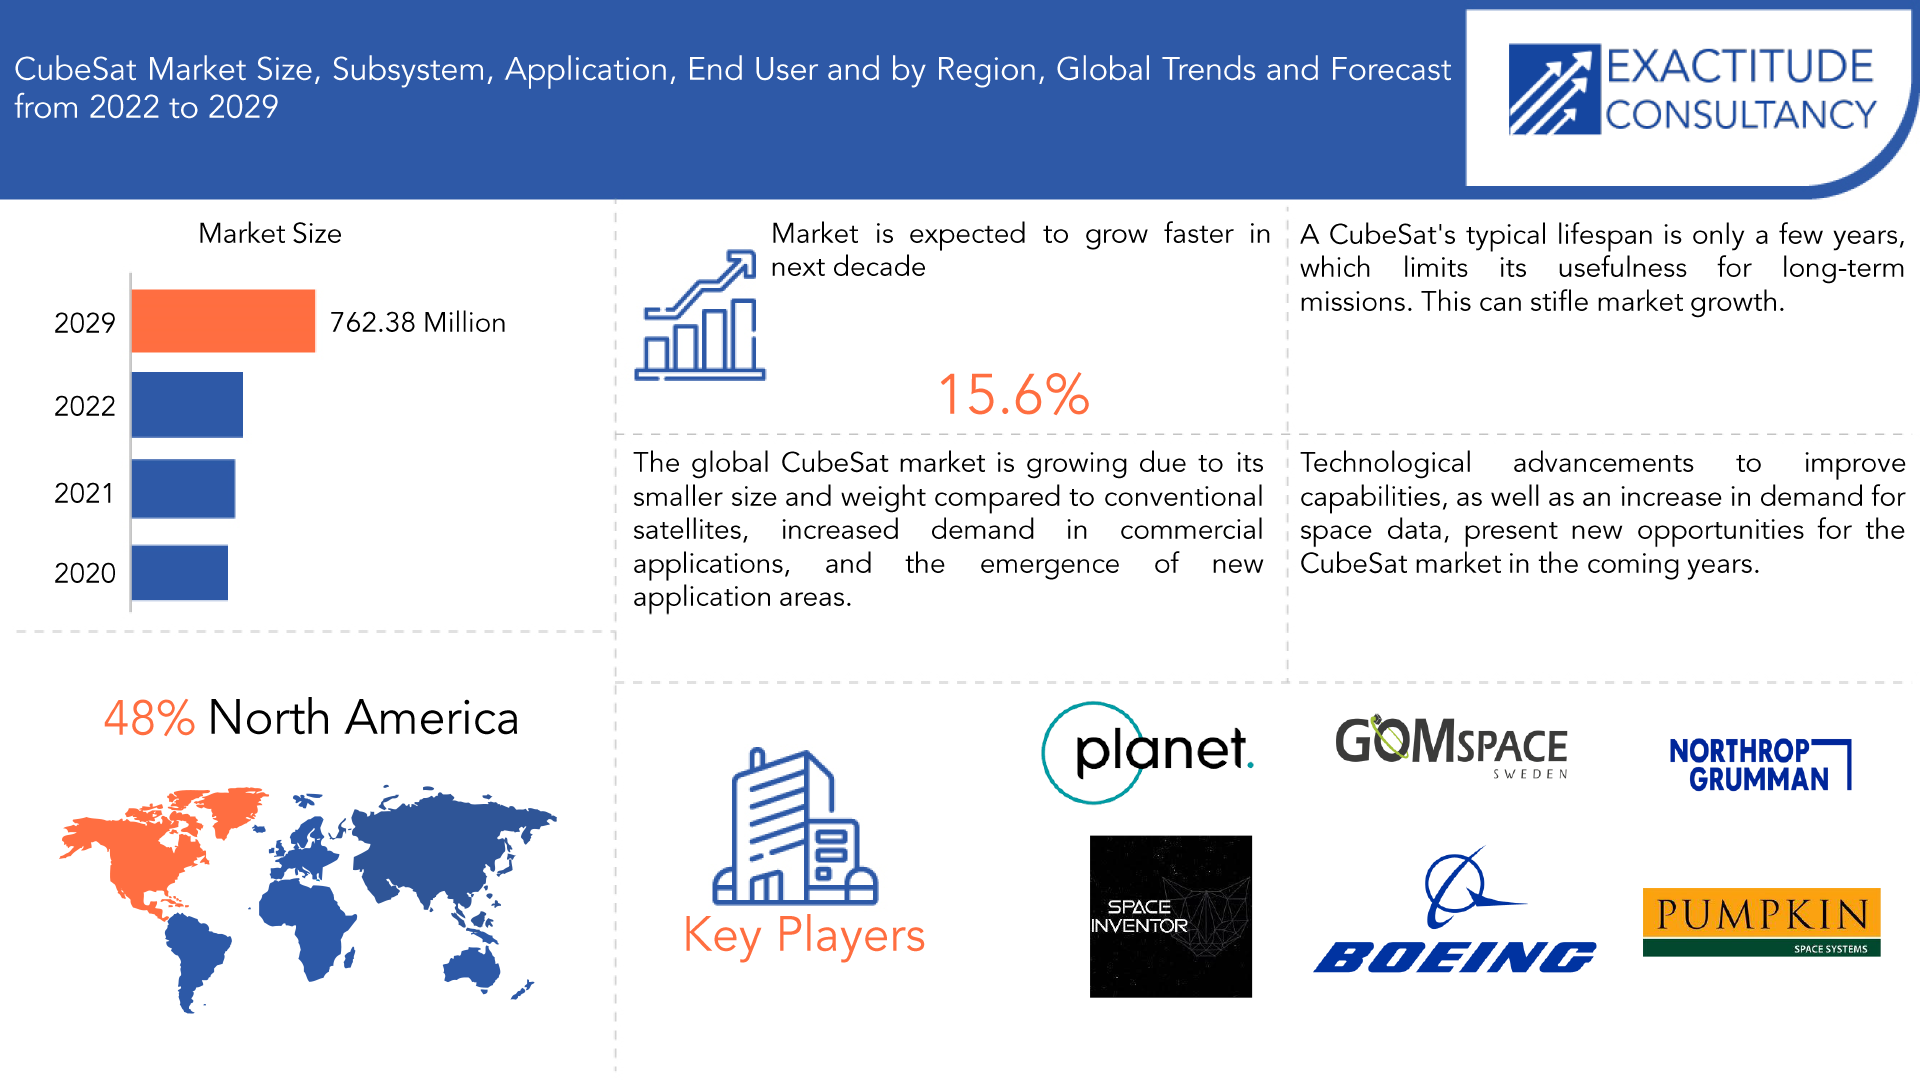
The global CubeSat market size was valued at USD 206.8 million in 2022 and is projected to reach USD 762.38 million by 2029, with a CAGR of 15.6% from 2023 to 2029.
CubeSats are small satellites that are much easier to design, develop, and launch than traditional satellites. CubeSats can be built in a variety of configurations, including single units (1U), double units (2U), and four units (4U). CubeSats have significantly transformed space exploration by providing a low-cost solution for launching satellites and conducting technology demonstrations, scientific research, and other missions. Commercial businesses, government and military agencies, and non-profit organizations all make extensive use of CubeSats.
They are low-cost solutions that have made it easier for commercial companies, non-profit organizations, and educational institutions to launch missions into low-Earth orbit. These miniaturized satellites enable several scientific studies and technology demonstrations to be conducted in space in a cost-effective, timely, and relatively simple. CubeSats are widely used for space exploration by researchers and experts all over the world. CubeSats' small size and weight make them ideal for rapid manufacturing and testing, making them an ideal and inexpensive entity for the exploration of emerging technologies and ideas.
| ATTRIBUTE | DETAILS |
| Study period | 2020-2029 |
| Base year | 2021 |
| Estimated year | 2022 |
| Forecasted year | 2022-2029 |
| Historical period | 2018-2020 |
| Unit | Value (USD Million) |
| Segmentation | By Size, By Subsystem, By Application, By End User, By Region. |
| By Size
|
|
| By Subsystem
|
|
| By Application
|
|
| By End User
|
|
| By Region
|
|
The intensifying space exploration activities are driving the global CubeSat market. CubeSats are widely used for imaging the Earth and running telecommunications systems. Furthermore, technological advancements such as the integration of artificial intelligence (AI) and big data solutions are propelling the market growth. These technologies provide automated insights while requiring little to no human intervention. Other factors, such as the implementation of favorable government policies and the increasing demand for real-time monitoring of ships, aircraft, and automobiles, are expected to drive the market forward.
CubeSats are small, low-cost satellites that have grown in popularity in recent years due to their numerous applications and benefits. However, several market constraints are limiting the CubeSat market's growth. CubeSats have limited payload capacity, which means they can only carry a few instruments or sensors. This limits their applicability in applications requiring large or heavy instruments. CubeSats' regulatory environment is still evolving, and many regulatory hurdles must be overcome before CubeSats can be deployed for commercial or government applications. CubeSats have limited capabilities in comparison to traditional satellites, which limits their utility in some applications. CubeSats, for example, are unsuitable for high-resolution imaging or high-bandwidth communications. Overall, while CubeSats provide numerous benefits and are used in a wide range of applications, market constraints can limit their growth and impact their utility in certain applications.
The market for CubeSats is expanding beyond traditional applications like Earth observation and communication. Emerging applications like space tourism, space debris removal, and asteroid mining are opening up new markets for CubeSat manufacturers and operators. Technological advancements are allowing CubeSats to carry more advanced payloads and perform more complex missions. For example, advances in propulsion technology are allowing CubeSats to perform maneuvers and stay in orbit for longer periods. Miniaturization is allowing for the development of even smaller and more capable CubeSats, such as the PocketQube, a miniature CubeSat. This broadens the potential applications for CubeSats and opens up new avenues for innovation. In light of the aforementioned factors, the CubeSat market's future appears promising, with numerous opportunities for growth and innovation.
[caption id="attachment_18136" align="aligncenter" width="1188"]
Frequently Asked Questions
• What is the worth of the CubeSat market?
The CubeSat market is expected to reach USD 319.47 Million by the end of 2023.
• What are the upcoming trends of the CubeSat market globally?
Upcoming trends in the CubeSat market are Increased interest in deep space exploration.
• What is the CAGR of the CubeSat market?
The global CubeSat market size was valued at USD 206.8 Million in 2020 and is projected to reach USD 762.38 Million by 2029, with a CAGR of 15.6% from 2021 to 2029.
• Which are the top companies to hold the market share in the CubeSat market?
The global market is fragmented in nature with the presence of various key players such as Planet Labs Inc., Geospacer, AAC Clyde Space, Enduro sat, Surrey Satellite Technology Limited, Innovative Solutions in Space B.V., Space Inventor, Pumpkin Space Systems, CU Aerospace, L.L.C., Clyde Space Ltd., Interorbital Systems Corporation, Lockheed Martin, Boeing, Northrop Grumman
• Which is the largest regional market for the CubeSat market?
North America dominated the global industry in 2021 and accounted for the maximum share of more than 48% of the overall revenue.
CubeSat Market Segment Analysis
The global CubeSats market is divided into four categories based on size: 0.25U to 1U, 1U to 3U, 3U to 6U, 6U to 12U, and 12U and above. The market is dominated by 1U to 3U and is expected to grow at a CAGR of 15.7 during the forecast period. As a result of the increased volume and aperture requirements, 1U to 3U CubeSats are quickly becoming the first choice for use in space missions by several manufacturers. A 3U CubeSat has more than three times the power and capacity for communications and pointing of a 1U CubeSat. A 3U has a larger usable volume due to the size of standard mechanisms, connectors, and other components, and more space is available to implement panels and antennas with higher component factors.
The CubeSat market is divided into Earth observation and traffic monitoring, science and technology, and education, space observation, and communication. Earth observation and traffic monitoring accounted for more than 53% of the market in 2021 and is expected to grow at a CAGR of 15.6% during the forecast period, owing to their low cost and short development cycle, which are widely used for Earth observation applications. Increased demand for CubeSats from a variety of commercial applications, as well as new CubeSat application areas, are expected to propel the global CubeSat market forward.
On a subsystem basis, the payloads segment is expected to grow at a CAGR of 15.9% during the forecast period. Payloads enable scientists to experience enhanced space observation by providing orbital maneuvering capability.
According to the end user, the commercial segment is expected to grow with a CAGR of 15.7% during the forecast period. Increased commercial use of CubeSats for crop monitoring, fleet management, and logistics tracking is driving the market growth.
[caption id="attachment_18145" align="aligncenter" width="1920"]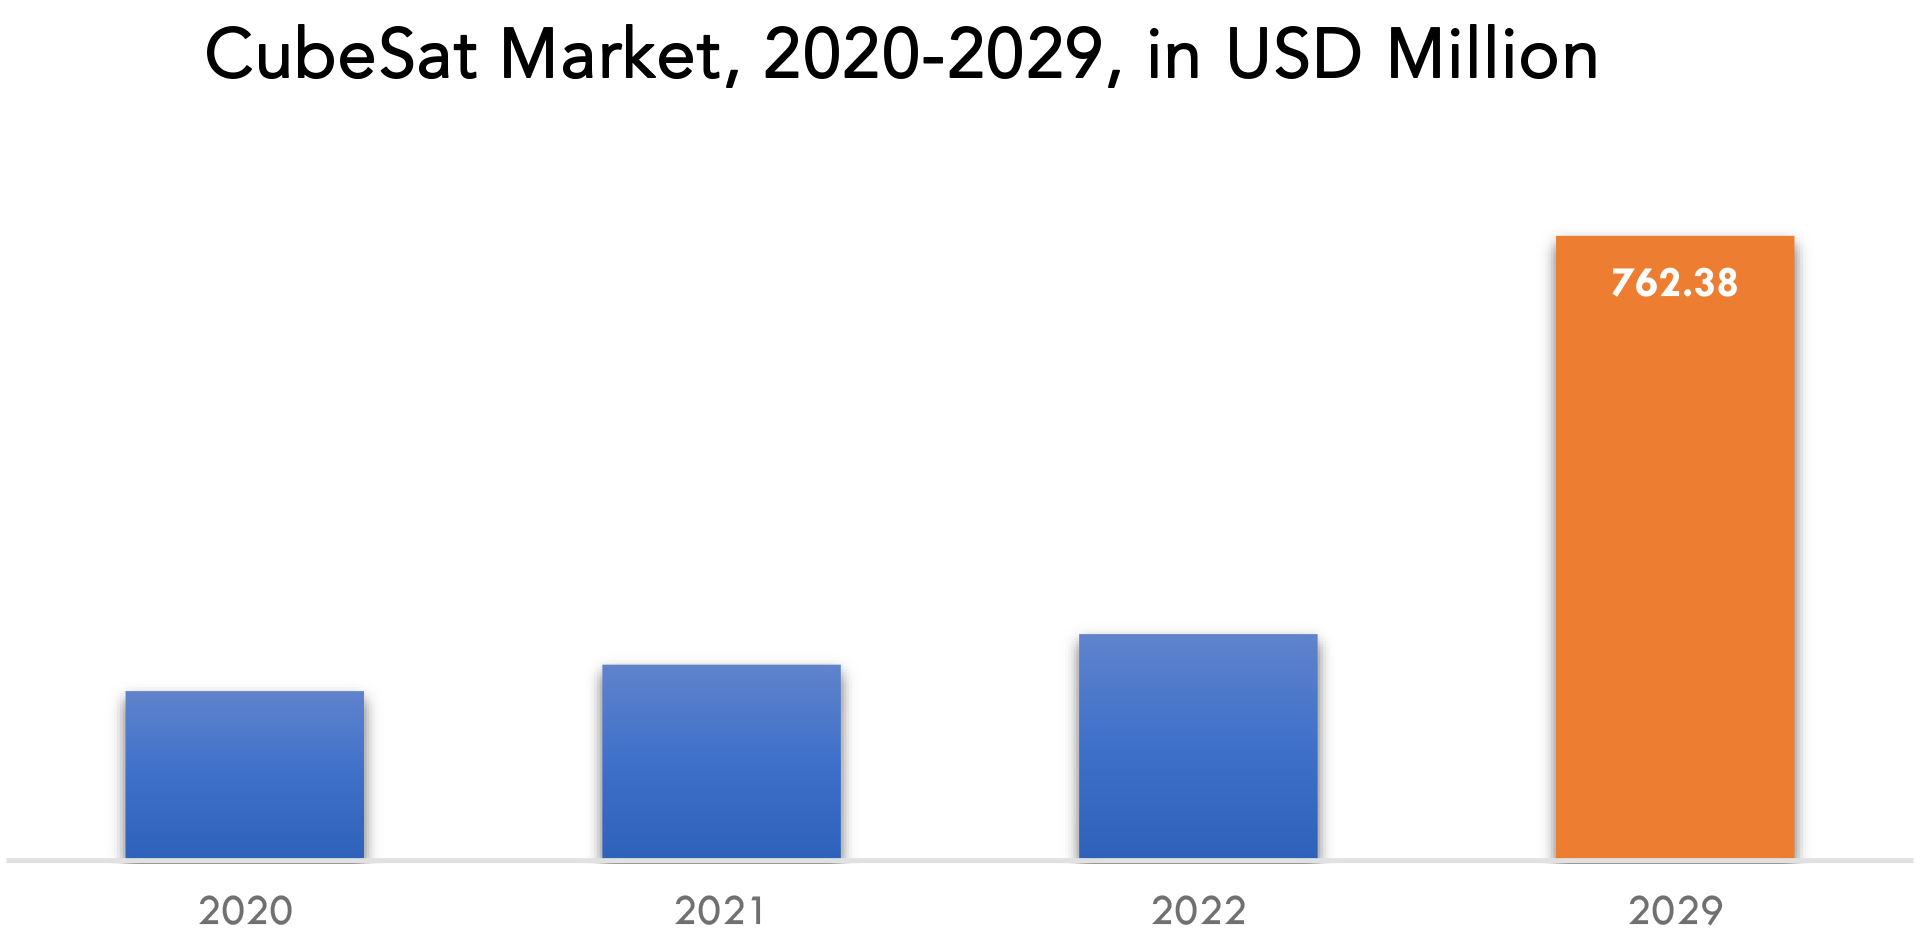
CubeSat Market Players
The global market is fragmented in nature with the presence of various key players such as Planet Labs Inc., GomSpace, AAC Clyde Space, Endurosat, Surrey Satellite Technology Limited, Innovative Solutions in Space B.V., Space Inventor, Pumpkin Space Systems, CU Aerospace, L.L.C., Clyde Space Ltd., Interorbital Systems Corporation, Lockheed Martin, Boeing, Northrop Grumman along with medium and small-scale regional players operating in different parts of the world. Major companies in the market competition in terms of application development capability, product launches, and development of new technologies for product formulation.
February 16, 2023 - Vyoma has partnered with EnduroSat to help improve the safety of satellites in orbit, to make space safer. A Memorandum of Understanding has been signed outlining how the two companies will collaborate to improve the sustainability of space activities.
October 12, 2022 - Champaign-Urbana Aerospace (CUA) has created several novel micro propulsion systems for future integration and flight on micro- and nanosatellites (also called CubeSats). Collision avoidance and deorbiting satellites contribute significantly to preventing the escalation of the growing orbital debris problem.
Who Should Buy? Or Key Stakeholders
- Space organizations
- CubeSat Manufacturers
- Satellite manufacturers
- Launch Providers
- Satellite Operators
- Government authorities
- Regulatory bodies
- Defense companies
- Research Institutes
CubeSat Market Regional Analysis
Geographically, the CubeSats market is segmented into North America, South America, Europe, APAC, and MEA.
- North America: includes the US, Canada, Mexico
- Europe: includes the UK, Germany, France, Italy, Spain, Russia, and the Rest of Europe
- Asia Pacific: includes China, Japan, South Korea, India, Australia, ASEAN, and the Rest of APAC
- South America: includes Brazil, Argentina, and the Rest of South America
- Middle East & Africa: includes Turkey, UAE, Saudi Arabia, South Africa, and the Rest of MEA
North America contributes the most revenue to the global CubeSat market, which is expected to reach USD 440.69 million by 2029, growing at a CAGR of 14.8% during the forecast period. The North American region is a significant market for CubeSats, with the United States leading the way. Government investments in CubeSats are driving the market, as is the growing demand for CubeSats in commercial applications such as remote sensing and communications.
Asia-Pacific: The Asia-Pacific region is a rapidly growing market for CubeSats, with China, Japan, and India being the region's largest markets. The growing demand for CubeSats in applications such as Earth observation, communications, and remote sensing is driving the market.
[caption id="attachment_18146" align="aligncenter" width="1920"]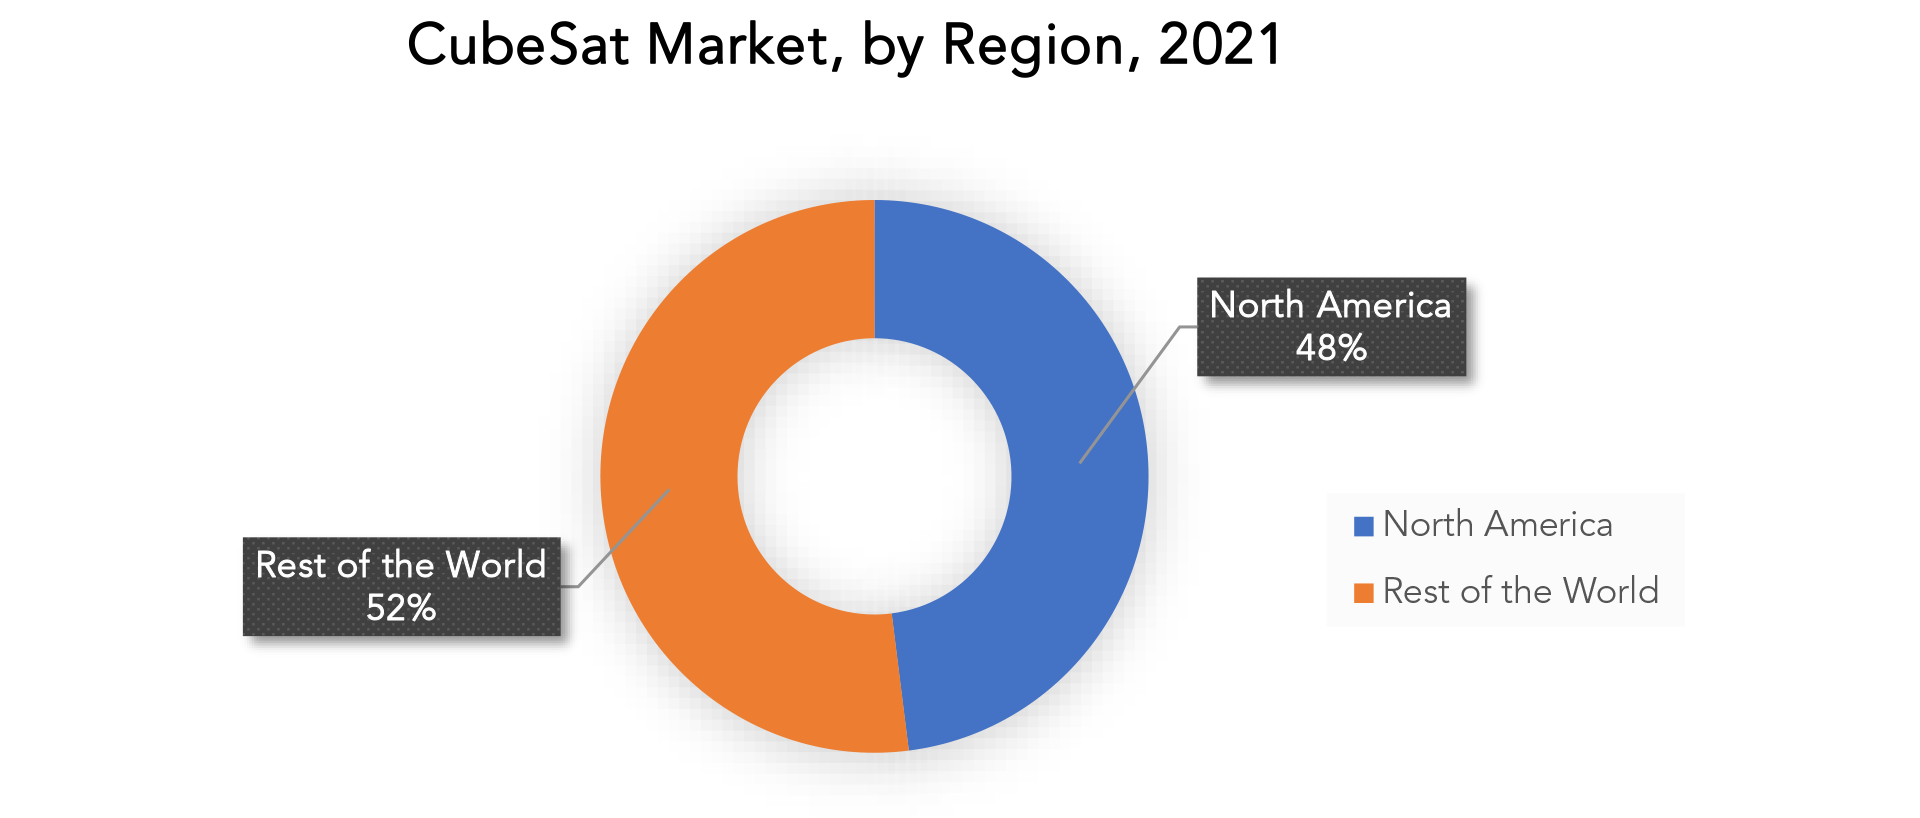
Key Market Segments: CubeSat Market
CubeSat Market By Size, 2020-2029, (USD Million)- 25u to 1u
- 1u to 3u
- 3u to 6u
- 6u to 12u
- 12u And Above
- Payloads
- Structures
- Electrical Power Systems
- Command And Data Handling
- Propulsion Systems
- Attitude Determination and Control Systems
- Earth Observation and Traffic Monitoring
- Science, Technology, And Education
- Space Observation
- Communication
- Government And Military
- Commercial
- Non-Profit Organizations
- North America
- Europe
- Asia Pacific
- South America
- Middle East and Africa
Exactitude Consultancy Services Key Objectives:
- Increasing sales and market share
- Developing new technology
- Improving profitability
- Entering new markets
- Enhancing brand reputation
Key Question Answered
- What is the expected growth rate of the CubeSat market over the next 7 years?
- Who are the major players in the CubeSat market and what is their market share?
- What are the end-user industries driving demand for the market and what is their outlook?
- What are the opportunities for growth in emerging markets such as Asia-Pacific, the Middle East, and Africa?
- How is the economic environment affecting the CubeSat market, including factors such as interest rates, inflation, and exchange rates?
- What is the expected impact of government policies and regulations on the CubeSat market?
- What is the current and forecasted size and growth rate of the global CubeSat market?
- What are the key drivers of growth in the CubeSat market?
- Who are the major players in the market and what is their market share?
- What are the distribution channels and supply chain dynamics in the CubeSat market?
- What are the technological advancements and innovations in the CubeSat market and their impact on product development and growth?
- What are the regulatory considerations and their impact on the market?
- What are the challenges faced by players in the CubeSat market and how are they addressing these challenges?
- What are the opportunities for growth and expansion in the CubeSat market?
- What are the product offerings and specifications of leading players in the market?
- What is the pricing trend of CubeSat in the market and what is the impact of raw material prices on the price trend?
- Introduction
- Market Definition
- Market Segmentation
- Research Timelines
- Assumptions and Limitations
- Research Methodology
- Data Mining
- Secondary Research
- Primary Research
- Subject-Matter Experts’ Advice
- Quality Checks
- Final Review
- Data Triangulation
- Bottom-Up Approach
- Top-Down Approach
- Research Flow
- Data Sources
- Data Mining
- Executive Summary
- Market Overview
- Global CubeSat Market Outlook
- Market Drivers
- Market Restraints
- Market Opportunities
- Impact of Covid-19 On the CubeSat Market
- Porter’s five forces model
- Threat from new entrants
- Threat from substitutes
- Bargaining power of suppliers
- Bargaining power of customers
- Degree of competition
- Industry value chain Analysis
- Global CubeSat Market Outlook
- Global CubeSat Market by Size, 2020-2029, (USD MILLION)
- 25U to 1U
- 1U to 3U
- 3U to 6U
- 6U to 12U
- 12U and Above
- Global CubeSat Market by Subsystem, 2020-2029, (USD MILLION)
- Payloads
- Structures
- Electrical Power Systems
- Command and Data Handling
- Propulsion Systems
- Attitude Determination and Control Systems
- Global CubeSat Market by Application, 2020-2029, (USD MILLION)
- Earth Observation and Traffic Monitoring
- Science, Technology, and Education
- Space Observation
- Communication
- Global CubeSat Market by End User, 2020-2029, (USD MILLION)
- Government and Military
- Commercial
- Non-profit Organizations
- Global CubeSat Market by Region, 2020-2029, (USD MILLION)
- North America
- US
- Canada
- Mexico
- South America
- Brazil
- Argentina
- Colombia
- Rest Of South America
- Europe
- Germany
- UK
- France
- Italy
- Spain
- Russia
- Rest Of Europe
- Asia Pacific
- India
- China
- Japan
- South Korea
- Australia
- South-East Asia
- Rest Of Asia Pacific
- Middle East and Africa
- UAE
- Saudi Arabia
- South Africa
- Rest Of Middle East and Africa
- North America
- Company Profiles*
(Business Overview, Company Snapshot, Products Offered, Recent Developments)
10.1 Planet Labs Inc.
10.2 GomSpace
10.3 AAC Clyde Space
10.4 Endurosat
10.5 Surrey Satellite Technology Limited
10.6 Innovative Solutions in Space B.V.
10.7 Space Inventor
10.8 Pumpkin Space Systems
10.9 CU Aerospace, L.L.C.
10.10 Clyde Space Ltd.
10.11 Interorbital Systems Corporation
10.12 Lockheed Martin
10.13 Boeing
10.14 Northrop Grumman
*The Company List Is Indicative
LIST OF TABLES
TABLE 1 GLOBAL CUBESAT MARKET BY SIZE (USD MILLION) 2020-2029
TABLE 2 GLOBAL CUBESAT MARKET BY SUBSYSTEM (USD MILLION) 2020-2029
TABLE 3 GLOBAL CUBESAT MARKET BY APPLICATION (USD MILLION) 2020-2029
TABLE 4 GLOBAL CUBESAT MARKET BY END USER (USD MILLION) 2020-2029
TABLE 5 GLOBAL CUBESAT MARKET BY REGION (USD MILLION) 2020-2029
TABLE 6 NORTH AMERICA CUBESAT MARKET BY SIZE (USD MILLION) 2020-2029
TABLE 7 NORTH AMERICA CUBESAT MARKET BY SUBSYSTEM (USD MILLION) 2020-2029
TABLE 8 NORTH AMERICA CUBESAT MARKET BY APPLICATION (USD MILLION) 2020-2029
TABLE 9 NORTH AMERICA CUBESAT MARKET BY END USER (USD MILLION) 2020-2029
TABLE 10 NORTH AMERICA CUBESAT MARKET BY COUNTRY (USD MILLION) 2020-2029
TABLE 11 US CUBESAT MARKET BY SIZE (USD MILLION) 2020-2029
TABLE 12 US CUBESAT MARKET BY SUBSYSTEM (USD MILLION) 2020-2029
TABLE 13 US CUBESAT MARKET BY APPLICATION (USD MILLION) 2020-2029
TABLE 14 US CUBESAT MARKET BY END USER (USD MILLION) 2020-2029
TABLE 15 US CUBESAT MARKET BY REGION (USD MILLION) 2020-2029
TABLE 16 CANADA CUBESAT MARKET BY SIZE (USD MILLION) 2020-2029
TABLE 17 CANADA CUBESAT MARKET BY SUBSYSTEM (USD MILLION) 2020-2029
TABLE 18 CANADA CUBESAT MARKET BY APPLICATION (USD MILLION) 2020-2029
TABLE 19 CANADA CUBESAT MARKET BY END USER (USD MILLION) 2020-2029
TABLE 20 CANADA CUBESAT MARKET BY REGION (USD MILLION) 2020-2029
TABLE 21 MEXICO CUBESAT MARKET BY SIZE (USD MILLION) 2020-2029
TABLE 22 MEXICO CUBESAT MARKET BY SUBSYSTEM (USD MILLION) 2020-2029
TABLE 23 MEXICO CUBESAT MARKET BY APPLICATION (USD MILLION) 2020-2029
TABLE 24 MEXICO CUBESAT MARKET BY END USER (USD MILLION) 2020-2029
TABLE 25 MEXICO CUBESAT MARKET BY REGION (USD MILLION) 2020-2029
TABLE 26 SOUTH AMERICA CUBESAT MARKET BY SIZE (USD MILLION) 2020-2029
TABLE 27 SOUTH AMERICA CUBESAT MARKET BY SUBSYSTEM (USD MILLION) 2020-2029
TABLE 28 SOUTH AMERICA CUBESAT MARKET BY APPLICATION (USD MILLION) 2020-2029
TABLE 29 SOUTH AMERICA CUBESAT MARKET BY END USER (USD MILLION) 2020-2029
TABLE 30 SOUTH AMERICA CUBESAT MARKET BY COUNTRY (USD MILLION) 2020-2029
TABLE 31 BRAZIL CUBESAT MARKET BY SIZE (USD MILLION) 2020-2029
TABLE 32 BRAZIL CUBESAT MARKET BY SUBSYSTEM (USD MILLION) 2020-2029
TABLE 33 BRAZIL CUBESAT MARKET BY APPLICATION (USD MILLION) 2020-2029
TABLE 34 BRAZIL CUBESAT MARKET BY END-USER (USD MILLION) 2020-2029
TABLE 35 BRAZIL CUBESAT MARKET BY REGION (USD MILLION) 2020-2029
TABLE 36 ARGENTINA CUBESAT MARKET BY SIZE (USD MILLION) 2020-2029
TABLE 37 ARGENTINA CUBESAT MARKET BY SUBSYSTEM (USD MILLION) 2020-2029
TABLE 38 ARGENTINA CUBESAT MARKET BY APPLICATION (USD MILLION) 2020-2029
TABLE 39 ARGENTINA CUBESAT MARKET BY END USER (USD MILLION) 2020-2029
TABLE 40 ARGENTINA CUBESAT MARKET BY REGION (USD MILLION) 2020-2029
TABLE 41 COLOMBIA CUBESAT MARKET BY SIZE (USD MILLION) 2020-2029
TABLE 42 COLOMBIA CUBESAT MARKET BY SUBSYSTEM (USD MILLION) 2020-2029
TABLE 43 COLOMBIA CUBESAT MARKET BY APPLICATION (USD MILLION) 2020-2029
TABLE 44 COLOMBIA CUBESAT MARKET BY END USER (USD MILLION) 2020-2029
TABLE 45 COLOMBIA CUBESAT MARKET BY REGION (USD MILLION) 2020-2029
TABLE 46 REST OF THE SOUTH AMERICA CUBESAT MARKET BY SIZE (USD MILLION) 2020-2029
TABLE 47 REST OF SOUTH AMERICA CUBESAT MARKET BY SUBSYSTEM (USD MILLION) 2020-2029
TABLE 48 REST OF SOUTH AMERICA CUBESAT MARKET BY APPLICATION (USD MILLION) 2020-2029
TABLE 49 REST OF THE SOUTH AMERICA CUBESAT MARKET BY END USER (USD MILLION) 2020-2029
TABLE 50 REST OF SOUTH AMERICA CUBESAT MARKET BY REGION (USD MILLION) 2020-2029
TABLE 51 ASIA-PACIFIC CUBESAT MARKET BY SIZE (USD MILLION) 2020-2029
TABLE 52 ASIA-PACIFIC CUBESAT MARKET BY SUBSYSTEM (USD MILLION) 2020-2029
TABLE 53 ASIA-PACIFIC CUBESAT MARKET BY APPLICATION (USD MILLION) 2020-2029
TABLE 54 ASIA-PACIFIC CUBESAT MARKET BY COUNTRY (USD MILLION) 2020-2029
TABLE 55 ASIA-PACIFIC CUBESAT MARKET BY END USER (USD MILLION) 2020-2029
TABLE 56 INDIA CUBESAT MARKET BY SIZE (USD MILLION) 2020-2029
TABLE 57 INDIA CUBESAT MARKET BY SUBSYSTEM (USD MILLION) 2020-2029
TABLE 58 INDIA CUBESAT MARKET BY APPLICATION (USD MILLION) 2020-2029
TABLE 59 INDIA CUBESAT MARKET BY END USER (USD MILLION) 2020-2029
TABLE 60 INDIA CUBESAT MARKET BY REGION (USD MILLION) 2020-2029
TABLE 61 CHINA CUBESAT MARKET BY SIZE (USD MILLION) 2020-2029
TABLE 62 CHINA CUBESAT MARKET BY SUBSYSTEM (USD MILLION) 2020-2029
TABLE 63 CHINA CUBESAT MARKET BY APPLICATION (USD MILLION) 2020-2029
TABLE 64 CHINA CUBESAT MARKET BY END USER (USD MILLION) 2020-2029
TABLE 65 CHINA CUBESAT MARKET BY REGION (USD MILLION) 2020-2029
TABLE 66 JAPAN CUBESAT MARKET BY SIZE (USD MILLION) 2020-2029
TABLE 67 JAPAN CUBESAT MARKET BY SUBSYSTEM (USD MILLION) 2020-2029
TABLE 68 JAPAN CUBESAT MARKET BY APPLICATION (USD MILLION) 2020-2029
TABLE 69 JAPAN CUBESAT MARKET BY END USER (USD MILLION) 2020-2029
TABLE 70 JAPAN CUBESAT MARKET BY REGION (USD MILLION) 2020-2029
TABLE 71 SOUTH KOREAN CUBESAT MARKET BY SIZE (USD MILLION) 2020-2029
TABLE 72 SOUTH KOREA CUBESAT MARKET BY SUBSYSTEM (USD MILLION) 2020-2029
TABLE 73 SOUTH KOREA CUBESAT MARKET BY APPLICATION (USD MILLION) 2020-2029
TABLE 74 SOUTH KOREA CUBESAT MARKET BY END USER (USD MILLION) 2020-2029
TABLE 75 SOUTH KOREA CUBESAT MARKET BY REGION (USD MILLION) 2020-2029
TABLE 76 AUSTRALIA CUBESAT MARKET BY SIZE (USD MILLION) 2020-2029
TABLE 77 AUSTRALIA CUBESAT MARKET BY SUBSYSTEM (USD MILLION) 2020-2029
TABLE 78 AUSTRALIA CUBESAT MARKET BY APPLICATION (USD MILLION) 2020-2029
TABLE 79 AUSTRALIA CUBESAT MARKET BY END USER (USD MILLION) 2020-2029
TABLE 80 AUSTRALIA CUBESAT MARKET BY REGION (USD MILLION) 2020-2029
TABLE 81 SOUTH-EAST ASIA CUBESAT MARKET BY SIZE (USD MILLION) 2020-2029
TABLE 82 SOUTH-EAST ASIA CUBESAT MARKET BY SUBSYSTEM (USD MILLION) 2020-2029
TABLE 83 SOUTH-EAST ASIA CUBESAT MARKET BY APPLICATION (USD MILLION) 2020-2029
TABLE 84 SOUTH-EAST ASIA CUBESAT MARKET BY END USER (USD MILLION) 2020-2029
TABLE 85 SOUTH-EAST ASIA CUBESAT MARKET BY REGION (USD MILLION) 2020-2029
TABLE 86 REST OF ASIA PACIFIC CUBESAT MARKET BY SIZE (USD MILLION) 2020-2029
TABLE 87 REST OF ASIA PACIFIC CUBESAT MARKET BY SUBSYSTEM (USD MILLION) 2020-2029
TABLE 88 REST OF ASIA PACIFIC CUBESAT MARKET BY APPLICATION (USD MILLION) 2020-2029
TABLE 89 REST OF ASIA PACIFIC CUBESAT MARKET BY END USER (USD MILLION) 2020-2029
TABLE 90 REST OF ASIA PACIFIC CUBESAT MARKET BY REGION (USD MILLION) 2020-2029
TABLE 91 EUROPE CUBESAT MARKET BY SIZE (USD MILLION) 2020-2029
TABLE 92 EUROPE CUBESAT MARKET BY SUBSYSTEM (USD MILLION) 2020-2029
TABLE 93 EUROPE CUBESAT MARKET BY APPLICATION (USD MILLION) 2020-2029
TABLE 94 EUROPE CUBESAT MARKET BY END USER (USD MILLION) 2020-2029
TABLE 95 EUROPE CUBESAT MARKET BY COUNTRY (USD MILLION) 2020-2029
TABLE 96 GERMANY CUBESAT MARKET BY SIZE (USD MILLION) 2020-2029
TABLE 97 GERMANY CUBESAT MARKET BY SUBSYSTEM (USD MILLION) 2020-2029
TABLE 98 GERMANY CUBESAT MARKET BY APPLICATION (USD MILLION) 2020-2029
TABLE 99 GERMANY CUBESAT MARKET BY END-USER (USD MILLION) 2020-2029
TABLE 100 GERMANY CUBESAT MARKET BY REGION (USD MILLION) 2020-2029
TABLE 101 UK CUBESAT MARKET BY SIZE (USD MILLION) 2020-2029
TABLE 102 UK CUBESAT MARKET BY SUBSYSTEM (USD MILLION) 2020-2029
TABLE 103 UK CUBESAT MARKET BY APPLICATION (USD MILLION) 2020-2029
TABLE 104 UK CUBESAT MARKET BY END USER (USD MILLION) 2020-2029
TABLE 105 UK CUBESAT MARKET BY REGION (USD MILLION) 2020-2029
TABLE 106 FRANCE CUBESAT MARKET BY SIZE (USD MILLION) 2020-2029
TABLE 107 FRANCE CUBESAT MARKET BY SUBSYSTEM (USD MILLION) 2020-2029
TABLE 108 FRANCE CUBESAT MARKET BY APPLICATION (USD MILLION) 2020-2029
TABLE 109 FRANCE CUBESAT MARKET BY END USER (USD MILLION) 2020-2029
TABLE 110 FRANCE CUBESAT MARKET BY REGION (USD MILLION) 2020-2029
TABLE 111 ITALY CUBESAT MARKET BY SIZE (USD MILLION) 2020-2029
TABLE 112 ITALY CUBESAT MARKET BY SUBSYSTEM (USD MILLION) 2020-2029
TABLE 113 ITALY CUBESAT MARKET BY APPLICATION (USD MILLION) 2020-2029
TABLE 114 ITALY CUBESAT MARKET BY END USER (USD MILLION) 2020-2029
TABLE 115 ITALY CUBESAT MARKET BY REGION (USD MILLION) 2020-2029
TABLE 116 SPAIN CUBESAT MARKET BY SIZE (USD MILLION) 2020-2029
TABLE 117 SPAIN CUBESAT MARKET BY SUBSYSTEM (USD MILLION) 2020-2029
TABLE 118 SPAIN CUBESAT MARKET BY APPLICATION (USD MILLION) 2020-2029
TABLE 119 SPAIN CUBESAT MARKET BY END USER (USD MILLION) 2020-2029
TABLE 120 SPAIN CUBESAT MARKET BY REGION (USD MILLION) 2020-2029
TABLE 121 RUSSIA CUBESAT MARKET BY SIZE (USD MILLION) 2020-2029
TABLE 122 RUSSIA CUBESAT MARKET BY SUBSYSTEM (USD MILLION) 2020-2029
TABLE 123 RUSSIA CUBESAT MARKET BY APPLICATION (USD MILLION) 2020-2029
TABLE 124 RUSSIA CUBESAT MARKET BY END USER (USD MILLION) 2020-2029
TABLE 125 RUSSIA CUBESAT MARKET BY REGION (USD MILLION) 2020-2029
TABLE 126 REST OF EUROPE CUBESAT MARKET BY SIZE (USD MILLION) 2020-2029
TABLE 127 REST OF EUROPE CUBESAT MARKET BY SUBSYSTEM (USD MILLION) 2020-2029
TABLE 128 REST OF EUROPE CUBESAT MARKET BY APPLICATION (USD MILLION) 2020-2029
TABLE 129 REST OF EUROPE CUBESAT MARKET BY END USER (USD MILLION) 2020-2029
TABLE 130 REST OF EUROPE CUBESAT MARKET BY REGION (USD MILLION) 2020-2029
TABLE 131 MIDDLE EAST AND AFRICA CUBESAT MARKET BY SIZE (USD MILLION) 2020-2029
TABLE 132 MIDDLE EAST AND AFRICA CUBESAT MARKET BY SUBSYSTEM (USD MILLION) 2020-2029
TABLE 133 MIDDLE EAST AND AFRICA CUBESAT MARKET BY APPLICATION (USD MILLION) 2020-2029
TABLE 134 MIDDLE EAST AND AFRICA CUBESAT MARKET BY END USER (USD MILLION) 2020-2029
TABLE 135 MIDDLE EAST AND AFRICA CUBESAT MARKET BY COUNTRY (USD MILLION) 2020-2029
TABLE 136 UAE CUBESAT MARKET BY SIZE (USD MILLION) 2020-2029
TABLE 137 UAE CUBESAT MARKET BY SUBSYSTEM (USD MILLION) 2020-2029
TABLE 138 UAE CUBESAT MARKET BY APPLICATION (USD MILLION) 2020-2029
TABLE 139 UAE CUBESAT MARKET BY END USER (USD MILLION) 2020-2029
TABLE 140 UAE CUBESAT MARKET BY REGION (USD MILLION) 2020-2029
TABLE 141 SAUDI ARABIA CUBESAT MARKET BY SIZE (USD MILLION) 2020-2029
TABLE 142 SAUDI ARABIA CUBESAT MARKET BY SUBSYSTEM (USD MILLION) 2020-2029
TABLE 143 SAUDI ARABIA CUBESAT MARKET BY APPLICATION (USD MILLION) 2020-2029
TABLE 144 SAUDI ARABIA CUBESAT MARKET BY END USER (USD MILLION) 2020-2029
TABLE 145 SAUDI ARABIA CUBESAT MARKET BY REGION (USD MILLION) 2020-2029
TABLE 146 SOUTH AFRICA CUBESAT MARKET BY SIZE (USD MILLION) 2020-2029
TABLE 147 SOUTH AFRICA CUBESAT MARKET BY SUBSYSTEM (USD MILLION) 2020-2029
TABLE 148 SOUTH AFRICA CUBESAT MARKET BY APPLICATION (USD MILLION) 2020-2029
TABLE 149 SOUTH AFRICA CUBESAT MARKET BY END USER (USD MILLION) 2020-2029
TABLE 150 SOUTH AFRICA CUBESAT MARKET BY REGION (USD MILLION) 2020-2029
TABLE 151 REST OF THE MIDDLE EAST AND AFRICA CUBESAT MARKET BY SIZE (USD MILLION) 2020-2029
TABLE 152 REST OF THE MIDDLE EAST AND AFRICA CUBESAT MARKET BY SUBSYSTEM (USD MILLION) 2020-2029
TABLE 153 REST OF THE MIDDLE EAST AND AFRICA CUBESAT MARKET BY APPLICATION (USD MILLION) 2020-2029
TABLE 154 REST OF THE MIDDLE EAST AND AFRICAN CUBESAT MARKET BY END-USER (USD MILLION) 2020-2029
TABLE 155 REST OF THE MIDDLE EAST AND AFRICA CUBESAT MARKET BY REGION (USD MILLION) 2020-2029
LIST OF FIGURES
FIGURE 1 MARKET DYNAMICS
FIGURE 2 MARKET SEGMENTATION
FIGURE 3 REPORT TIMELINES: YEARS CONSIDERED
FIGURE 4 DATA TRIANGULATION
FIGURE 5 BOTTOM-UP APPROACH
FIGURE 6 TOP-DOWN APPROACH
FIGURE 7 RESEARCH FLOW
FIGURE 8 GLOBAL CUBESAT MARKET BY SIZE (USD MILLION) 2020-2029
FIGURE 9 GLOBAL CUBESAT MARKET BY SUBSYSTEM (USD MILLION) 2020-2029
FIGURE 10 GLOBAL CUBESAT MARKET BY APPLICATION (USD MILLION) 2020-2029
FIGURE 11 GLOBAL CUBESAT MARKET BY END USER (USD MILLION) 2020-2029
FIGURE 12 GLOBAL CUBESAT MARKET BY REGION (USD MILLION) 2020-2029
FIGURE 13 PORTER’S FIVE FORCES MODEL
FIGURE 14 GLOBAL CUBESAT MARKET BY SIZE (USD MILLION) 2021
FIGURE 15 GLOBAL CUBESAT MARKET BY SUBSYSTEM (USD MILLION) 2021
FIGURE 16 GLOBAL CUBESAT MARKET BY APPLICATION (USD MILLION) 2021
FIGURE 17 GLOBAL CUBESAT MARKET BY END USER (USD MILLION) 2021
FIGURE 18 GLOBAL CUBESAT MARKET BY REGION (USD MILLION) 2021
FIGURE 19 NORTH AMERICA SMART RETAIL MARKET SNAPSHOT
FIGURE 20 EUROPE SMART RETAIL MARKET SNAPSHOT
FIGURE 21 SOUTH AMERICA SMART RETAIL MARKET SNAPSHOT
FIGURE 22 ASIA PACIFIC SMART RETAIL MARKET SNAPSHOT
FIGURE 23 MIDDLE EAST ASIA AND AFRICA SMART RETAIL MARKET SNAPSHOT
FIGURE 24 MARKET SHARE ANALYSIS
FIGURE 25 PLANET LABS INC.: COMPANY SNAPSHOT
FIGURE 26 GOMSPACE: COMPANY SNAPSHOT
FIGURE 27 AAC CLYDE SPACE: COMPANY SNAPSHOT
FIGURE 28 ENDUROSAT: COMPANY SNAPSHOT
FIGURE 29 SURREY SATELLITE TECHNOLOGY LIMITED: COMPANY SNAPSHOT
FIGURE 30 INNOVATIVE SOLUTIONS IN SPACE B.V.: COMPANY SNAPSHOT
FIGURE 31 SPACE INVENTOR: COMPANY SNAPSHOT
FIGURE 32 PUMPKIN SPACE SYSTEMS: COMPANY SNAPSHOT
FIGURE 33 CU AEROSPACE, L.L.C.: COMPANY SNAPSHOT
FIGURE 34 CLYDE SPACE LTD.: COMPANY SNAPSHOT
FIGURE 35 INTERORBITAL SYSTEMS CORPORATION: COMPANY SNAPSHOT
FIGURE 36 LOCKHEED MARTIN: COMPANY SNAPSHOT
DOWNLOAD FREE SAMPLE REPORT
License Type
SPEAK WITH OUR ANALYST
Want to know more about the report or any specific requirement?
WANT TO CUSTOMIZE THE REPORT?
Our Clients Speak
We asked them to research ‘ Equipment market’ all over the world, and their whole arrangement was helpful to us. thehealthanalytics.com insightful analysis and reports contributed to our current analysis and in creating a future strategy. Besides, the te
Yosuke Mitsui
Senior Associate Construction Equipment Sales & Marketing
We asked them to research ‘Equipment market’ all over the world, and their whole arrangement was helpful to us. thehealthanalytics.com insightful analysis and reports contributed to our current analysis and in creating a future strategy. Besides, the te


