

Base Year Value ()
x.x %
x.x %
CAGR ()
x.x %
x.x %
Forecast Year Value ()
x.x %
x.x %
Historical Data Period
Largest Region
Forecast Period
Polyolefins Market by Type (Polyethylene (PE), Polypropylene (PP), Polyolefin Elastomer (POE), Polystyrene, Ethylene Vinyl Acetate (EVA), Thermoplastics Polyolefin (TPO)), Application (Film & Sheet, Injection Molding, Blow Molding, Profile Extrusion, Others) and by Region Global Trends and Forecast from 2022 to 2029
Instant access to hundreds of data points and trends
- Market estimates from 2014-2029
- Competitive analysis, industry segmentation, financial benchmarks
- Incorporates SWOT, Porter's Five Forces and risk management frameworks
- PDF report or online database with Word, Excel and PowerPoint export options
- 100% money back guarantee
Polyolefins Market Overview
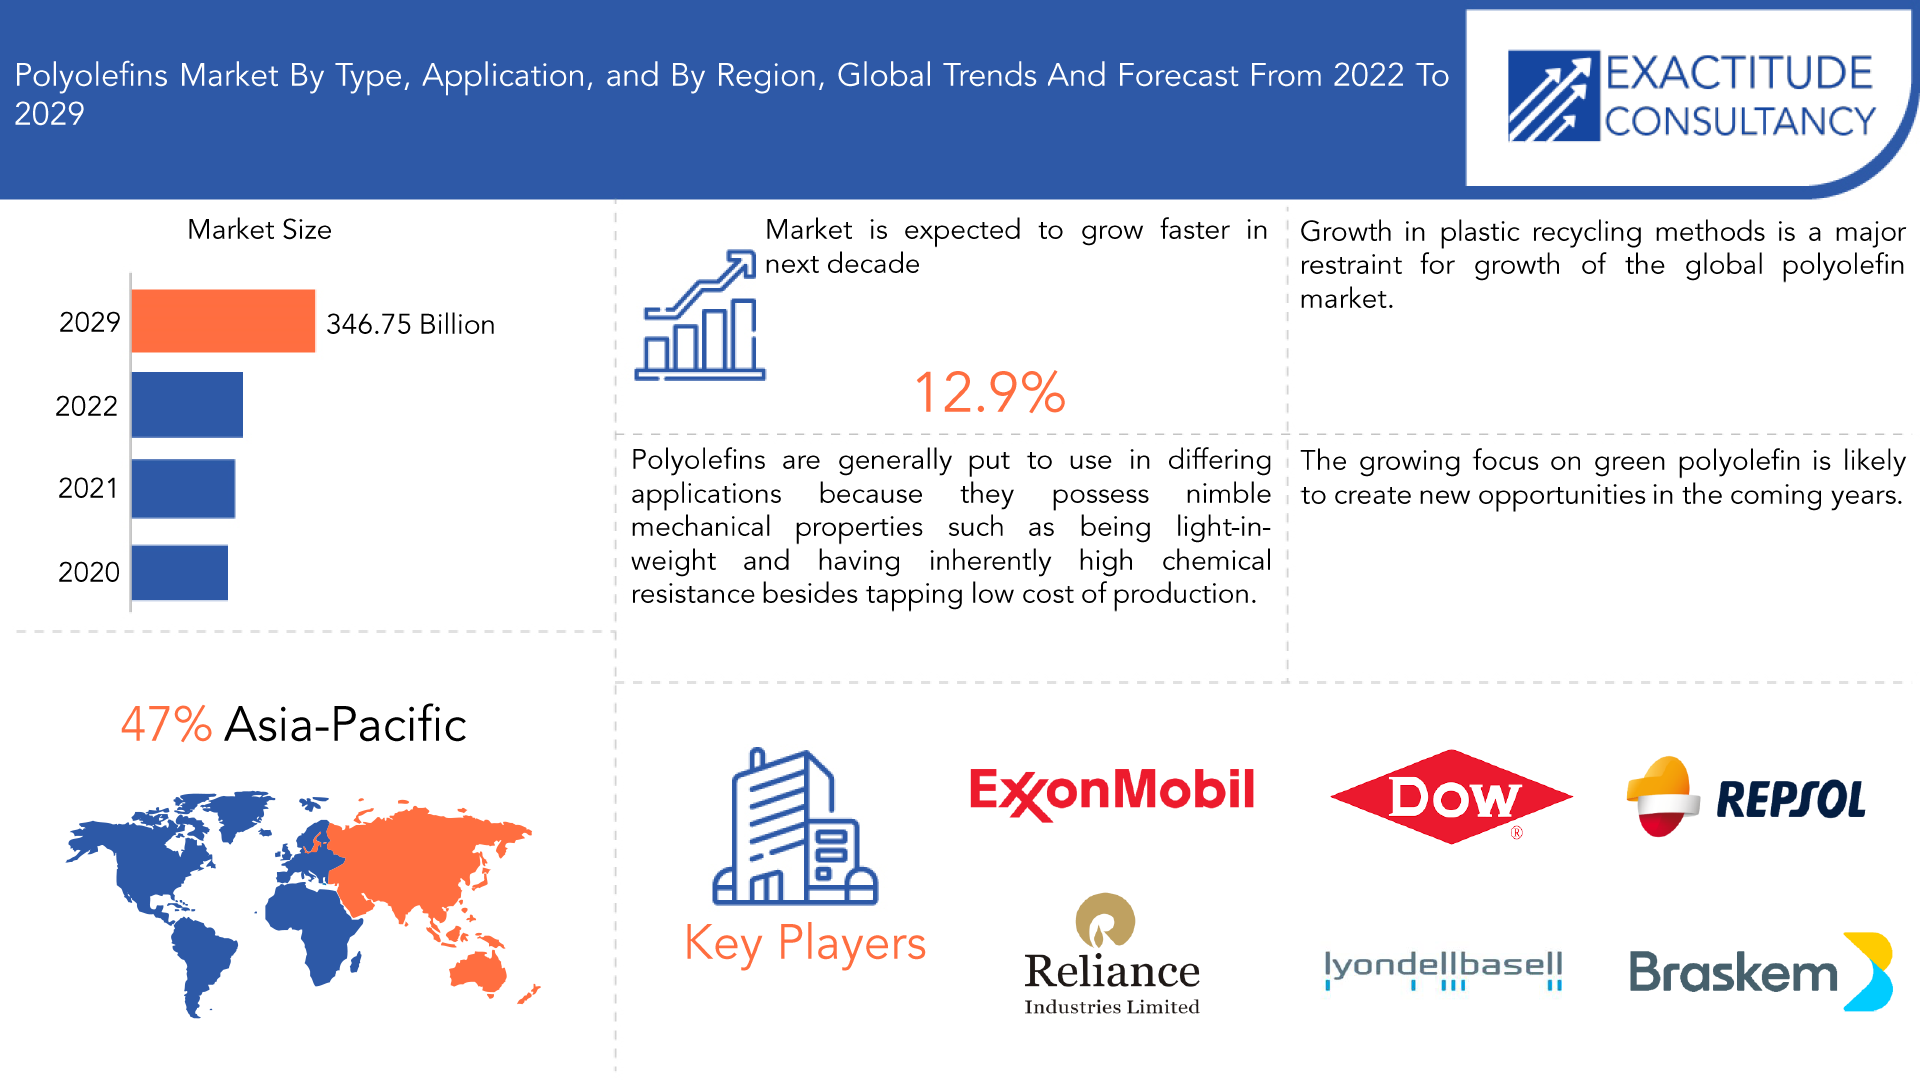
The global polyolefins market is projected to reach USD 346.75 billion by 2029 from USD 132.30 billion in 2020, at a CAGR of 12.9 % from 2022 to 2029.
Polyolefin is any synthetic resin made by polymerizing olefins. Olefins are hydrocarbons with carbon atoms joined together by a double bond. They are most derived from natural gas or low-molecular-weight petroleum components, and their most well-known components are ethylene and propylene. These two compounds are lower olefins, which have only one pair of carbon atoms in their molecules. Butene and methyl pentane are examples of higher olefins, which have two or more carbon atoms per molecule. Polymers are made from these olefins, the most important of which are polyethylene and polypropylene.
The vast array of applications for which these adaptable plastics can be used and the enormous quantities in which they are produced far outweigh the other olefin polymers, which is why the word "polyolefin" is frequently taken to refer exclusively to them. Shrink wrap, packaging, manufacturing materials, fibres for use in clothing and other fabrics, rigid foam technology, tennis racket strings, bottles, and containers are all made of polyolefins. They are also used in heat-shrink tubing to protect wires and new electronic components as well as in medical applications.
| ATTRIBUTE | DETAILS |
| Study period | 2020-2029 |
| Base year | 2021 |
| Estimated year | 2022 |
| Forecasted year | 2022-2029 |
| Historical period | 2018-2020 |
| Unit | Value (USD Billion) Volume (Kilotons) |
| Segmentation | By Type, By Application, By Region. |
| By Type |
|
| By Application |
|
| By Region |
|
The rising demand for polyolefins in the automotive, electrical and electronics, food and beverage, and consumer goods industries is propelling the market forward. High rigidity, good moisture and chemical resistance are some of the properties that make polyolefins suitable for industrial applications, primarily for packaging automotive and electrical spare parts. Whereas in the automotive industry, manufacturers are focusing on increasing vehicle efficiency by reducing vehicle weight. Polyolefins are preferred due to their lightweight, easy processability, sealing, and stiffness properties.
The need for more packaging materials for food and beverages is driving up the usage of polyethylene in the food and beverage sector. As of its qualities that resist physical stresses, durability, provide flexibility in packaging, and make it simple to mould goods, it is also used in fashion, sports, and toys. Government regulations and environmental disasters affect plastic made from polyolefins. They now pose a serious threat to the ecosystem. Decomposition requires a very long time. Additionally, it accumulates in bodies of water, harming both human and aquatic environments.
The construction industry is another major consumer of polyolefins, primarily in the form of pipes, wires and cables, and insulation materials. The growth of the construction industry, particularly in emerging economies, is expected to drive the demand for polyolefins in the coming years. The automotive industry is also a significant consumer of polyolefins, primarily in the form of interior and exterior parts. The demand for lightweight and fuel-efficient vehicles is driving the use of polyolefins in the automotive industry.
Additionally, governments in numerous nations have passed specific laws to control the use of plastic in their nations, which is impeding the expansion of the global polyolefins market. The potential for market growth is growing as a result of advances in technology and product developments by numerous sectors. The market development of the global polyolefins market will be further accelerated soon by the expansion of biodegradable and biobased plastics.
[caption id="attachment_18907" align="aligncenter" width="1920"]
Frequently Asked Questions
• What is the worth of global polyolefins market?
The global polyolefins market is projected to reach USD 346.75 billion by 2029 from USD 132.30 billion in 2020, at a CAGR of 12.9 % from 2022 to 2029.
• What are the factor driving the growth of polyolefins market?
The driving factors of the polyolefin market are growing demand from automotive industry for making lightweight vehicles and increasing demand for films and sheets from the agriculture sector.
• What is the CAGR of polyolefins market?
The global polyolefins market registered a CAGR of 12.9 % from 2022 to 2029
• Which are the top companies to hold the market share in polyolefins market?
Key players profiled in the report include ExxonMobil Corporation, SABIC, Dow, Repsol, Ineos Group AG, Reliance Industries, LyondellBasell Industries N.V., Sinopec Group, Ducor Petrochemical, BASF SE, Borealis AG, Arkema S.A., Braskem S.A, Abu Dhabi Polymers Company Ltd. (Borouge), Sasol Ltd, Tosoh Corporation, Polyone Corporation, and others
• Which is the largest regional market for Polyolefins market?
Asia Pacific dominated the polyolefin market, accounting for 47% of total revenue in 2021. Asia Pacific is the largest and fastest-growing polyolefin market. The rapid industrialization of economies such as China, India, and Indonesia is increasing polyolefin consumption in the region.
Polyolefins Market Segment Analysis
The global polyolefins market is segmented by type, application, and region.Based on type, the polyolefins market is classified into polyethylene (PE), polypropylene (PP), polyolefin elastomer (POE), polystyrene, ethylene vinyl acetate (EVA), thermoplastics polyolefin (TPO) the polyethylene sector dominates the market with a CAGR of 12.3%, it is anticipated to achieve an expected value of USD 333.303 billion by 2029. Due to the rapid growth of the food industry in developing countries like China and India and the development of the renewable energy sector, polyethylene is getting significant traction on the global market. This is attributable to the widespread use of polyethylene in food containers.
The polypropylene market is the fastest growing. It is expected to be worth USD 225.3 billion by 2030, with a CAGR of 14%. The growing demand for syringes, medical vials, and specimen bottles is driving up demand for polypropylene. The polystyrene market is the third largest. It is expected to be worth USD 9.625 billion by 2029, with a CAGR of 11.3%. High adoption in insulation applications and increased adoption in automotive applications are important parameters for the growth of the polystyrene market.
Based on application, the market is segmented into film & sheet, injection molding, blow molding, profile extrusion, others. The film and sheet segment dominated the market. It is expected to reach USD 198.175 billion by 2029, at a CAGR of 13%. The primary driver of market expansion is an increase in demand for biaxially oriented polyolefin films. However, one factor impeding demand for polyolefin films and sheets is the implementation of stringent regulations prohibiting the use of non-biodegradable plastics.
Injection molding is the fastest-growing segment. Fast manufacturing, high efficiency in terms of the number of parts manufactured per hour, low labor costs, design flexibility, high-output production, enhanced strength of plastic products, and product consistency are some of the factors driving demand for polyolefin in injection molding. Labor costs have decreased as automation in the injection molding process has increased. The third-largest market is for profile extrusion. It is expected to be worth USD 92.50 million by 2029, with a CAGR of 11.3%.
[caption id="attachment_18916" align="aligncenter" width="1920"]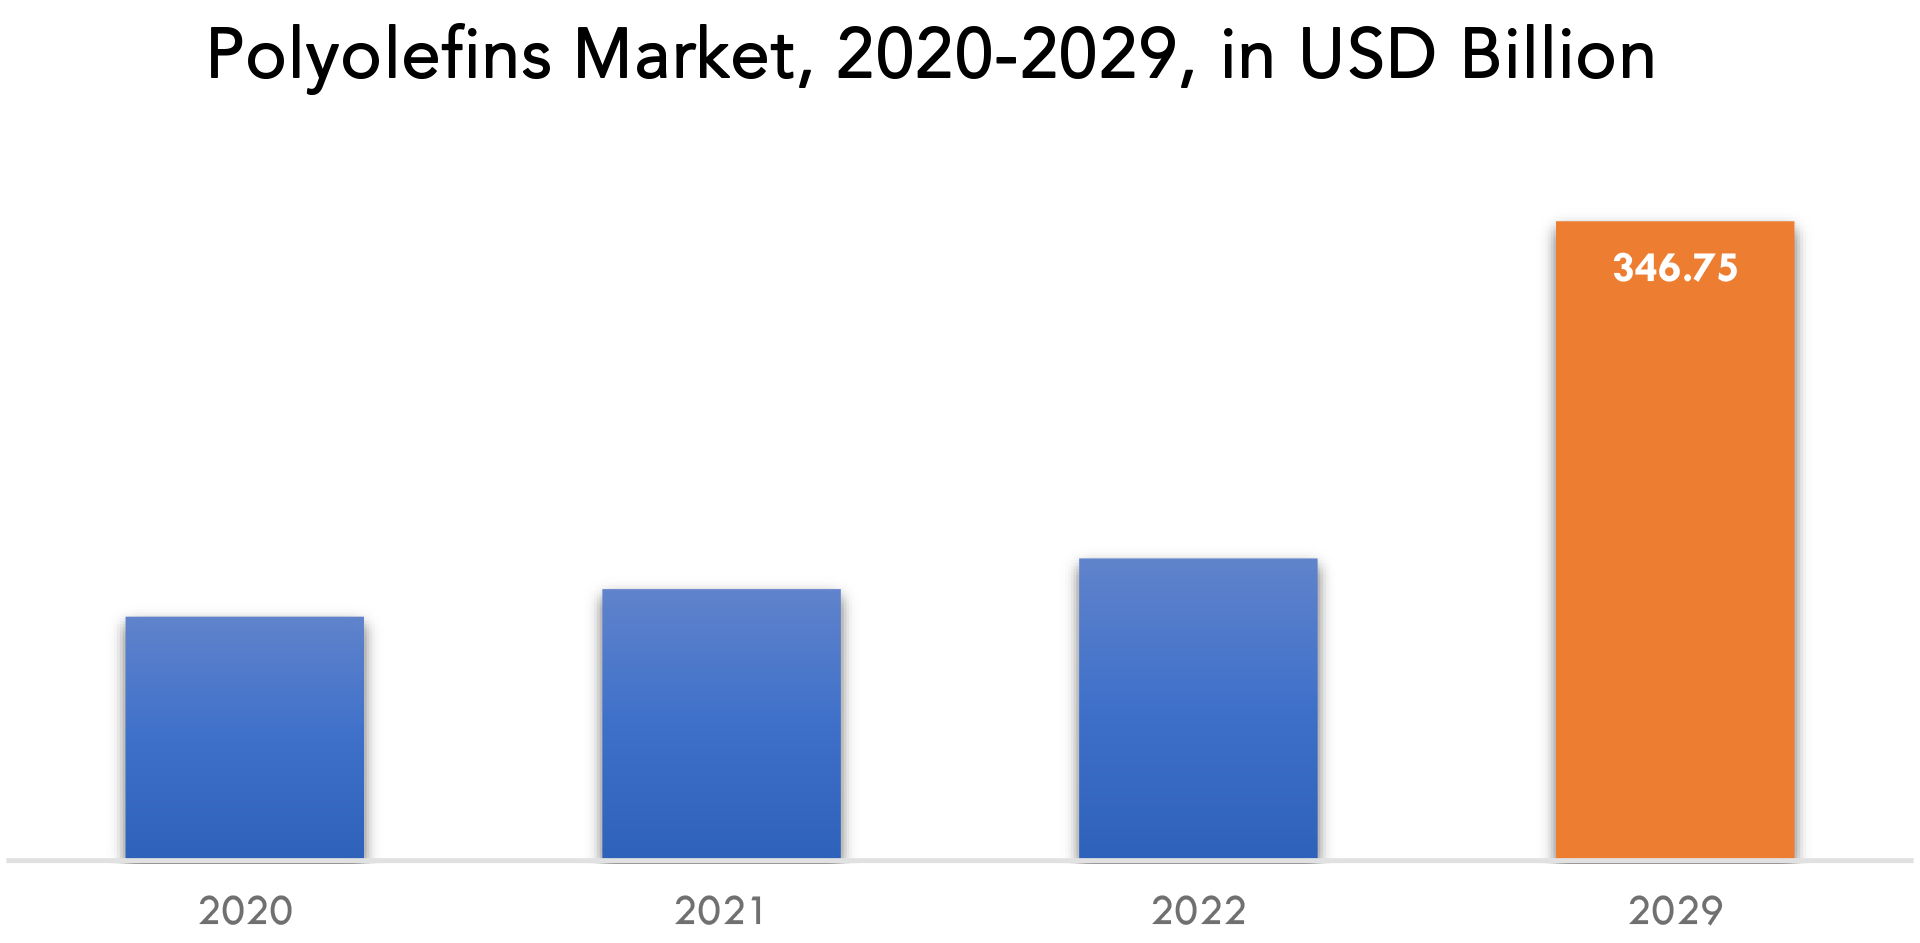
Polyolefins Market Players
The global polyolefins market key players include ExxonMobil Corporation, SABIC, Dow, Repsol, Ineos Group AG, Reliance Industries, LyondellBasell Industries N.V., Sinopec Group, Ducor Petrochemical, BASF SE, Borealis AG, Arkema S.A., Braskem S.A, Abu Dhabi Polymers Company Ltd. (Borouge), Sasol Ltd, Tosoh Corporation, Polyone Corporation, and others 23 Aug 2022: SABIC, a global leader in the chemicals industry, announced that its SABIC SK Nexlene Company (SSNC) joint venture in South Korea with SK Geo Centric (formerly SK Global Chemicals) will expand the capacity of their Ulsan plant to produce advanced material solutions based on NEXLENE technology. Korea Nexlene Company (KNC) operates the plant, which supports the production of SABIC's diverse portfolio of COHERETM metallocene polyolefin plastomers (POP), SUPEERTM metallocene linear low density polyethylenes (mLLDPE), and FORTIFYTM polyolefin elastomers (POE). November 02, 2022: LyondellBasell announced that Stavian Quang Yen Petrochemical, Ltd. (Stavian) has chosen its leading polypropylene (PP) technology for a new world scale production facility.Who Should Buy? Or Key stakeholders
- Regional agencies and research organizations
- Investment research firm
- Manufacturers of Polyolefins
- Traders, distributors, and suppliers of Polyolefins
- Organizations, forums, and alliances related to Polyolefins distribution
- Government and regional agencies and research organizations
- Research institutes
- Automotive Industry
Polyolefins Market Regional Analysis
The polyolefins market by region includes North America, Asia-Pacific (APAC), Europe, South America, and Middle East & Africa (MEA).
- North America: includes the US, Canada, Mexico
- Asia Pacific: includes China, Japan, South Korea, India, Australia, ASEAN, and Rest of APAC
- Europe: includes UK, Germany, France, Italy, Spain, Russia, and Rest of Europe
- South America: includes Brazil, Argentina, and Rest of South America
- Middle East & Africa: includes Turkey, UAE, Saudi Arabia, South Africa, and Rest of MEA
The Asia-Pacific region dominated the market. It is expected to reach USD 47.165 billion by 2029, with a CAGR of 12.9%. This is attributed to countries such as China, India, and Japan, which have established and developed consumer bases in the electronics manufacturing and construction sectors. The outbreak of COVID-19 in China severely hampered the polyolefins market, as China is a major consumer of polyolefins. This is attributed to industries such as packaging, toy manufacturing, construction, and automotive.
Europe is the world's second-largest continent. It is expected to be worth USD 7580 million by 2030, with a CAGR of 7%. Germany, France, the United Kingdom, Italy, Spain, and the rest of Europe are all examined. As of the expansion of the packaging and automotive industries, Germany is one of the most significant users of polyolefins. The COVID-19 pandemic has caused lockdowns in several European countries, resulting in panic purchases of consumer goods such as food, health, and hygiene products. This fueled demand for polyolefins in the packaging industry.
North America is the third most populous continent. It is expected to be worth USD 8085 million by 2030, with a CAGR of 12%. Plastic is primarily used in the packaging, construction, automotive, and electrical and electronics industries in North America, which serves as the market's primary driving force. Furthermore, as the COVID-19 pandemic spread, the demand for packaging increased due to the increased penetration of e-commerce frameworks.
[caption id="attachment_18918" align="aligncenter" width="1920"]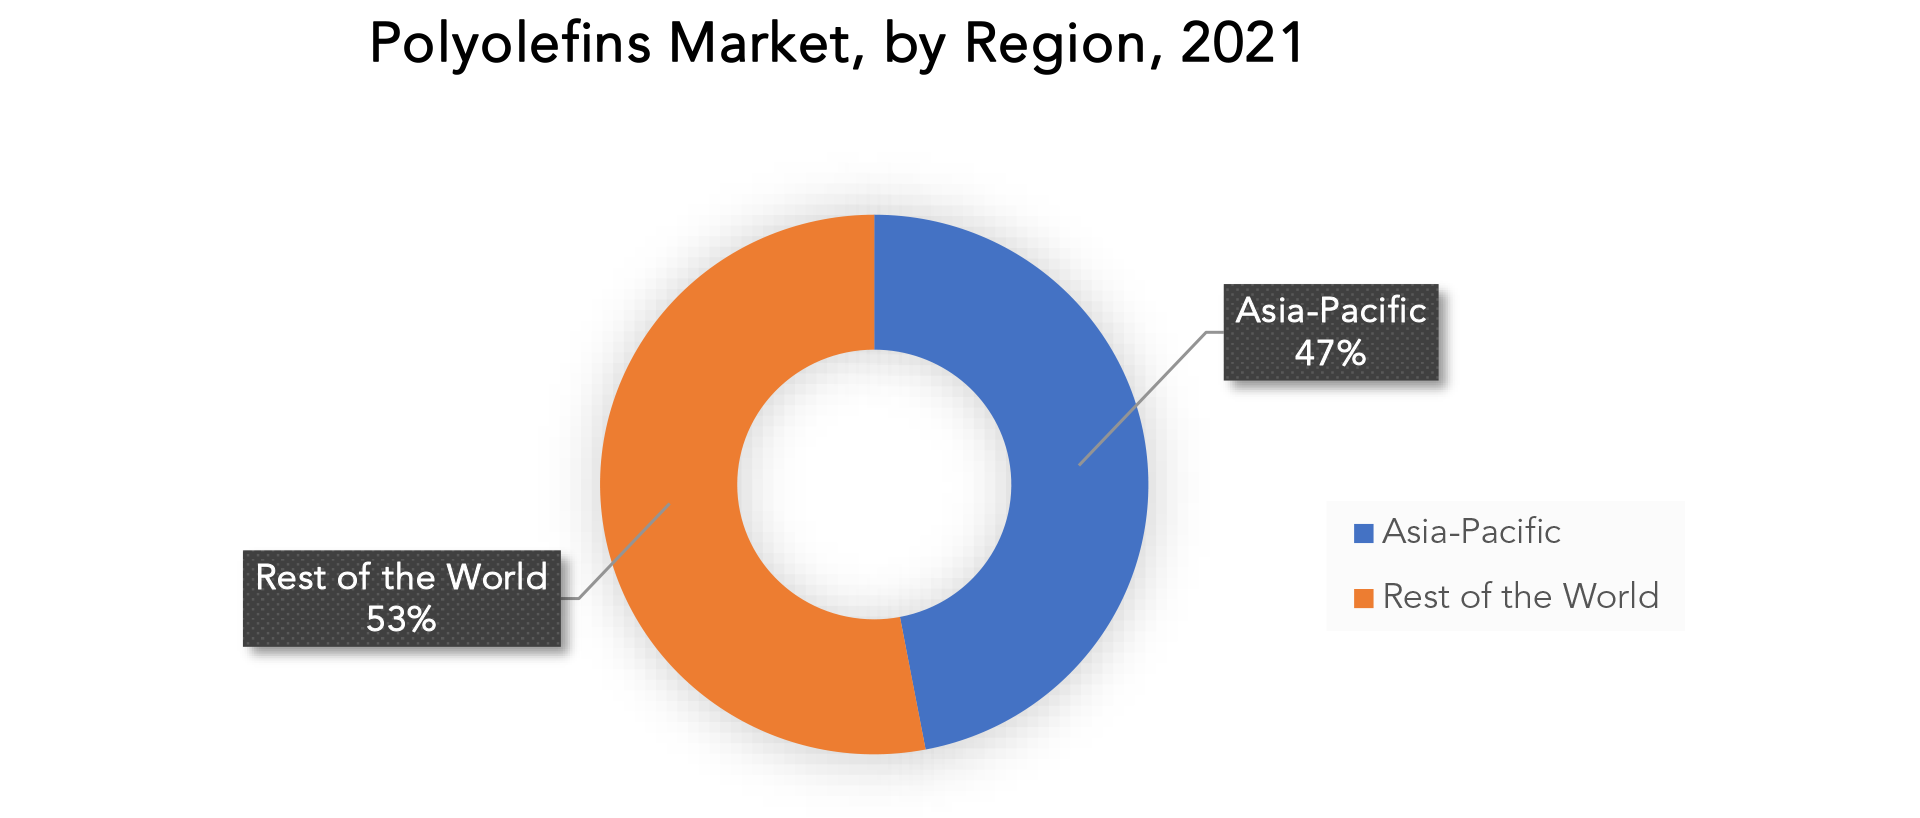
Key Market Segments: Polyolefins Market
Polyolefins Market By Type, 2020-2029, (Usd Billion) (Kilotons)- Polyethylene (Pe)
- Polypropylene (Pp)
- Polyolefin Elastomer (Poe)
- Ethylene Vinyl Acetate (Eva)
- Thermoplastics Polyolefin (Tpo)
- Polystyrene
- Film & Sheet
- Injection Molding
- Blow Molding
- Profile Extrusion
- Others
- North America
- Europe
- Asia Pacific
- South America
- Middle East And Africa
Exactitude Consultancy Services Key Objectives
- Increasing sales and market share
- Developing new technology
- Improving profitability
- Entering new markets
- Enhancing brand reputation
Key Question Answered
- What is the expected growth rate of the polyolefins market over the next 7 years?
- Who are the major players in the polyolefins market and what is their market share?
- What are the end-user industries driving demand for market and what is their outlook?
- What are the opportunities for growth in emerging markets such as Asia-Pacific, Middle East, and Africa?
- How is the economic environment affecting the polyolefins market, including factors such as interest rates, inflation, and exchange rates?
- What is the expected impact of government policies and regulations on the polyolefins market?
- What is the current and forecasted size and growth rate of the global polyolefins market?
- What are the key drivers of growth in the polyolefins market?
- What are the distribution channels and supply chain dynamics in the polyolefins market?
- What are the technological advancements and innovations in the polyolefins market and their impact on product development and growth?
- What are the regulatory considerations and their impact on the market?
- What are the challenges faced by players in the polyolefins market and how are they addressing these challenges?
- What are the opportunities for growth and expansion in the polyolefins market?
- What are the product offerings and specifications of leading players in the market?
- What is the pricing trend of polyolefins in the market and what is the impact of raw material prices on the price trend?
- INTRODUCTION
- MARKET DEFINITION
- MARKET SEGMENTATION
- RESEARCH TIMELINES
- ASSUMPTIONS AND LIMITATIONS
- RESEARCH METHODOLOGY
- DATA MINING
- SECONDARY RESEARCH
- PRIMARY RESEARCH
- SUBJECT-MATTER EXPERTS’ ADVICE
- QUALITY CHECKS
- FINAL REVIEW
- DATA TRIANGULATION
- BOTTOM-UP APPROACH
- TOP-DOWN APPROACH
- RESEARCH FLOW
- DATA SOURCES
- DATA MINING
- EXECUTIVE SUMMARY
- MARKET OVERVIEW
- GLOBAL POLYOLEFINS MARKET OUTLOOK
- MARKET DRIVERS
- MARKET RESTRAINTS
- MARKET OPPORTUNITIES
- IMPACT OF COVID-19 ON POLYOLEFINS MARKET
- PORTER’S FIVE FORCES MODEL
- THREAT FROM NEW ENTRANTS
- THREAT FROM SUBSTITUTES
- BARGAINING POWER OF SUPPLIERS
- BARGAINING POWER OF CUSTOMERS
- DEGREE OF COMPETITION
- INDUSTRY VALUE CHAIN ANALYSIS
- GLOBAL POLYOLEFINS MARKET OUTLOOK
- GLOBAL POLYOLEFINS MARKET BY TYPE, 2020-2029, (USD BILLION) (KILOTONS)
- POLYETHYLENE (PE)
- POLYPROPYLENE (PP)
- POLYOLEFIN ELASTOMER (POE)
- ETHYLENE VINYL ACETATE (EVA)
- THERMOPLASTICS POLYOLEFIN (TPO)
- POLYSTYRENE
- GLOBAL POLYOLEFINS MARKET BY APPLICATION, 2020-2029, (USD BILLION) (KILOTONS)
- FILM & SHEET
- INJECTION MOLDING
- BLOW MOLDING
- PROFILE EXTRUSION
- OTHERS
- GLOBAL POLYOLEFINS MARKET BY REGION, 2020-2029, (USD BILLION) (KILOTONS)
- NORTH AMERICA
- US
- CANADA
- MEXICO
- SOUTH AMERICA
- BRAZIL
- ARGENTINA
- COLOMBIA
- REST OF SOUTH AMERICA
- EUROPE
- GERMANY
- UK
- FRANCE
- ITALY
- SPAIN
- RUSSIA
- REST OF EUROPE
- ASIA PACIFIC
- INDIA
- CHINA
- JAPAN
- SOUTH KOREA
- AUSTRALIA
- SOUTH-EAST ASIA
- REST OF ASIA PACIFIC
- MIDDLE EAST AND AFRICA
- UAE
- SAUDI ARABIA
- SOUTH AFRICA
- REST OF MIDDLE EAST AND AFRICA
- NORTH AMERICA
- COMPANY PROFILES* (BUSINESS OVERVIEW, COMPANY SNAPSHOT, PRODUCT OFFERED, RECENT DEVELOPMENTS)
8.1. EXXONMOBIL CORPORATION
8.2. SABIC
8.3. DOW
8.4. REPSOL
8.5. INEOS GROUP AG
8.6. RELIANCE INDUSTRIES
8.7. LYONDELLBASELL INDUSTRIES N.V.
8.8. SINOPEC GROUP
8.9. DUCOR PETROCHEMICAL
8.10. BASF SE
8.11. BOREALIS AG
8.12. ARKEMA S.A.
8.13. BRASKEM S.A
8.14. ABU DHABI POLYMERS COMPANY LTD. (BOROUGE)
8.15. SASOL LTD
8.16. TOSOH CORPORATION
8.17.POLYONE CORPORATION.*THE COMPANY LIST IS INDICATIVE
LIST OF TABLES
TABLE 1 GLOBAL POLYOLEFINS MARKET BY TYPE (USD BILLION) 2020-2029
TABLE 2 GLOBAL POLYOLEFINS MARKET BY TYPE (KILOTONS) 2020-2029
TABLE 3 GLOBAL POLYOLEFINS MARKET BY APPLICATION (USD BILLION) 2020-2029
TABLE 4 GLOBAL POLYOLEFINS MARKET BY APPLICATION (KILOTONS) 2020-2029
TABLE 5 GLOBAL POLYOLEFINS MARKET BY REGION (USD BILLION) 2020-2029
TABLE 6 GLOBAL POLYOLEFINS MARKET BY REGION (KILOTONS) 2020-2029
TABLE 7 NORTH AMERICA POLYOLEFINS MARKET BY TYPE (USD BILLION) 2020-2029
TABLE 8 NORTH AMERICA POLYOLEFINS MARKET BY TYPE (KILOTONS) 2020-2029
TABLE 9 NORTH AMERICA POLYOLEFINS MARKET BY APPLICATION (USD BILLION) 2020-2029
TABLE 10 NORTH AMERICA POLYOLEFINS MARKET BY APPLICATION (KILOTONS) 2020-2029
TABLE 11 NORTH AMERICA POLYOLEFINS MARKET BY COUNTRY (USD BILLION) 2020-2029
TABLE 12 NORTH AMERICA POLYOLEFINS MARKET BY COUNTRY (KILOTONS) 2020-2029
TABLE 13 US POLYOLEFINS MARKET BY TYPE (USD BILLION) 2020-2029
TABLE 14 US POLYOLEFINS MARKET BY TYPE (KILOTONS) 2020-2029
TABLE 15 US POLYOLEFINS MARKET BY APPLICATION (USD BILLION) 2020-2029
TABLE 16 US POLYOLEFINS MARKET BY APPLICATION (KILOTONS) 2020-2029
TABLE 17 US POLYOLEFINS MARKET BY REGION (USD BILLION) 2020-2029
TABLE 18 US POLYOLEFINS MARKET BY REGION (KILOTONS) 2020-2029
TABLE 19 CANADA POLYOLEFINS MARKET BY TYPE (USD BILLION) 2020-2029
TABLE 20 CANADA POLYOLEFINS MARKET BY TYPE (KILOTONS) 2020-2029
TABLE 21 CANADA POLYOLEFINS MARKET BY APPLICATION (USD BILLION) 2020-2029
TABLE 22 CANADA POLYOLEFINS MARKET BY APPLICATION (KILOTONS) 2020-2029
TABLE 23 CANADA POLYOLEFINS MARKET BY REGION (USD BILLION) 2020-2029
TABLE 24 CANADA POLYOLEFINS MARKET BY REGION (KILOTONS) 2020-2029
TABLE 25 MEXICO POLYOLEFINS MARKET BY TYPE (USD BILLION) 2020-2029
TABLE 26 MEXICO POLYOLEFINS MARKET BY TYPE (KILOTONS) 2020-2029
TABLE 27 MEXICO POLYOLEFINS MARKET BY APPLICATION (USD BILLION) 2020-2029
TABLE 28 MEXICO POLYOLEFINS MARKET BY APPLICATION (KILOTONS) 2020-2029
TABLE 29 MEXICO POLYOLEFINS MARKET BY REGION (USD BILLION) 2020-2029
TABLE 30 MEXICO POLYOLEFINS MARKET BY REGION (KILOTONS) 2020-2029
TABLE 31 SOUTH AMERICA POLYOLEFINS MARKET BY TYPE (USD BILLION) 2020-2029
TABLE 32 SOUTH AMERICA POLYOLEFINS MARKET BY TYPE (KILOTONS) 2020-2029
TABLE 33 SOUTH AMERICA POLYOLEFINS MARKET BY APPLICATION (USD BILLION) 2020-2029
TABLE 34 SOUTH AMERICA POLYOLEFINS MARKET BY APPLICATION (KILOTONS) 2020-2029
TABLE 35 SOUTH AMERICA POLYOLEFINS MARKET BY COUNTRY (USD BILLION) 2020-2029
TABLE 36 SOUTH AMERICA POLYOLEFINS MARKET BY COUNTRY (KILOTONS) 2020-2029
TABLE 37 BRAZIL POLYOLEFINS MARKET BY TYPE (USD BILLION) 2020-2029
TABLE 38 BRAZIL POLYOLEFINS MARKET BY TYPE (KILOTONS) 2020-2029
TABLE 39 BRAZIL POLYOLEFINS MARKET BY APPLICATION (USD BILLION) 2020-2029
TABLE 40 BRAZIL POLYOLEFINS MARKET BY APPLICATION (KILOTONS) 2020-2029
TABLE 41 BRAZIL POLYOLEFINS MARKET BY REGION (USD BILLION) 2020-2029
TABLE 42 BRAZIL POLYOLEFINS MARKET BY REGION (KILOTONS) 2020-2029
TABLE 43 ARGENTINA POLYOLEFINS MARKET BY TYPE (USD BILLION) 2020-2029
TABLE 44 ARGENTINA POLYOLEFINS MARKET BY TYPE (KILOTONS) 2020-2029
TABLE 45 ARGENTINA POLYOLEFINS MARKET BY APPLICATION (USD BILLION) 2020-2029
TABLE 46 ARGENTINA POLYOLEFINS MARKET BY APPLICATION (KILOTONS) 2020-2029
TABLE 47 ARGENTINA POLYOLEFINS MARKET BY REGION (USD BILLION) 2020-2029
TABLE 48 ARGENTINA POLYOLEFINS MARKET BY REGION (KILOTONS) 2020-2029
TABLE 49 COLOMBIA POLYOLEFINS MARKET BY TYPE (USD BILLION) 2020-2029
TABLE 50 COLOMBIA POLYOLEFINS MARKET BY TYPE (KILOTONS) 2020-2029
TABLE 51 COLOMBIA POLYOLEFINS MARKET BY APPLICATION (USD BILLION) 2020-2029
TABLE 52 COLOMBIA POLYOLEFINS MARKET BY APPLICATION (KILOTONS) 2020-2029
TABLE 53 COLOMBIA POLYOLEFINS MARKET BY REGION (USD BILLION) 2020-2029
TABLE 54 COLOMBIA POLYOLEFINS MARKET BY REGION (KILOTONS) 2020-2029
TABLE 55 REST OF SOUTH AMERICA POLYOLEFINS MARKET BY TYPE (USD BILLION) 2020-2029
TABLE 56 REST OF SOUTH AMERICA POLYOLEFINS MARKET BY TYPE (KILOTONS) 2020-2029
TABLE 57 REST OF SOUTH AMERICA POLYOLEFINS MARKET BY APPLICATION (USD BILLION) 2020-2029
TABLE 58 REST OF SOUTH AMERICA POLYOLEFINS MARKET BY APPLICATION (KILOTONS) 2020-2029
TABLE 59 REST OF SOUTH AMERICA POLYOLEFINS MARKET BY REGION (USD BILLION) 2020-2029
TABLE 60 REST OF SOUTH AMERICA POLYOLEFINS MARKET BY REGION (KILOTONS) 2020-2029
TABLE 61 ASIA-PACIFIC POLYOLEFINS MARKET BY TYPE (USD BILLION) 2020-2029
TABLE 62 ASIA-PACIFIC POLYOLEFINS MARKET BY TYPE (KILOTONS) 2020-2029
TABLE 63 ASIA-PACIFIC POLYOLEFINS MARKET BY APPLICATION (USD BILLION) 2020-2029
TABLE 64 ASIA-PACIFIC POLYOLEFINS MARKET BY APPLICATION (KILOTONS) 2020-2029
TABLE 65 ASIA-PACIFIC POLYOLEFINS MARKET BY COUNTRY (USD BILLION) 2020-2029
TABLE 66 ASIA-PACIFIC POLYOLEFINS MARKET BY COUNTRY (KILOTONS) 2020-2029
TABLE 67 INDIA POLYOLEFINS MARKET BY TYPE (USD BILLION) 2020-2029
TABLE 68 INDIA POLYOLEFINS MARKET BY TYPE (KILOTONS) 2020-2029
TABLE 69 INDIA POLYOLEFINS MARKET BY APPLICATION (USD BILLION) 2020-2029
TABLE 70 INDIA POLYOLEFINS MARKET BY APPLICATION (KILOTONS) 2020-2029
TABLE 71 INDIA POLYOLEFINS MARKET BY REGION (USD BILLION) 2020-2029
TABLE 72 INDIA POLYOLEFINS MARKET BY REGION (KILOTONS) 2020-2029
TABLE 73 CHINA POLYOLEFINS MARKET BY TYPE (USD BILLION) 2020-2029
TABLE 74 CHINA POLYOLEFINS MARKET BY TYPE (KILOTONS) 2020-2029
TABLE 75 CHINA POLYOLEFINS MARKET BY APPLICATION (USD BILLION) 2020-2029
TABLE 76 CHINA POLYOLEFINS MARKET BY APPLICATION (KILOTONS) 2020-2029
TABLE 77 CHINA POLYOLEFINS MARKET BY REGION (USD BILLION) 2020-2029
TABLE 78 CHINA POLYOLEFINS MARKET BY REGION (KILOTONS) 2020-2029
TABLE 79 JAPAN POLYOLEFINS MARKET BY TYPE (USD BILLION) 2020-2029
TABLE 80 JAPAN POLYOLEFINS MARKET BY TYPE (KILOTONS) 2020-2029
TABLE 81 JAPAN POLYOLEFINS MARKET BY APPLICATION (USD BILLION) 2020-2029
TABLE 82 JAPAN POLYOLEFINS MARKET BY APPLICATION (KILOTONS) 2020-2029
TABLE 83 JAPAN POLYOLEFINS MARKET BY REGION (USD BILLION) 2020-2029
TABLE 84 JAPAN POLYOLEFINS MARKET BY REGION (KILOTONS) 2020-2029
TABLE 85 SOUTH KOREA POLYOLEFINS MARKET BY TYPE (USD BILLION) 2020-2029
TABLE 86 SOUTH KOREA POLYOLEFINS MARKET BY TYPE (KILOTONS) 2020-2029
TABLE 87 SOUTH KOREA POLYOLEFINS MARKET BY APPLICATION (USD BILLION) 2020-2029
TABLE 88 SOUTH KOREA POLYOLEFINS MARKET BY APPLICATION (KILOTONS) 2020-2029
TABLE 89 SOUTH KOREA POLYOLEFINS MARKET BY REGION (USD BILLION) 2020-2029
TABLE 90 SOUTH KOREA POLYOLEFINS MARKET BY REGION (KILOTONS) 2020-2029
TABLE 91 AUSTRALIA POLYOLEFINS MARKET BY TYPE (USD BILLION) 2020-2029
TABLE 92 AUSTRALIA POLYOLEFINS MARKET BY TYPE (KILOTONS) 2020-2029
TABLE 93 AUSTRALIA POLYOLEFINS MARKET BY APPLICATION (USD BILLION) 2020-2029
TABLE 94 AUSTRALIA POLYOLEFINS MARKET BY APPLICATION (KILOTONS) 2020-2029
TABLE 95 AUSTRALIA POLYOLEFINS MARKET BY REGION (USD BILLION) 2020-2029
TABLE 96 AUSTRALIA POLYOLEFINS MARKET BY REGION (KILOTONS) 2020-2029
TABLE 97 SOUTH-EAST ASIA POLYOLEFINS MARKET BY TYPE (USD BILLION) 2020-2029
TABLE 98 SOUTH-EAST ASIA POLYOLEFINS MARKET BY TYPE (KILOTONS) 2020-2029
TABLE 99 SOUTH-EAST ASIA POLYOLEFINS MARKET BY APPLICATION (USD BILLION) 2020-2029
TABLE 100 SOUTH-EAST ASIA POLYOLEFINS MARKET BY APPLICATION (KILOTONS) 2020-2029
TABLE 101 SOUTH-EAST ASIA POLYOLEFINS MARKET BY REGION (USD BILLION) 2020-2029
TABLE 102 SOUTH-EAST ASIA POLYOLEFINS MARKET BY REGION (KILOTONS) 2020-2029
TABLE 103 REST OF ASIA PACIFIC POLYOLEFINS MARKET BY TYPE (USD BILLION) 2020-2029
TABLE 104 REST OF ASIA PACIFIC POLYOLEFINS MARKET BY TYPE (KILOTONS) 2020-2029
TABLE 105 REST OF ASIA PACIFIC POLYOLEFINS MARKET BY APPLICATION (USD BILLION) 2020-2029
TABLE 106 REST OF ASIA PACIFIC POLYOLEFINS MARKET BY APPLICATION (KILOTONS) 2020-2029
TABLE 107 REST OF ASIA PACIFIC POLYOLEFINS MARKET BY REGION (USD BILLION) 2020-2029
TABLE 108 REST OF ASIA PACIFIC POLYOLEFINS MARKET BY REGION (KILOTONS) 2020-2029
TABLE 109 EUROPE POLYOLEFINS MARKET BY TYPE (USD BILLION) 2020-2029
TABLE 110 EUROPE POLYOLEFINS MARKET BY TYPE (KILOTONS) 2020-2029
TABLE 111 EUROPE POLYOLEFINS MARKET BY APPLICATION (USD BILLION) 2020-2029
TABLE 112 EUROPE POLYOLEFINS MARKET BY APPLICATION (KILOTONS) 2020-2029
TABLE 113 EUROPE POLYOLEFINS MARKET BY COUNTRY (USD BILLION) 2020-2029
TABLE 114 EUROPE POLYOLEFINS MARKET BY COUNTRY (KILOTONS) 2020-2029
TABLE 115 GERMANY POLYOLEFINS MARKET BY TYPE (USD BILLION) 2020-2029
TABLE 116 GERMANY POLYOLEFINS MARKET BY TYPE (KILOTONS) 2020-2029
TABLE 117 GERMANY POLYOLEFINS MARKET BY APPLICATION (USD BILLION) 2020-2029
TABLE 118 GERMANY POLYOLEFINS MARKET BY APPLICATION (KILOTONS) 2020-2029
TABLE 119 GERMANY POLYOLEFINS MARKET BY REGION (USD BILLION) 2020-2029
TABLE 120 GERMANY POLYOLEFINS MARKET BY REGION (KILOTONS) 2020-2029
TABLE 121 UK POLYOLEFINS MARKET BY TYPE (USD BILLION) 2020-2029
TABLE 122 UK POLYOLEFINS MARKET BY TYPE (KILOTONS) 2020-2029
TABLE 123 UK POLYOLEFINS MARKET BY APPLICATION (USD BILLION) 2020-2029
TABLE 124 UK POLYOLEFINS MARKET BY APPLICATION (KILOTONS) 2020-2029
TABLE 125 UK POLYOLEFINS MARKET BY REGION (USD BILLION) 2020-2029
TABLE 126 UK POLYOLEFINS MARKET BY REGION (KILOTONS) 2020-2029
TABLE 127 FRANCE POLYOLEFINS MARKET BY TYPE (USD BILLION) 2020-2029
TABLE 128 FRANCE POLYOLEFINS MARKET BY TYPE (KILOTONS) 2020-2029
TABLE 129 FRANCE POLYOLEFINS MARKET BY APPLICATION (USD BILLION) 2020-2029
TABLE 130 FRANCE POLYOLEFINS MARKET BY APPLICATION (KILOTONS) 2020-2029
TABLE 131 FRANCE POLYOLEFINS MARKET BY REGION (USD BILLION) 2020-2029
TABLE 132 FRANCE POLYOLEFINS MARKET BY REGION (KILOTONS) 2020-2029
TABLE 133 ITALY POLYOLEFINS MARKET BY TYPE (USD BILLION) 2020-2029
TABLE 134 ITALY POLYOLEFINS MARKET BY TYPE (KILOTONS) 2020-2029
TABLE 135 ITALY POLYOLEFINS MARKET BY APPLICATION (USD BILLION) 2020-2029
TABLE 136 ITALY POLYOLEFINS MARKET BY APPLICATION (KILOTONS) 2020-2029
TABLE 137 ITALY POLYOLEFINS MARKET BY REGION (USD BILLION) 2020-2029
TABLE 138 ITALY POLYOLEFINS MARKET BY REGION (KILOTONS) 2020-2029
TABLE 139 SPAIN POLYOLEFINS MARKET BY TYPE (USD BILLION) 2020-2029
TABLE 140 SPAIN POLYOLEFINS MARKET BY TYPE (KILOTONS) 2020-2029
TABLE 141 SPAIN POLYOLEFINS MARKET BY APPLICATION (USD BILLION) 2020-2029
TABLE 142 SPAIN POLYOLEFINS MARKET BY APPLICATION (KILOTONS) 2020-2029
TABLE 143 SPAIN POLYOLEFINS MARKET BY REGION (USD BILLION) 2020-2029
TABLE 144 SPAIN POLYOLEFINS MARKET BY REGION (KILOTONS) 2020-2029
TABLE 145 RUSSIA POLYOLEFINS MARKET BY TYPE (USD BILLION) 2020-2029
TABLE 146 RUSSIA POLYOLEFINS MARKET BY TYPE (KILOTONS) 2020-2029
TABLE 147 RUSSIA POLYOLEFINS MARKET BY APPLICATION (USD BILLION) 2020-2029
TABLE 148 RUSSIA POLYOLEFINS MARKET BY APPLICATION (KILOTONS) 2020-2029
TABLE 149 RUSSIA POLYOLEFINS MARKET BY REGION (USD BILLION) 2020-2029
TABLE 150 RUSSIA POLYOLEFINS MARKET BY REGION (KILOTONS) 2020-2029
TABLE 151 REST OF EUROPE POLYOLEFINS MARKET BY TYPE (USD BILLION) 2020-2029
TABLE 152 REST OF EUROPE POLYOLEFINS MARKET BY TYPE (KILOTONS) 2020-2029
TABLE 153 REST OF EUROPE POLYOLEFINS MARKET BY APPLICATION (USD BILLION) 2020-2029
TABLE 154 REST OF EUROPE POLYOLEFINS MARKET BY APPLICATION (KILOTONS) 2020-2029
TABLE 155 REST OF EUROPE POLYOLEFINS MARKET BY REGION (USD BILLION) 2020-2029
TABLE 156 REST OF EUROPE POLYOLEFINS MARKET BY REGION (KILOTONS) 2020-2029
TABLE 157 MIDDLE EAST AND AFRICA POLYOLEFINS MARKET BY TYPE (USD BILLION) 2020-2029
TABLE 158 MIDDLE EAST AND AFRICA POLYOLEFINS MARKET BY TYPE (KILOTONS) 2020-2029
TABLE 159 MIDDLE EAST AND AFRICA POLYOLEFINS MARKET BY APPLICATION (USD BILLION) 2020-2029
TABLE 160 MIDDLE EAST AND AFRICA POLYOLEFINS MARKET BY APPLICATION (KILOTONS) 2020-2029
TABLE 161 MIDDLE EAST AND AFRICA POLYOLEFINS MARKET BY COUNTRY (USD BILLION) 2020-2029
TABLE 162 MIDDLE EAST AND AFRICA POLYOLEFINS MARKET BY COUNTRY (KILOTONS) 2020-2029
TABLE 163 UAE POLYOLEFINS MARKET BY TYPE (USD BILLION) 2020-2029
TABLE 164 UAE POLYOLEFINS MARKET BY TYPE (KILOTONS) 2020-2029
TABLE 165 UAE POLYOLEFINS MARKET BY APPLICATION (USD BILLION) 2020-2029
TABLE 166 UAE POLYOLEFINS MARKET BY APPLICATION (KILOTONS) 2020-2029
TABLE 167 UAE POLYOLEFINS MARKET BY REGION (USD BILLION) 2020-2029
TABLE 168 UAE POLYOLEFINS MARKET BY REGION (KILOTONS) 2020-2029
TABLE 169 SAUDI ARABIA POLYOLEFINS MARKET BY TYPE (USD BILLION) 2020-2029
TABLE 170 SAUDI ARABIA POLYOLEFINS MARKET BY TYPE (KILOTONS) 2020-2029
TABLE 171 SAUDI ARABIA POLYOLEFINS MARKET BY APPLICATION (USD BILLION) 2020-2029
TABLE 172 SAUDI ARABIA POLYOLEFINS MARKET BY APPLICATION (KILOTONS) 2020-2029
TABLE 173 SAUDI ARABIA POLYOLEFINS MARKET BY REGION (USD BILLION) 2020-2029
TABLE 174 SAUDI ARABIA POLYOLEFINS MARKET BY REGION (KILOTONS) 2020-2029
TABLE 175 SOUTH AFRICA POLYOLEFINS MARKET BY TYPE (USD BILLION) 2020-2029
TABLE 176 SOUTH AFRICA POLYOLEFINS MARKET BY TYPE (KILOTONS) 2020-2029
TABLE 177 SOUTH AFRICA POLYOLEFINS MARKET BY APPLICATION (USD BILLION) 2020-2029
TABLE 178 SOUTH AFRICA POLYOLEFINS MARKET BY APPLICATION (KILOTONS) 2020-2029
TABLE 179 SOUTH AFRICA POLYOLEFINS MARKET BY REGION (USD BILLION) 2020-2029
TABLE 180 SOUTH AFRICA POLYOLEFINS MARKET BY REGION (KILOTONS) 2020-2029
TABLE 181 REST OF MIDDLE EAST AND AFRICA POLYOLEFINS MARKET BY TYPE (USD BILLION) 2020-2029
TABLE 182 REST OF MIDDLE EAST AND AFRICA POLYOLEFINS MARKET BY TYPE (KILOTONS) 2020-2029
TABLE 183 REST OF MIDDLE EAST AND AFRICA POLYOLEFINS MARKET BY APPLICATION (USD BILLION) 2020-2029
TABLE 184 REST OF MIDDLE EAST AND AFRICA POLYOLEFINS MARKET BY APPLICATION (KILOTONS) 2020-2029
TABLE 185 REST OF MIDDLE EAST AND AFRICA POLYOLEFINS MARKET BY REGION (USD BILLION) 2020-2029
TABLE 186 REST OF MIDDLE EAST AND AFRICA POLYOLEFINS MARKET BY REGION (KILOTONS) 2020-2029
LIST OF FIGURES
FIGURE 1 MARKET DYNAMICS
FIGURE 2 MARKET SEGMENTATION
FIGURE 3 REPORT TIMELINES: YEARS CONSIDERED
FIGURE 4 DATA TRIANGULATION
FIGURE 5 BOTTOM-UP APPROACH
FIGURE 6 TOP-DOWN APPROACH
FIGURE 7 RESEARCH FLOW
FIGURE 8 GLOBAL POLYOLEFINS MARKET BY TYPE (USD BILLION) 2020-2029
FIGURE 9 GLOBAL POLYOLEFINS MARKET BY APPLICATION (USD BILLION) 2020-2029
FIGURE 10 GLOBAL POLYOLEFINS MARKET BY REGION (USD BILLION) 2020-2029
FIGURE 11 PORTER’S FIVE FORCES MODEL
FIGURE 12 GLOBAL POLYOLEFINS MARKET BY TYPE (USD BILLION) 2021
FIGURE 13 GLOBAL POLYOLEFINS MARKET BY APPLICATION (USD BILLION) 2021
FIGURE 14 GLOBAL POLYOLEFINS MARKET BY REGION (USD BILLION) 2021
FIGURE 15 NORTH AMERICA POLYOLEFINS MARKETSNAPSHOT
FIGURE 16 EUROPE POLYOLEFINS MARKETSNAPSHOT
FIGURE 17 SOUTH AMERICA POLYOLEFINS MARKETSNAPSHOT
FIGURE 18 ASIA PACIFICPOLYOLEFINS MARKETSNAPSHOT
FIGURE 19 MIDDLE EAST ASIA AND AFRICA POLYOLEFINS MARKETSNAPSHOT
FIGURE 20 MARKET SHARE ANALYSIS
FIGURE 21 EXXONMOBIL CORPORATION: COMPANY SNAPSHOT
FIGURE 22 SABIC: COMPANY SNAPSHOT
FIGURE 23 DOW: COMPANY SNAPSHOT
FIGURE 24 REPSOL: COMPANY SNAPSHOT
FIGURE 25 INEOS GROUP AG: COMPANY SNAPSHOT
FIGURE 26 RELIANCE INDUSTRIES: COMPANY SNAPSHOT
FIGURE 27 LYONDELLBASELL INDUSTRIES N.V.: COMPANY SNAPSHOT
FIGURE 28 SINOPEC GROUP: COMPANY SNAPSHOT
FIGURE 29 DUCOR PETROCHEMICAL: COMPANY SNAPSHOT
FIGURE 30 BASF SE: COMPANY SNAPSHOT
FIGURE 31 BOREALIS AG: COMPANY SNAPSHOT
FIGURE 32 ARKEMA S.A.: COMPANY SNAPSHOT
FIGURE 33 BRASKEM S.A: COMPANY SNAPSHOT
FIGURE 34 ABU DHABI POLYMERS COMPANY LTD. (BOROUGE): COMPANY SNAPSHOT
FIGURE 35 SASOL LTD: COMPANY SNAPSHOT
FIGURE 36 TOSOH CORPORATION: COMPANY SNAPSHOT
FIGURE 37 POLYONE CORPORATION: COMPANY SNAPSHOT
DOWNLOAD FREE SAMPLE REPORT
License Type
SPEAK WITH OUR ANALYST
Want to know more about the report or any specific requirement?
WANT TO CUSTOMIZE THE REPORT?
Our Clients Speak
We asked them to research ‘ Equipment market’ all over the world, and their whole arrangement was helpful to us. thehealthanalytics.com insightful analysis and reports contributed to our current analysis and in creating a future strategy. Besides, the te
Yosuke Mitsui
Senior Associate Construction Equipment Sales & Marketing
We asked them to research ‘Equipment market’ all over the world, and their whole arrangement was helpful to us. thehealthanalytics.com insightful analysis and reports contributed to our current analysis and in creating a future strategy. Besides, the te


