

Base Year Value ()
x.x %
x.x %
CAGR ()
x.x %
x.x %
Forecast Year Value ()
x.x %
x.x %
Historical Data Period
Largest Region
Forecast Period
Toluene Market by Production Process (Reformate Processes, Pygas Processes, Styrene Processes, Coke/Coal Processes) Derivative Type (Benzene & Xylene, Toluene Diisocynates, Gasoline Additives, Others) Application (Building and Construction, Automotive, Oil and Gas, Paints and Coatings, Pharmaceuticals and Others) by Region Global Trends and Forecast from 2022 to 2029
Instant access to hundreds of data points and trends
- Market estimates from 2014-2029
- Competitive analysis, industry segmentation, financial benchmarks
- Incorporates SWOT, Porter's Five Forces and risk management frameworks
- PDF report or online database with Word, Excel and PowerPoint export options
- 100% money back guarantee
Toluene Market Overview
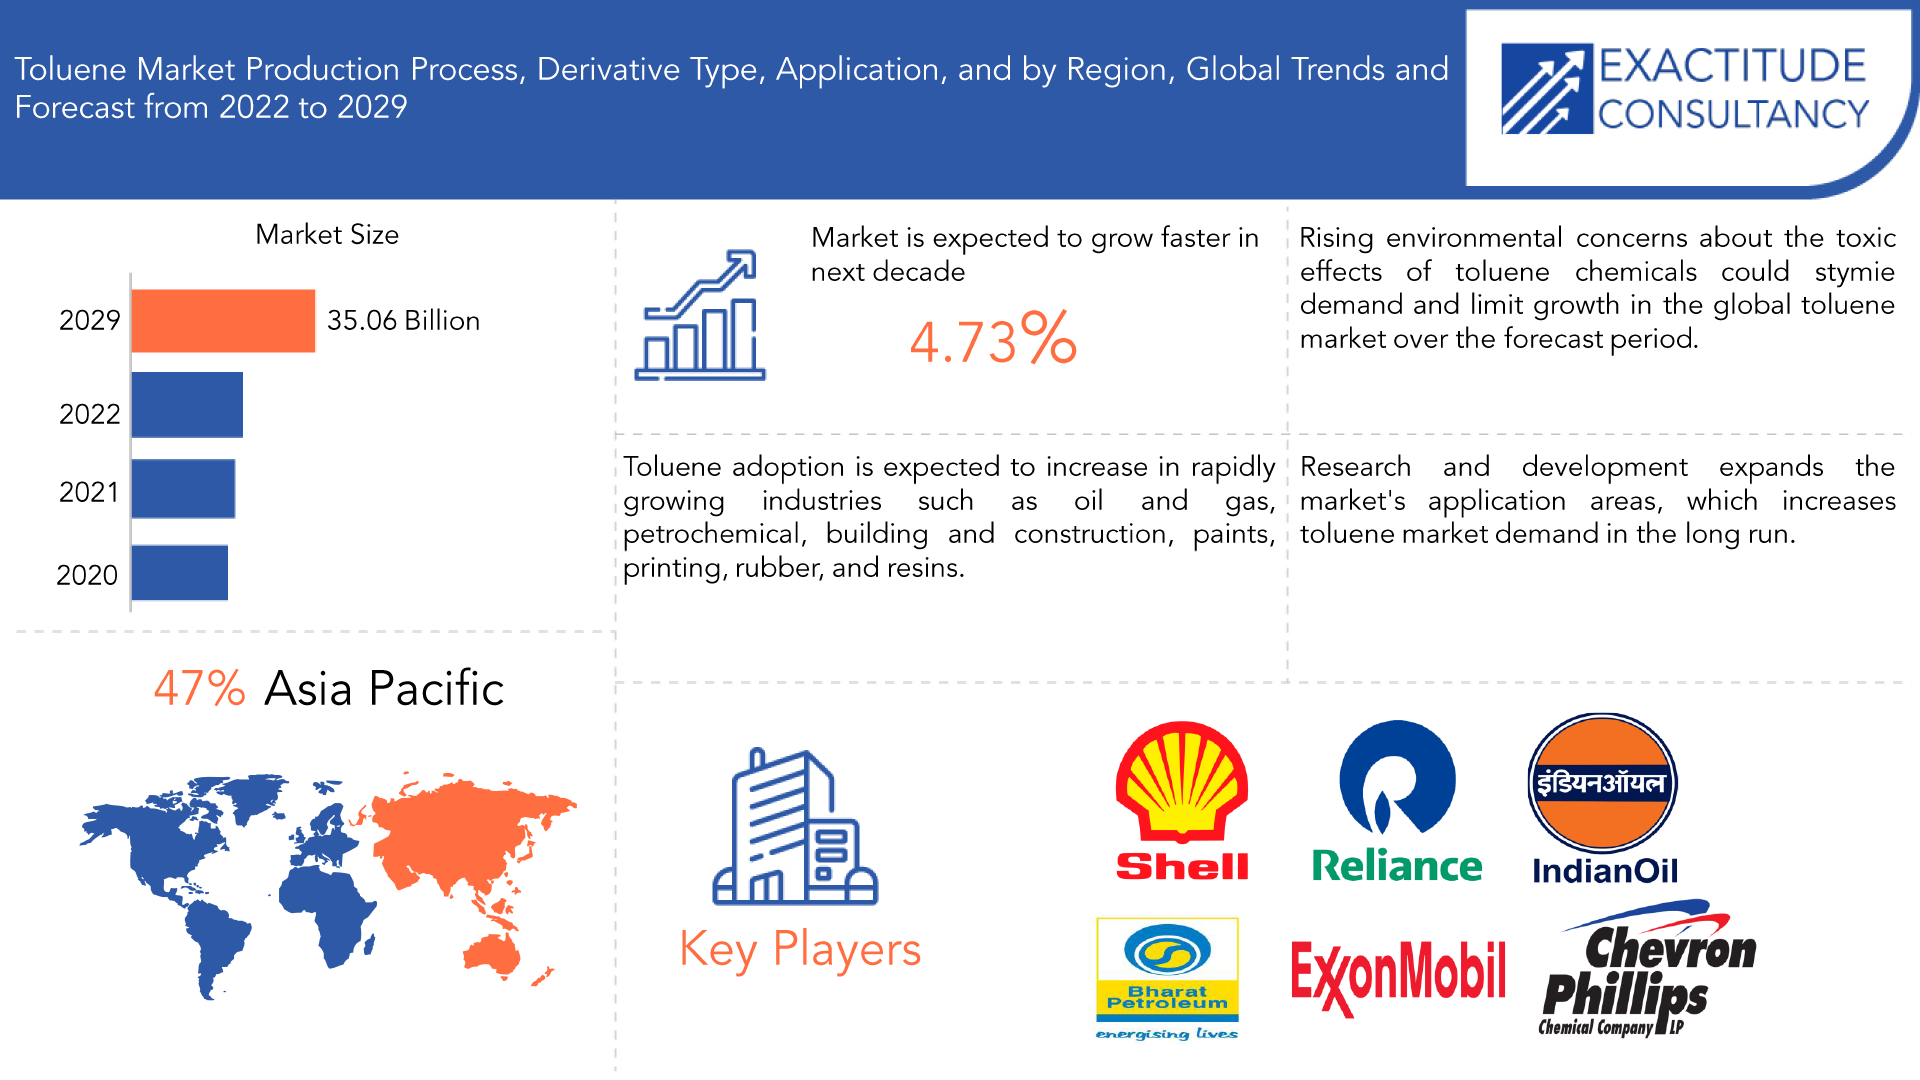
The global toluene market size was valued at USD 23.13 billion in 2020, and projected to reach USD 35.06 billion by 2029, with a CAGR of 4.73% from 2022 to 2029.
Toluene is a colorless liquid that is insoluble in water, combustible, volatile, and has a benzene-like odor similar to paint thinner. It is derived from tolu trees and extracted with crude oils. Other names for it include phenylmethane, methylbenzene, antisal, and, historically, toluol. It is also used to clean chips and wafers. Toluene is produced as a byproduct of coal-based processes used to produce coke fuel and gasoline. Toluene was created by first combining coal tar and petroleum, then combining it with gasoline to increase its octane rating. It is well-known for its use in the production of a variety of commercial and industrial products such as paint thinners, nail polish exfoliator, correction fluid, and model glue.
Some toluene-containing products are used for recreational activities due to their intoxicating effect. As a result, sales of such items are regulated by appropriate jurisdiction in some areas. Another negative effect of toluene on the human body is neurological damage. It can cause confusion, tiredness, weakness, and memory, vision, and hearing loss in small to moderate amounts. If the exposure is prolonged, the symptoms may worsen and even result in death. As a result, professionals who work with toluene products wear masks to limit inhalation of the compound.
| ATTRIBUTE | DETAILS |
| Study period | 2020-2029 |
| Base year | 2021 |
| Estimated year | 2022 |
| Forecasted year | 2022-2029 |
| Historical period | 2018-2020 |
| Unit | Value (USD Billion) (KILOTONS) |
| Segmentation | By Production Process, By Derivative Type, By Application, By Region. |
| By Production Process |
|
| By Derivative Type |
|
| By Application |
|
| By Region |
|
Toluene is in high demand due to its growing use in gasoline blends. Because of its low sensitivity and high-octane ratings, toluene is also best suited for use as fuel in heavily loaded engines. An increase in the demand for aromatics in the petroleum industry is also an indirect factor contributing to the growth of the toluene market.
Toluene adoption is expected to increase in rapidly growing industries such as oil and gas, petrochemical, building and construction, paints, printing, rubber, and resins. Rising demand for toluene-derived chemical intermediates such as benzene and xylene, combined with rising demand for aromatics in the petrochemical industry for the production of synthetic fibers, elastomers, agrochemicals, dyes, and nail paints in emerging economies, is expected to drive toluene market growth. Furthermore, rising demand for solvent-based paints and coatings as a result of increased construction and infrastructure development is expected to drive global toluene market growth. Furthermore, rapid urbanization and rising disposable income in developing countries are expected to drive market growth over the forecast period.
Rising environmental concerns about the toxic effects of toluene chemicals could stymie demand and limit growth in the global toluene market over the forecast period. Stringent rules and regulations imposed by regulatory bodies may also impede market growth in the long run. The US Environmental Protection Agency (EPA) has imposed strict limits on the amount and content of Volatile Organic Compounds (VOC) in products.
Toluene is a versatile chemical that is widely used in a wide range of industries, including paints, coatings, adhesives, and polymers. The global toluene market is expected to expand steadily in the coming years as demand from various end-use industries rises. Toluene is a solvent used in the manufacture of fragrances and flavours. The growing demand for fragrances and flavours in the cosmetics and food industries is expected to drive toluene demand. Toluene is a solvent used in the manufacture of construction adhesives and coatings. The expanding construction industry, particularly in developing countries, is expected to drive toluene demand. The toluene market offers numerous opportunities in the aforementioned end-use industries.
[caption id="attachment_18933" align="aligncenter" width="1920"]
Frequently Asked Questions
• What is the worth of toluene market?
The toluene market is expected to reach USD 26.57 billion by the end of 2023.
• What are the upcoming trends of toluene market globally?
Upcoming trends of toluene market is growing usage of toluene as a solvent for various application.
• What is the CAGR of toluene market?
The global toluene market size was valued at USD 23.13 billion in 2020, and projected to reach USD 35.06 billion by 2029, with a CAGR of 4.73% from 2021 to 2029.
• Which are the top companies to hold the market share in toluene market?
The global market is fragmented in nature with the presence of various key players such as BASF, BP Chemicals, ConocoPhillips, ExxonMobil Chemicals, Mitsui Chemicals, Reliance Industries, Shell, Sinopec, Valero Energy, Chevron Phillips Chemical, LyondellBasell Industries, Indian Oil Corporation Limited, Bharat Petroleum Corporation.
• Which is the largest regional market for toluene market?
The Asia Pacific dominated the global industry in 2021 and accounted for the maximum share of more than 47% of the overall revenue.
Toluene Market Segment Analysis
when determined by the production process, The reformate processes category dominated the global market in 2022 and is expected to grow at a CAGR of 5.7% during the forecast period. The reformate process, which is one of the main production processes for aromatic hydrocarbons like benzene and toluene, is credited with the increase. Furthermore, the growing use of the reformate process for producing toluene in a variety of end-use industries such as oil and gas, paints and coatings, cosmetics, pharmaceuticals, and others is driving the reformate processes segment's rise in the toluene market.
The market is divided into derivatives such as toluene diisocyanates, gasoline additives, benzene & xylene, and others. The benzene and xylene segment is expected to grow at a CAGR of 5.6 during the forecast period, owing to rising demand for its derivatives, such as polyethylene terephthalate and polystyrene, in a variety of applications. Furthermore, rising demand for coatings and sealants to reduce leaks is expected to propel segment growth even further.
The market is divided into building and construction, automotive, oil and gas, paints and coatings, pharmaceuticals, and others based on end-use. Among these, the paints and coatings sector dominated the global Toluene market with a 24.83% market share and is expected to maintain its dominance during the forecast period as well. The building and construction segment is also expected to grow rapidly in the coming years due to the large number of construction projects planned, which will increase demand for Toluene in the future.
[caption id="attachment_18934" align="aligncenter" width="1920"]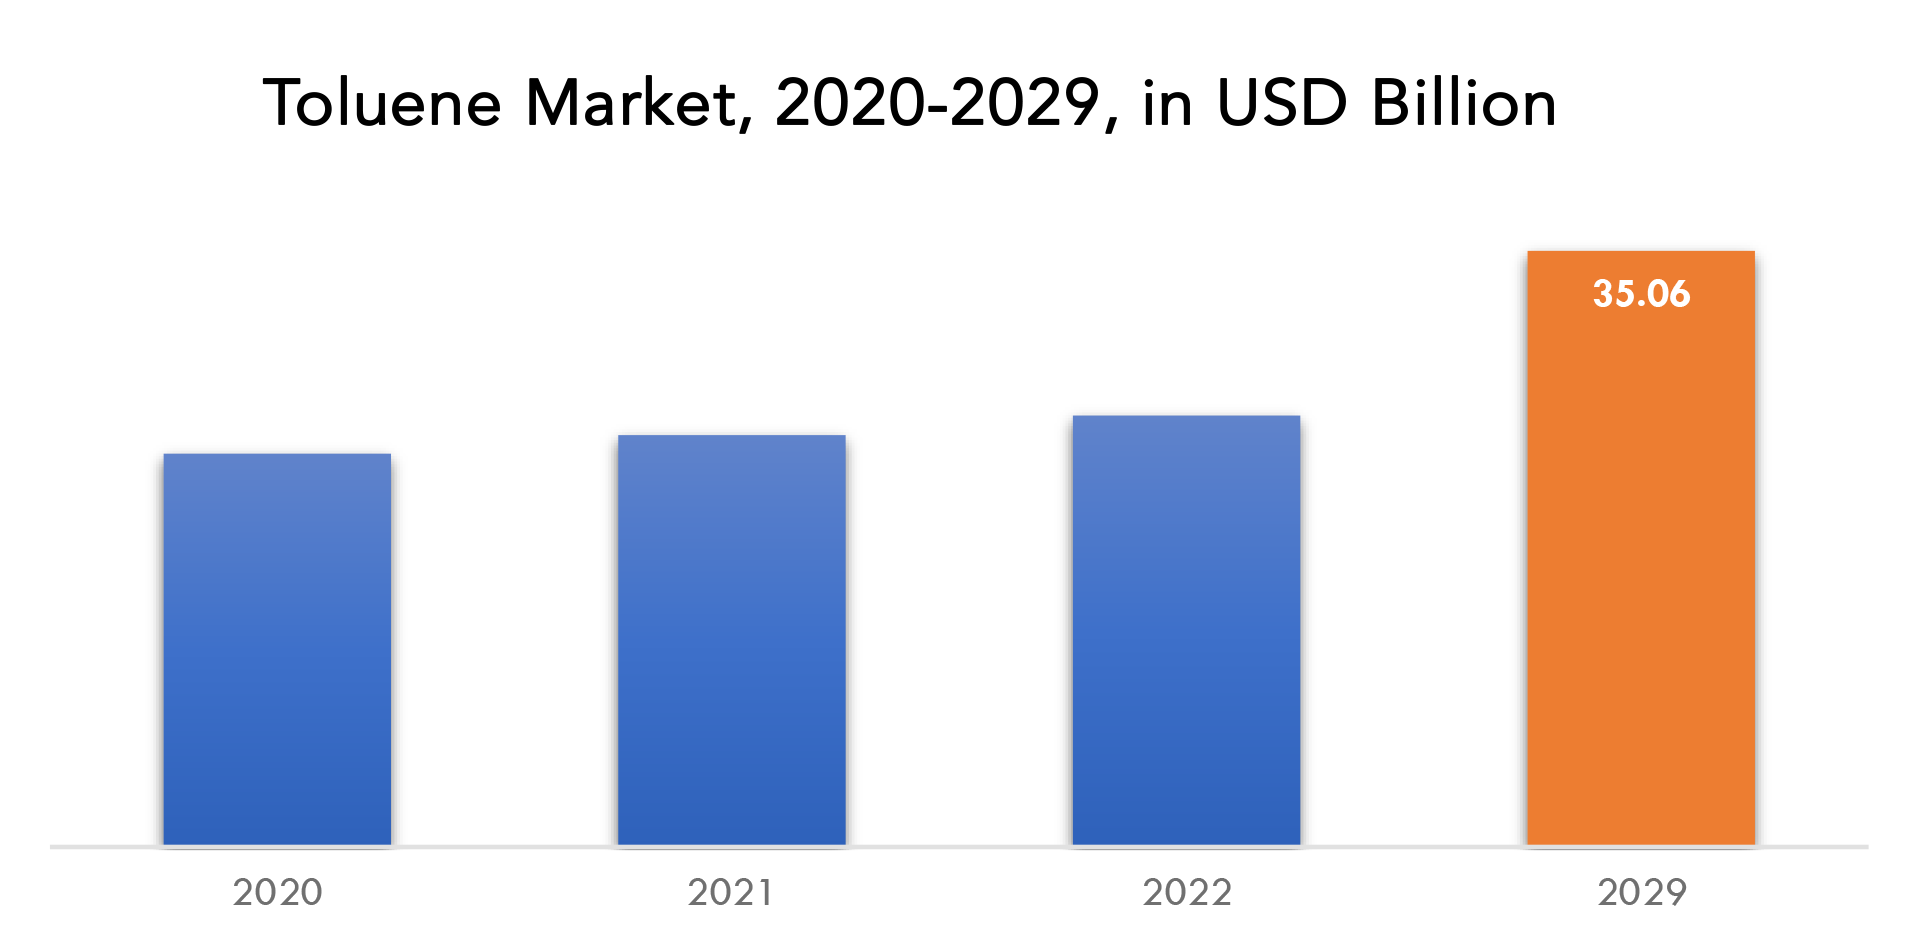
Toluene Market Key Players
The global market is fragmented in nature with the presence of various key players such BASF, BP Chemicals, ConocoPhillips, ExxonMobil Chemicals, Mitsui Chemicals, Reliance Industries, Shell, Sinopec, Valero Energy, Chevron Phillips Chemical, LyondellBasell Industries, Indian Oil Corporation Limited, Bharat Petroleum Corporation along with medium and small-scale regional players operating in different parts of the world. Major companies in the market compete in terms of application development capability, product launches, and development of new technologies for product formulation.
Industry Development:
November 9, 2022 - Mitsui Chemicals, Inc. has obtained certification for several products through the International Sustainability and Carbon Certification (ISCC) PLUS system for certifying sustainable products. Mitsui Chemicals continued its efforts to acquire ISCC PLUS certification across the Mitsui Chemicals Group, with the goal of expanding the social implementation of biomass-based products under a mass balance system and contributing to further advances in society's use of biomass. September 12, 2022 - Covestro introduced more environmentally friendly polyether polyols made from bio-circular raw materials.Who Should Buy? Or Key stakeholders
- Toluene Manufacturers
- Toluene Suppliers
- Distributors
- Government Bodies
- Market Research Organizations
- Consulting Firms
- Toluene Dealers
- End Users
- Raw Material Suppliers
Toluene Market Regional Analysis
Geographically, the refrigeration oil market is segmented into North America, South America, Europe, APAC and MEA.
- North America: includes the US, Canada, Mexico
- Europe: includes UK, Germany, France, Italy, Spain, Russia, and Rest of Europe
- Asia Pacific: includes China, Japan, South Korea, India, Australia, ASEAN and Rest of APAC
- South America: includes Brazil, Argentina and Rest of South America
- Middle East & Africa: includes Turkey, UAE, Saudi Arabia, South Africa, and Rest of MEA
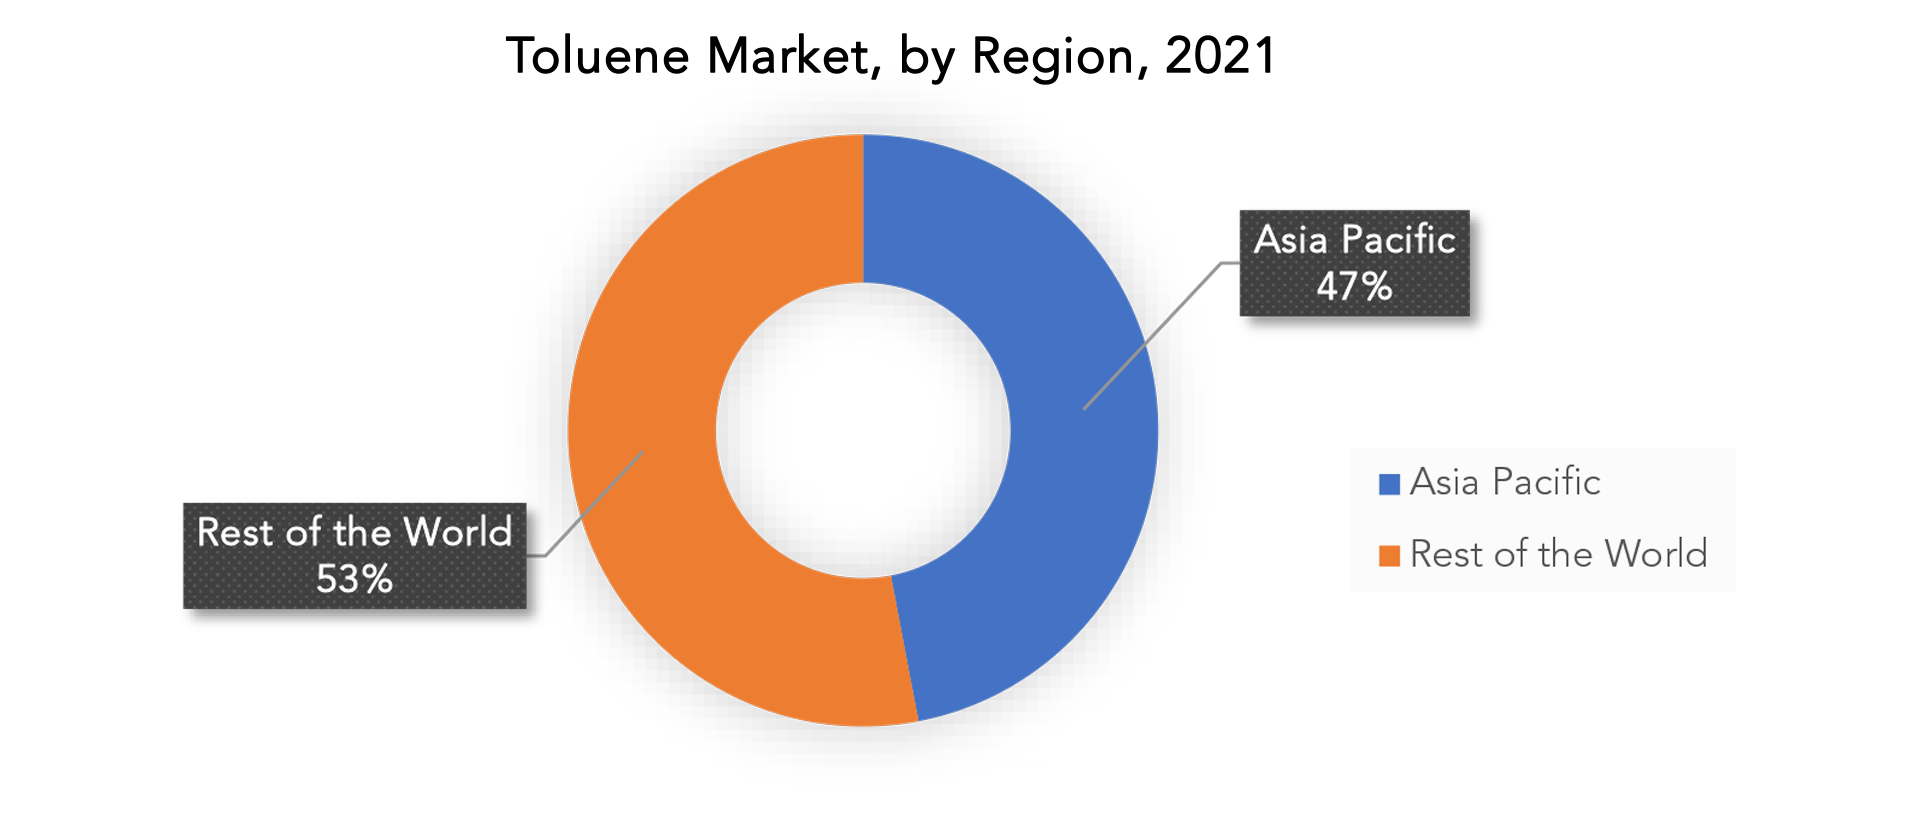
The Asia-Pacific region is the largest toluene market, accounting for more than 47% of the global market. This region is expected to grow significantly due to rising toluene demand from various end-use industries such as automotive, construction, and packaging. China is the region's largest toluene consumer, followed by Japan, South Korea, and India.
North America is the second-largest market for toluene, owing to rising demand for solvents and chemicals from industries such as paints and coatings, adhesives, and polymers. The United States is the region's largest toluene consumer, followed by Canada and Mexico.
Key Market Segments: Toluene Market
Toluene Market By Production Process, 2020-2029, (USD Billion) (Kilotons)- Reformate Processes
- Pygas Processes
- Styrene Processes
- Coke/Coal Processes
- Benzene & Xylene
- Toluene Diisocynates
- Gasoline Additives
- Others
- Building And Construction,
- Automotive,
- Oil And Gas,
- Paints And Coatings,
- Pharmaceuticals, And
- Others
- North America
- Europe
- Asia Pacific
- South America
- Middle East And Africa
Exactitude Consultancy Services Key Objectives:
- Increasing sales and market share
- Developing new technology
- Improving profitability
- Entering new markets
- Enhancing brand reputation
Key Question Answered
- What is the expected growth rate of the toluene market over the next 7 years?
- Who are the major players in the toluene market and what is their market share?
- What are the end-user industries driving demand for market and what is their outlook?
- What are the opportunities for growth in emerging markets such as Asia-Pacific, Middle East, and Africa?
- How is the economic environment affecting the toluene market, including factors such as interest rates, inflation, and exchange rates?
- What is the expected impact of government policies and regulations on toluene market?
- What is the current and forecasted size and growth rate of the global toluene market?
- What are the key drivers of growth in the toluene market?
- Who are the major players in the market and what is their market share?
- What are the distribution channels and supply chain dynamics in the toluene market?
- What are the technological advancements and innovations in the toluene market and their impact on product development and growth?
- What are the regulatory considerations and their impact on the market?
- What are the challenges faced by players in the toluene market and how are they addressing these challenges?
- What are the opportunities for growth and expansion in the toluene market?
- What are the product offerings and specifications of leading players in the market?
- What is the pricing trend of toluene in the market and what is the impact of raw material prices on the price trend?
- INTRODUCTION
- MARKET DEFINITION
- MARKET SEGMENTATION
- RESEARCH TIMELINES
- ASSUMPTIONS AND LIMITATIONS
- RESEARCH METHODOLOGY
- DATA MINING
- SECONDARY RESEARCH
- PRIMARY RESEARCH
- SUBJECT-MATTER EXPERTS’ ADVICE
- QUALITY CHECKS
- FINAL REVIEW
- DATA TRIANGULATION
- BOTTOM-UP APPROACH
- TOP-DOWN APPROACH
- RESEARCH FLOW
- DATA SOURCES
- DATA MINING
- EXECUTIVE SUMMARY
- MARKET OVERVIEW
- TOLUENE MARKET OUTLOOK
- MARKET DRIVERS
- MARKET RESTRAINTS
- MARKET OPPORTUNITIES
- IMPACT OF COVID-19 ON TOLUENE MARKET
- PORTER’S FIVE FORCES MODEL
- THREAT FROM NEW ENTRANTS
- THREAT FROM SUBSTITUTES
- BARGAINING POWER OF SUPPLIERS
- BARGAINING POWER OF CUSTOMERS
- DEGREE OF COMPETITION
- INDUSTRY VALUE CHAIN ANALYSIS
- TOLUENE MARKET OUTLOOK
- TOLUENE MARKET BY PRODUCTION PROCESS, 2020-2029, (USD BILLION) (KILOTONS)
- REFORMATE PROCESSES
- PYGAS PROCESSES
- STYRENE PROCESSES
- COKE/COAL PROCESSES
- GLOBAL TOLUENE MARKET BY DERIVATIVE TYPE, 2020-2029, (USD BILLION) (KILOTONS)
- BENZENE & XYLENE
- TOLUENE DIISOCYNATES
- GASOLINE ADDITIVES
- OTHERS
- GLOBAL TOLUENE MARKET BY APPLICATION, 2020-2029, (USD BILLION) (KILOTONS)
- BUILDING AND CONSTRUCTION,
- AUTOMOTIVE,
- OIL AND GAS,
- PAINTS AND COATINGS,
- PHARMACEUTICALS, AND
- OTHERS
- GLOBAL TOLUENE MARKET BY REGION, 2020-2029, (USD BILLION) (KILOTONS)
- NORTH AMERICA
- US
- CANADA
- MEXICO
- SOUTH AMERICA
- BRAZIL
- ARGENTINA
- COLOMBIA
- REST OF SOUTH AMERICA
- EUROPE
- GERMANY
- UK
- FRANCE
- ITALY
- SPAIN
- RUSSIA
- REST OF EUROPE
- ASIA PACIFIC
- INDIA
- CHINA
- JAPAN
- SOUTH KOREA
- AUSTRALIA
- SOUTH-EAST ASIA
- REST OF ASIA PACIFIC
- MIDDLE EAST AND AFRICA
- UAE
- SAUDI ARABIA
- SOUTH AFRICA
- REST OF MIDDLE EAST AND AFRICA
- NORTH AMERICA
- COMPANY PROFILES*
(BUSINESS OVERVIEW, COMPANY SNAPSHOT, PRODUCTS OFFERED, RECENT DEVELOPMENTS)
- BASF
- BP CHEMICALS
- CONOCOPHILLIPS
- EXXONMOBIL CHEMICALS
- MITSUI CHEMICALS
- RELIANCE INDUSTRIES
- SHELL
- SINOPEC
- VALERO ENERGY
- CHEVRON PHILLIPS CHEMICAL
- LYONDELLBASELL INDUSTRIES
- INDIAN OIL CORPORATION LIMITED
- BHARAT PETROLEUM CORPORATION
*THE COMPANY LIST IS INDICATIVE
LIST OF TABLES
TABLE 1 GLOBAL TOLUENE MARKET BY PRODUCTION PROCESS (USD BILLION) 2020-2029
TABLE 2 GLOBAL TOLUENE MARKET BY PRODUCTION PROCESS (KILOTONS) 2020-2029
TABLE 3 GLOBAL TOLUENE MARKET BY DERIVATIVE TYPE (USD BILLION) 2020-2029
TABLE 4 GLOBAL TOLUENE MARKET BY DERIVATIVE TYPE (KILOTONS) 2020-2029
TABLE 5 GLOBAL TOLUENE MARKET BY APPLICATION (USD BILLION) 2020-2029
TABLE 6 GLOBAL TOLUENE MARKET BY APPLICATION (KILOTONS) 2020-2029
TABLE 7 GLOBAL TOLUENE MARKET BY REGION (USD BILLION) 2020-2029
TABLE 8 GLOBAL TOLUENE MARKET BY REGION (KILOTONS) 2020-2029
TABLE 9 NORTH AMERICA TOLUENE MARKET BY PRODUCTION PROCESS (USD BILLION) 2020-2029
TABLE 10 NORTH AMERICA TOLUENE MARKET BY PRODUCTION PROCESS (KILOTONS) 2020-2029
TABLE 11 NORTH AMERICA TOLUENE MARKET BY DERIVATIVE TYPE (USD BILLION) 2020-2029
TABLE 12 NORTH AMERICA TOLUENE MARKET BY DERIVATIVE TYPE (KILOTONS) 2020-2029
TABLE 13 NORTH AMERICA TOLUENE MARKET BY APPLICATION (USD BILLION) 2020-2029
TABLE 14 NORTH AMERICA TOLUENE MARKET BY APPLICATION (KILOTONS) 2020-2029
TABLE 15 NORTH AMERICA TOLUENE MARKET BY COUNTRY (USD BILLION) 2020-2029
TABLE 16 NORTH AMERICA TOLUENE MARKET BY COUNTRY (KILOTONS) 2020-2029
TABLE 17 US TOLUENE MARKET BY PRODUCTION PROCESS (USD BILLION) 2020-2029
TABLE 18 US TOLUENE MARKET BY PRODUCTION PROCESS (KILOTONS) 2020-2029
TABLE 19 US TOLUENE MARKET BY DERIVATIVE TYPE (USD BILLION) 2020-2029
TABLE 20 US TOLUENE MARKET BY DERIVATIVE TYPE (KILOTONS) 2020-2029
TABLE 21 US TOLUENE MARKET BY APPLICATION (USD BILLION) 2020-2029
TABLE 22 US TOLUENE MARKET BY APPLICATION (KILOTONS) 2020-2029
TABLE 23 US TOLUENE MARKET BY REGION (USD BILLION) 2020-2029
TABLE 24 US TOLUENE MARKET BY REGION(KILOTONS) 2020-2029
TABLE 25 CANADA TOLUENE MARKET BY PRODUCTION PROCESS (USD BILLION) 2020-2029
TABLE 26 CANADA TOLUENE MARKET BY PRODUCTION PROCESS (KILOTONS) 2020-2029
TABLE 27 CANADA TOLUENE MARKET BY DERIVATIVE TYPE (USD BILLION) 2020-2029
TABLE 28 CANADA TOLUENE MARKET BY DERIVATIVE TYPE (KILOTONS) 2020-2029
TABLE 29 CANADA TOLUENE MARKET BY APPLICATION (USD BILLION) 2020-2029
TABLE 30 CANADA TOLUENE MARKET BY APPLICATION (KILOTONS) 2020-2029
TABLE 31 CANADA TOLUENE MARKET BY REGION (USD BILLION) 2020-2029
TABLE 32 CANADA TOLUENE MARKET BY REGION (KILOTONS) 2020-2029
TABLE 33 MEXICO TOLUENE MARKET BY PRODUCTION PROCESS (USD BILLION) 2020-2029
TABLE 34 MEXICO TOLUENE MARKET BY PRODUCTION PROCESS (KILOTONS) 2020-2029
TABLE 35 MEXICO TOLUENE MARKET BY DERIVATIVE TYPE (USD BILLION) 2020-2029
TABLE 36 MEXICO TOLUENE MARKET BY DERIVATIVE TYPE (KILOTONS) 2020-2029
TABLE 37 MEXICO TOLUENE MARKET BY APPLICATION (USD BILLION) 2020-2029
TABLE 38 MEXICO TOLUENE MARKET BY APPLICATION (KILOTONS) 2020-2029
TABLE 39 MEXICO TOLUENE MARKET BY REGION (USD BILLION) 2020-2029
TABLE 40 MEXICO TOLUENE MARKET BY REGION (KILOTONS) 2020-2029
TABLE 41 SOUTH AMERICA TOLUENE MARKET BY PRODUCTION PROCESS (USD BILLION) 2020-2029
TABLE 42 SOUTH AMERICA TOLUENE MARKET BY PRODUCTION PROCESS (KILOTONS) 2020-2029
TABLE 43 SOUTH AMERICA TOLUENE MARKET BY DERIVATIVE TYPE (USD BILLION) 2020-2029
TABLE 44 SOUTH AMERICA TOLUENE MARKET BY DERIVATIVE TYPE (KILOTONS) 2020-2029
TABLE 45 SOUTH AMERICA TOLUENE MARKET BY APPLICATION (USD BILLION) 2020-2029
TABLE 46 SOUTH AMERICA TOLUENE MARKET BY APPLICATION (KILOTONS) 2020-2029
TABLE 47 SOUTH AMERICA TOLUENE MARKET BY COUNTRY (USD BILLION) 2020-2029
TABLE 48 SOUTH AMERICA TOLUENE MARKET BY COUNTRY (KILOTONS) 2020-2029
TABLE 49 BRAZIL TOLUENE MARKET BY PRODUCTION PROCESS (USD BILLION) 2020-2029
TABLE 50 BRAZIL TOLUENE MARKET BY PRODUCTION PROCESS (KILOTONS) 2020-2029
TABLE 51 BRAZIL TOLUENE MARKET BY DERIVATIVE TYPE (USD BILLION) 2020-2029
TABLE 52 BRAZIL TOLUENE MARKET BY DERIVATIVE TYPE (KILOTONS) 2020-2029
TABLE 53 BRAZIL TOLUENE MARKET BY APPLICATION (USD BILLION) 2020-2029
TABLE 54 BRAZIL TOLUENE MARKET BY APPLICATION (KILOTONS) 2020-2029
TABLE 55 BRAZIL TOLUENE MARKET BY REGION (USD BILLION) 2020-2029
TABLE 56 BRAZIL TOLUENE MARKET BY REGION (KILOTONS) 2020-2029
TABLE 57 ARGENTINA TOLUENE MARKET BY PRODUCTION PROCESS (USD BILLION) 2020-2029
TABLE 58 ARGENTINA TOLUENE MARKET BY PRODUCTION PROCESS (KILOTONS) 2020-2029
TABLE 59 ARGENTINA TOLUENE MARKET BY DERIVATIVE TYPE (USD BILLION) 2020-2029
TABLE 60 ARGENTINA TOLUENE MARKET BY DERIVATIVE TYPE (KILOTONS) 2020-2029
TABLE 61 ARGENTINA TOLUENE MARKET BY APPLICATION (USD BILLION) 2020-2029
TABLE 62 ARGENTINA TOLUENE MARKET BY APPLICATION (KILOTONS) 2020-2029
TABLE 63 ARGENTINA TOLUENE MARKET BY REGION (USD BILLION) 2020-2029
TABLE 64 ARGENTINA TOLUENE MARKET BY REGION (KILOTONS) 2020-2029
TABLE 65 COLOMBIA TOLUENE MARKET BY PRODUCTION PROCESS (USD BILLION) 2020-2029
TABLE 66 COLOMBIA TOLUENE MARKET BY PRODUCTION PROCESS (KILOTONS) 2020-2029
TABLE 67 COLOMBIA TOLUENE MARKET BY DERIVATIVE TYPE (USD BILLION) 2020-2029
TABLE 68 COLOMBIA TOLUENE MARKET BY DERIVATIVE TYPE (KILOTONS) 2020-2029
TABLE 69 COLOMBIA TOLUENE MARKET BY APPLICATION (USD BILLION) 2020-2029
TABLE 70 COLOMBIA TOLUENE MARKET BY APPLICATION (KILOTONS) 2020-2029
TABLE 71 COLOMBIA TOLUENE MARKET BY REGION (USD BILLION) 2020-2029
TABLE 72 COLOMBIA TOLUENE MARKET BY REGION (KILOTONS) 2020-2029
TABLE 73 REST OF SOUTH AMERICA TOLUENE MARKET BY PRODUCTION PROCESS (USD BILLION) 2020-2029
TABLE 74 REST OF SOUTH AMERICA TOLUENE MARKET BY PRODUCTION PROCESS (KILOTONS) 2020-2029
TABLE 75 REST OF SOUTH AMERICA TOLUENE MARKET BY DERIVATIVE TYPE (USD BILLION) 2020-2029
TABLE 76 REST OF SOUTH AMERICA TOLUENE MARKET BY DERIVATIVE TYPE (KILOTONS) 2020-2029
TABLE 77 REST OF SOUTH AMERICA TOLUENE MARKET BY APPLICATION (USD BILLION) 2020-2029
TABLE 78 REST OF SOUTH AMERICA TOLUENE MARKET BY APPLICATION (KILOTONS) 2020-2029
TABLE 79 REST OF SOUTH AMERICA TOLUENE MARKET BY REGION (USD BILLION) 2020-2029
TABLE 80 REST OF SOUTH AMERICA TOLUENE MARKET BY REGION (KILOTONS) 2020-2029
TABLE 81 ASIA-PACIFIC TOLUENE MARKET BY PRODUCTION PROCESS (USD BILLION) 2020-2029
TABLE 82 ASIA-PACIFIC TOLUENE MARKET BY PRODUCTION PROCESS (KILOTONS) 2020-2029
TABLE 83 ASIA-PACIFIC TOLUENE MARKET BY DERIVATIVE TYPE (USD BILLION) 2020-2029
TABLE 84 ASIA-PACIFIC TOLUENE MARKET BY DERIVATIVE TYPE (KILOTONS) 2020-2029
TABLE 85 ASIA-PACIFIC TOLUENE MARKET BY APPLICATION (USD BILLION) 2020-2029
TABLE 86 ASIA-PACIFIC TOLUENE MARKET BY APPLICATION (KILOTONS) 2020-2029
TABLE 87 ASIA-PACIFIC TOLUENE MARKET BY COUNTRY (USD BILLION) 2020-2029
TABLE 88 ASIA-PACIFIC TOLUENE MARKET BY COUNTRY (KILOTONS) 2020-2029
TABLE 89 INDIA TOLUENE MARKET BY PRODUCTION PROCESS (USD BILLION) 2020-2029
TABLE 90 INDIA TOLUENE MARKET BY PRODUCTION PROCESS (KILOTONS) 2020-2029
TABLE 91 INDIA TOLUENE MARKET BY DERIVATIVE TYPE (USD BILLION) 2020-2029
TABLE 92 INDIA TOLUENE MARKET BY DERIVATIVE TYPE (KILOTONS) 2020-2029
TABLE 93 INDIA TOLUENE MARKET BY APPLICATION (USD BILLION) 2020-2029
TABLE 94 INDIA TOLUENE MARKET BY APPLICATION (KILOTONS) 2020-2029
TABLE 95 INDIA TOLUENE MARKET BY REGION (USD BILLION) 2020-2029
TABLE 96 INDIA TOLUENE MARKET BY REGION (KILOTONS) 2020-2029
TABLE 97 CHINA TOLUENE MARKET BY PRODUCTION PROCESS (USD BILLION) 2020-2029
TABLE 98 CHINA TOLUENE MARKET BY PRODUCTION PROCESS (KILOTONS) 2020-2029
TABLE 99 CHINA TOLUENE MARKET BY DERIVATIVE TYPE (USD BILLION) 2020-2029
TABLE 100 CHINA TOLUENE MARKET BY DERIVATIVE TYPE (KILOTONS) 2020-2029
TABLE 101 CHINA TOLUENE MARKET BY APPLICATION (USD BILLION) 2020-2029
TABLE 102 CHINA TOLUENE MARKET BY APPLICATION (KILOTONS) 2020-2029
TABLE 103 CHINA TOLUENE MARKET BY REGION (USD BILLION) 2020-2029
TABLE 104 CHINA TOLUENE MARKET BY REGION (KILOTONS) 2020-2029
TABLE 105 JAPAN TOLUENE MARKET BY PRODUCTION PROCESS (USD BILLION) 2020-2029
TABLE 106 JAPAN TOLUENE MARKET BY PRODUCTION PROCESS (KILOTONS) 2020-2029
TABLE 107 JAPAN TOLUENE MARKET BY DERIVATIVE TYPE (USD BILLION) 2020-2029
TABLE 108 JAPAN TOLUENE MARKET BY DERIVATIVE TYPE (KILOTONS) 2020-2029
TABLE 109 JAPAN TOLUENE MARKET BY APPLICATION (USD BILLION) 2020-2029
TABLE 110 JAPAN TOLUENE MARKET BY APPLICATION (KILOTONS) 2020-2029
TABLE 111 JAPAN TOLUENE MARKET BY REGION (USD BILLION) 2020-2029
TABLE 112 JAPAN TOLUENE MARKET BY REGION (KILOTONS) 2020-2029
TABLE 113 SOUTH KOREA TOLUENE MARKET BY PRODUCTION PROCESS (USD BILLION) 2020-2029
TABLE 114 SOUTH KOREA TOLUENE MARKET BY PRODUCTION PROCESS (KILOTONS) 2020-2029
TABLE 115 SOUTH KOREA TOLUENE MARKET BY DERIVATIVE TYPE (USD BILLION) 2020-2029
TABLE 116 SOUTH KOREA TOLUENE MARKET BY DERIVATIVE TYPE (KILOTONS) 2020-2029
TABLE 117 SOUTH KOREA TOLUENE MARKET BY APPLICATION (USD BILLION) 2020-2029
TABLE 118 SOUTH KOREA TOLUENE MARKET BY APPLICATION (KILOTONS) 2020-2029
TABLE 119 SOUTH KOREA TOLUENE MARKET BY REGION (USD BILLION) 2020-2029
TABLE 120 SOUTH KOREA TOLUENE MARKET BY REGION (KILOTONS) 2020-2029
TABLE 121 AUSTRALIA TOLUENE MARKET BY PRODUCTION PROCESS (USD BILLION) 2020-2029
TABLE 122 AUSTRALIA TOLUENE MARKET BY PRODUCTION PROCESS (KILOTONS) 2020-2029
TABLE 123 AUSTRALIA TOLUENE MARKET BY DERIVATIVE TYPE (USD BILLION) 2020-2029
TABLE 124 AUSTRALIA TOLUENE MARKET BY DERIVATIVE TYPE (KILOTONS) 2020-2029
TABLE 125 AUSTRALIA TOLUENE MARKET BY APPLICATION (USD BILLION) 2020-2029
TABLE 126 AUSTRALIA TOLUENE MARKET BY APPLICATION (KILOTONS) 2020-2029
TABLE 127 AUSTRALIA TOLUENE MARKET BY REGION (USD BILLION) 2020-2029
TABLE 128 AUSTRALIA TOLUENE MARKET BY REGION (KILOTONS) 2020-2029
TABLE 129 SOUTH-EAST ASIA TOLUENE MARKET BY PRODUCTION PROCESS (USD BILLION) 2020-2029
TABLE 130 SOUTH-EAST ASIA TOLUENE MARKET BY PRODUCTION PROCESS (KILOTONS) 2020-2029
TABLE 131 SOUTH-EAST ASIA TOLUENE MARKET BY DERIVATIVE TYPE (USD BILLION) 2020-2029
TABLE 132 SOUTH-EAST ASIA TOLUENE MARKET BY DERIVATIVE TYPE (KILOTONS) 2020-2029
TABLE 133 SOUTH-EAST ASIA TOLUENE MARKET BY APPLICATION (USD BILLION) 2020-2029
TABLE 134 SOUTH-EAST ASIA TOLUENE MARKET BY APPLICATION (KILOTONS) 2020-2029
TABLE 135 SOUTH-EAST ASIA TOLUENE MARKET BY REGION (USD BILLION) 2020-2029
TABLE 136 SOUTH-EAST ASIA TOLUENE MARKET BY REGION (KILOTONS) 2020-2029
TABLE 137 REST OF ASIA PACIFIC TOLUENE MARKET BY PRODUCTION PROCESS (USD BILLION) 2020-2029
TABLE 138 REST OF ASIA PACIFIC TOLUENE MARKET BY PRODUCTION PROCESS (KILOTONS) 2020-2029
TABLE 139 REST OF ASIA PACIFIC TOLUENE MARKET BY DERIVATIVE TYPE (USD BILLION) 2020-2029
TABLE 140 REST OF ASIA PACIFIC TOLUENE MARKET BY DERIVATIVE TYPE (KILOTONS) 2020-2029
TABLE 141 REST OF ASIA PACIFIC TOLUENE MARKET BY APPLICATION (USD BILLION) 2020-2029
TABLE 142 REST OF ASIA PACIFIC TOLUENE MARKET BY APPLICATION (KILOTONS) 2020-2029
TABLE 143 REST OF ASIA PACIFIC TOLUENE MARKET BY REGION (USD BILLION) 2020-2029
TABLE 144 REST OF ASIA PACIFIC TOLUENE MARKET BY REGION (KILOTONS) 2020-2029
TABLE 145 EUROPE TOLUENE MARKET BY PRODUCTION PROCESS (USD BILLION) 2020-2029
TABLE 146 EUROPE TOLUENE MARKET BY PRODUCTION PROCESS (KILOTONS) 2020-2029
TABLE 147 EUROPE TOLUENE MARKET BY DERIVATIVE TYPE (USD BILLION) 2020-2029
TABLE 148 EUROPE TOLUENE MARKET BY DERIVATIVE TYPE (KILOTONS) 2020-2029
TABLE 149 EUROPE TOLUENE MARKET BY APPLICATION (USD BILLION) 2020-2029
TABLE 150 EUROPE TOLUENE MARKET BY APPLICATION (KILOTONS) 2020-2029
TABLE 151 EUROPE TOLUENE MARKET BY COUNTRY (USD BILLION) 2020-2029
TABLE 152 EUROPE TOLUENE MARKET BY COUNTRY (KILOTONS) 2020-2029
TABLE 153 GERMANY TOLUENE MARKET BY PRODUCTION PROCESS (USD BILLION) 2020-2029
TABLE 154 GERMANY TOLUENE MARKET BY PRODUCTION PROCESS (KILOTONS) 2020-2029
TABLE 155 GERMANY TOLUENE MARKET BY DERIVATIVE TYPE (USD BILLION) 2020-2029
TABLE 156 GERMANY TOLUENE MARKET BY DERIVATIVE TYPE (KILOTONS) 2020-2029
TABLE 157 GERMANY TOLUENE MARKET BY APPLICATION (USD BILLION) 2020-2029
TABLE 158 GERMANY TOLUENE MARKET BY APPLICATION (KILOTONS) 2020-2029
TABLE 159 GERMANY TOLUENE MARKET BY REGION (USD BILLION) 2020-2029
TABLE 160 GERMANY TOLUENE MARKET BY REGION (KILOTONS) 2020-2029
TABLE 161 UK TOLUENE MARKET BY PRODUCTION PROCESS (USD BILLION) 2020-2029
TABLE 162 UK TOLUENE MARKET BY PRODUCTION PROCESS (KILOTONS) 2020-2029
TABLE 163 UK TOLUENE MARKET BY DERIVATIVE TYPE (USD BILLION) 2020-2029
TABLE 164 UK TOLUENE MARKET BY DERIVATIVE TYPE (KILOTONS) 2020-2029
TABLE 165 UK TOLUENE MARKET BY APPLICATION (USD BILLION) 2020-2029
TABLE 166 UK TOLUENE MARKET BY APPLICATION (KILOTONS) 2020-2029
TABLE 167 UK TOLUENE MARKET BY REGION (USD BILLION) 2020-2029
TABLE 168 UK TOLUENE MARKET BY REGION (KILOTONS) 2020-2029
TABLE 169 FRANCE TOLUENE MARKET BY PRODUCTION PROCESS (USD BILLION) 2020-2029
TABLE 170 FRANCE TOLUENE MARKET BY PRODUCTION PROCESS (KILOTONS) 2020-2029
TABLE 171 FRANCE TOLUENE MARKET BY DERIVATIVE TYPE (USD BILLION) 2020-2029
TABLE 172 FRANCE TOLUENE MARKET BY DERIVATIVE TYPE (KILOTONS) 2020-2029
TABLE 173 FRANCE TOLUENE MARKET BY APPLICATION (USD BILLION) 2020-2029
TABLE 174 FRANCE TOLUENE MARKET BY APPLICATION (KILOTONS) 2020-2029
TABLE 175 FRANCE TOLUENE MARKET BY REGION (USD BILLION) 2020-2029
TABLE 176 FRANCE TOLUENE MARKET BY REGION (KILOTONS) 2020-2029
TABLE 177 ITALY TOLUENE MARKET BY PRODUCTION PROCESS (USD BILLION) 2020-2029
TABLE 178 ITALY TOLUENE MARKET BY PRODUCTION PROCESS (KILOTONS) 2020-2029
TABLE 179 ITALY TOLUENE MARKET BY DERIVATIVE TYPE (USD BILLION) 2020-2029
TABLE 180 ITALY TOLUENE MARKET BY DERIVATIVE TYPE (KILOTONS) 2020-2029
TABLE 181 ITALY TOLUENE MARKET BY APPLICATION (USD BILLION) 2020-2029
TABLE 182 ITALY TOLUENE MARKET BY APPLICATION (KILOTONS) 2020-2029
TABLE 183 ITALY TOLUENE MARKET BY REGION (USD BILLION) 2020-2029
TABLE 184 ITALY TOLUENE MARKET BY REGION (KILOTONS) 2020-2029
TABLE 185 SPAIN TOLUENE MARKET BY PRODUCTION PROCESS (USD BILLION) 2020-2029
TABLE 186 SPAIN TOLUENE MARKET BY PRODUCTION PROCESS (KILOTONS) 2020-2029
TABLE 187 SPAIN TOLUENE MARKET BY DERIVATIVE TYPE (USD BILLION) 2020-2029
TABLE 188 SPAIN TOLUENE MARKET BY DERIVATIVE TYPE (KILOTONS) 2020-2029
TABLE 189 SPAIN TOLUENE MARKET BY APPLICATION (USD BILLION) 2020-2029
TABLE 190 SPAIN TOLUENE MARKET BY APPLICATION (KILOTONS) 2020-2029
TABLE 191 SPAIN TOLUENE MARKET BY REGION (USD BILLION) 2020-2029
TABLE 192 SPAIN TOLUENE MARKET BY REGION (KILOTONS) 2020-2029
TABLE 193 RUSSIA TOLUENE MARKET BY PRODUCTION PROCESS (USD BILLION) 2020-2029
TABLE 194 RUSSIA TOLUENE MARKET BY PRODUCTION PROCESS (KILOTONS) 2020-2029
TABLE 195 RUSSIA TOLUENE MARKET BY DERIVATIVE TYPE (USD BILLION) 2020-2029
TABLE 196 RUSSIA TOLUENE MARKET BY DERIVATIVE TYPE (KILOTONS) 2020-2029
TABLE 197 RUSSIA TOLUENE MARKET BY APPLICATION (USD BILLION) 2020-2029
TABLE 198 RUSSIA TOLUENE MARKET BY APPLICATION (KILOTONS) 2020-2029
TABLE 199 RUSSIA TOLUENE MARKET BY REGION (USD BILLION) 2020-2029
TABLE 200 RUSSIA TOLUENE MARKET BY REGION (KILOTONS) 2020-2029
TABLE 201 REST OF EUROPE TOLUENE MARKET BY PRODUCTION PROCESS (USD BILLION) 2020-2029
TABLE 202 REST OF EUROPE TOLUENE MARKET BY PRODUCTION PROCESS (KILOTONS) 2020-2029
TABLE 203 REST OF EUROPE TOLUENE MARKET BY DERIVATIVE TYPE (USD BILLION) 2020-2029
TABLE 204 REST OF EUROPE TOLUENE MARKET BY DERIVATIVE TYPE (KILOTONS) 2020-2029
TABLE 205 REST OF EUROPE TOLUENE MARKET BY APPLICATION (USD BILLION) 2020-2029
TABLE 206 REST OF EUROPE TOLUENE MARKET BY APPLICATION (KILOTONS) 2020-2029
TABLE 207 REST OF EUROPE TOLUENE MARKET BY REGION (USD BILLION) 2020-2029
TABLE 208 REST OF EUROPE TOLUENE MARKET BY REGION (KILOTONS) 2020-2029
TABLE 209 MIDDLE EAST AND AFRICA TOLUENE MARKET BY PRODUCTION PROCESS (USD BILLION) 2020-2029
TABLE 210 MIDDLE EAST AND AFRICA TOLUENE MARKET BY PRODUCTION PROCESS (KILOTONS) 2020-2029
TABLE 211 MIDDLE EAST AND AFRICA TOLUENE MARKET BY DERIVATIVE TYPE (USD BILLION) 2020-2029
TABLE 212 MIDDLE EAST AND AFRICA TOLUENE MARKET BY DERIVATIVE TYPE (KILOTONS) 2020-2029
TABLE 213 MIDDLE EAST AND AFRICA TOLUENE MARKET BY APPLICATION (USD BILLION) 2020-2029
TABLE 214 MIDDLE EAST AND AFRICA TOLUENE MARKET BY APPLICATION (KILOTONS) 2020-2029
TABLE 215 MIDDLE EAST AND AFRICA TOLUENE MARKET BY COUNTRY (USD BILLION) 2020-2029
TABLE 216 MIDDLE EAST AND AFRICA TOLUENE MARKET BY COUNTRY (KILOTONS) 2020-2029
TABLE 217 UAE TOLUENE MARKET BY PRODUCTION PROCESS (USD BILLION) 2020-2029
TABLE 218 UAE TOLUENE MARKET BY PRODUCTION PROCESS (KILOTONS) 2020-2029
TABLE 219 UAE TOLUENE MARKET BY DERIVATIVE TYPE (USD BILLION) 2020-2029
TABLE 220 UAE TOLUENE MARKET BY DERIVATIVE TYPE (KILOTONS) 2020-2029
TABLE 221 UAE TOLUENE MARKET BY APPLICATION (USD BILLION) 2020-2029
TABLE 222 UAE TOLUENE MARKET BY APPLICATION (KILOTONS) 2020-2029
TABLE 223 UAE TOLUENE MARKET BY REGION (USD BILLION) 2020-2029
TABLE 224 UAE TOLUENE MARKET BY REGION (KILOTONS) 2020-2029
TABLE 225 SAUDI ARABIA TOLUENE MARKET BY PRODUCTION PROCESS (USD BILLION) 2020-2029
TABLE 226 SAUDI ARABIA TOLUENE MARKET BY PRODUCTION PROCESS (KILOTONS) 2020-2029
TABLE 227 SAUDI ARABIA TOLUENE MARKET BY DERIVATIVE TYPE (USD BILLION) 2020-2029
TABLE 228 SAUDI ARABIA TOLUENE MARKET BY DERIVATIVE TYPE (KILOTONS) 2020-2029
TABLE 229 SAUDI ARABIA TOLUENE MARKET BY APPLICATION (USD BILLION) 2020-2029
TABLE 230 SAUDI ARABIA TOLUENE MARKET BY APPLICATION (KILOTONS) 2020-2029
TABLE 231 SAUDI ARABIA TOLUENE MARKET BY REGION (USD BILLION) 2020-2029
TABLE 232 SAUDI ARABIA TOLUENE MARKET BY REGION (KILOTONS) 2020-2029
TABLE 233 SOUTH AFRICA TOLUENE MARKET BY PRODUCTION PROCESS (USD BILLION) 2020-2029
TABLE 234 SOUTH AFRICA TOLUENE MARKET BY PRODUCTION PROCESS (KILOTONS) 2020-2029
TABLE 235 SOUTH AFRICA TOLUENE MARKET BY DERIVATIVE TYPE (USD BILLION) 2020-2029
TABLE 236 SOUTH AFRICA TOLUENE MARKET BY DERIVATIVE TYPE (KILOTONS) 2020-2029
TABLE 237 SOUTH AFRICA TOLUENE MARKET BY APPLICATION (USD BILLION) 2020-2029
TABLE 238 SOUTH AFRICA TOLUENE MARKET BY APPLICATION (KILOTONS) 2020-2029
TABLE 239 SOUTH AFRICA TOLUENE MARKET BY REGION (USD BILLION) 2020-2029
TABLE 240 SOUTH AFRICA TOLUENE MARKET BY REGION (KILOTONS) 2020-2029
TABLE 241 REST OF MIDDLE EAST AND AFRICA TOLUENE MARKET BY PRODUCTION PROCESS (USD BILLION) 2020-2029
TABLE 242 REST OF MIDDLE EAST AND AFRICA TOLUENE MARKET BY PRODUCTION PROCESS (KILOTONS) 2020-2029
TABLE 243 REST OF MIDDLE EAST AND AFRICA TOLUENE MARKET BY DERIVATIVE TYPE (USD BILLION) 2020-2029
TABLE 244 REST OF MIDDLE EAST AND AFRICA TOLUENE MARKET BY DERIVATIVE TYPE (KILOTONS) 2020-2029
TABLE 245 REST OF MIDDLE EAST AND AFRICA TOLUENE MARKET BY APPLICATION (USD BILLION) 2020-2029
TABLE 246 REST OF MIDDLE EAST AND AFRICA TOLUENE MARKET BY APPLICATION (KILOTONS) 2020-2029
TABLE 247 REST OF MIDDLE EAST AND AFRICA TOLUENE MARKET BY REGION (USD BILLION) 2020-2029
TABLE 248 REST OF MIDDLE EAST AND AFRICA TOLUENE MARKET BY REGION (KILOTONS) 2020-2029
LIST OF FIGURES
FIGURE 1 MARKET DYNAMICS
FIGURE 2 MARKET SEGMENTATION
FIGURE 3 REPORT TIMELINES: YEARS CONSIDERED
FIGURE 4 DATA TRIANGULATION
FIGURE 5 BOTTOM-UP APPROACH
FIGURE 6 TOP-DOWN APPROACH
FIGURE 7 RESEARCH FLOW
FIGURE 8 GLOBAL TOLUENE MARKET BY PRODUCTION PROCESS (USD BILLION) 2020-2029
FIGURE 9 GLOBAL TOLUENE MARKET BY DERIVATIVE TYPE (USD BILLION) 2020-2029
FIGURE 10 GLOBAL TOLUENE MARKET BY APPLICATION (USD BILLION) 2020-2029
FIGURE 11 GLOBAL TOLUENE MARKET BY REGION (USD BILLION) 2020-2029
FIGURE 12 PORTER’S FIVE FORCES MODEL
FIGURE 13 GLOBAL TOLUENE MARKET BY PRODUCTION PROCESS (USD BILLION) 2021
FIGURE 14 GLOBAL TOLUENE MARKET BY DERIVATIVE TYPE (USD BILLION) 2021
FIGURE 15 GLOBAL TOLUENE MARKET BY APPLICATION (USD BILLION) 2021
FIGURE 16 GLOBAL TOLUENE MARKET BY REGION (USD BILLION) 2021
FIGURE 17 NORTH AMERICA TOLUENE MARKET SNAPSHOT
FIGURE 18 EUROPE TOLUENE MARKET SNAPSHOT
FIGURE 19 SOUTH AMERICA TOLUENE MARKET SNAPSHOT
FIGURE 20 ASIA PACIFIC TOLUENE MARKET SNAPSHOT
FIGURE 21 MIDDLE EAST ASIA AND AFRICA TOLUENE MARKET SNAPSHOT
FIGURE 22 MARKET SHARE ANALYSIS
FIGURE 23 BASF: COMPANY SNAPSHOT
FIGURE 24 BP CHEMICALS: COMPANY SNAPSHOT
FIGURE 25 CONOCOPHILLIPS: COMPANY SNAPSHOT
FIGURE 26 EXXONMOBIL CHEMICALS: COMPANY SNAPSHOT
FIGURE 27 MITSUI CHEMICALS: COMPANY SNAPSHOT
FIGURE 28 RELIANCE INDUSTRIES: COMPANY SNAPSHOT
FIGURE 29 SHELL: COMPANY SNAPSHOT
FIGURE 30 SINOPEC: COMPANY SNAPSHOT
FIGURE 31 VALERO ENERGY: COMPANY SNAPSHOT
FIGURE 32 CHEVRON PHILLIPS CHEMICAL: COMPANY SNAPSHOT
FIGURE 33 LYONDELLBASELL INDUSTRIES: COMPANY SNAPSHOT
FIGURE 34 INDIAN OIL CORPORATION LIMITED: COMPANY SNAPSHOT
FIGURE 35 BHARAT PETROLEUM CORPORATION: COMPANY SNAPSHOT
DOWNLOAD FREE SAMPLE REPORT
License Type
SPEAK WITH OUR ANALYST
Want to know more about the report or any specific requirement?
WANT TO CUSTOMIZE THE REPORT?
Our Clients Speak
We asked them to research ‘ Equipment market’ all over the world, and their whole arrangement was helpful to us. thehealthanalytics.com insightful analysis and reports contributed to our current analysis and in creating a future strategy. Besides, the te
Yosuke Mitsui
Senior Associate Construction Equipment Sales & Marketing
We asked them to research ‘Equipment market’ all over the world, and their whole arrangement was helpful to us. thehealthanalytics.com insightful analysis and reports contributed to our current analysis and in creating a future strategy. Besides, the te


