

Base Year Value ()
x.x %
x.x %
CAGR ()
x.x %
x.x %
Forecast Year Value ()
x.x %
x.x %
Historical Data Period
Largest Region
Forecast Period
Plant Phenotyping Market by Product (Equipment, Software, Sensors), Service (Data Acquisition, Analysis, Others), Application Type (High-Throughput Screening, Trait Identification, Photosynthetic, Performance, Morphology, Others), End-User (Greenhouse, Laboratory, Field) By Region (North America, Europe, Asia Pacific, South America, Middle East and Africa) Global Trends and Forecast from 2023 to 2029
Instant access to hundreds of data points and trends
- Market estimates from 2014-2029
- Competitive analysis, industry segmentation, financial benchmarks
- Incorporates SWOT, Porter's Five Forces and risk management frameworks
- PDF report or online database with Word, Excel and PowerPoint export options
- 100% money back guarantee
Plant Phenotyping Market Overview
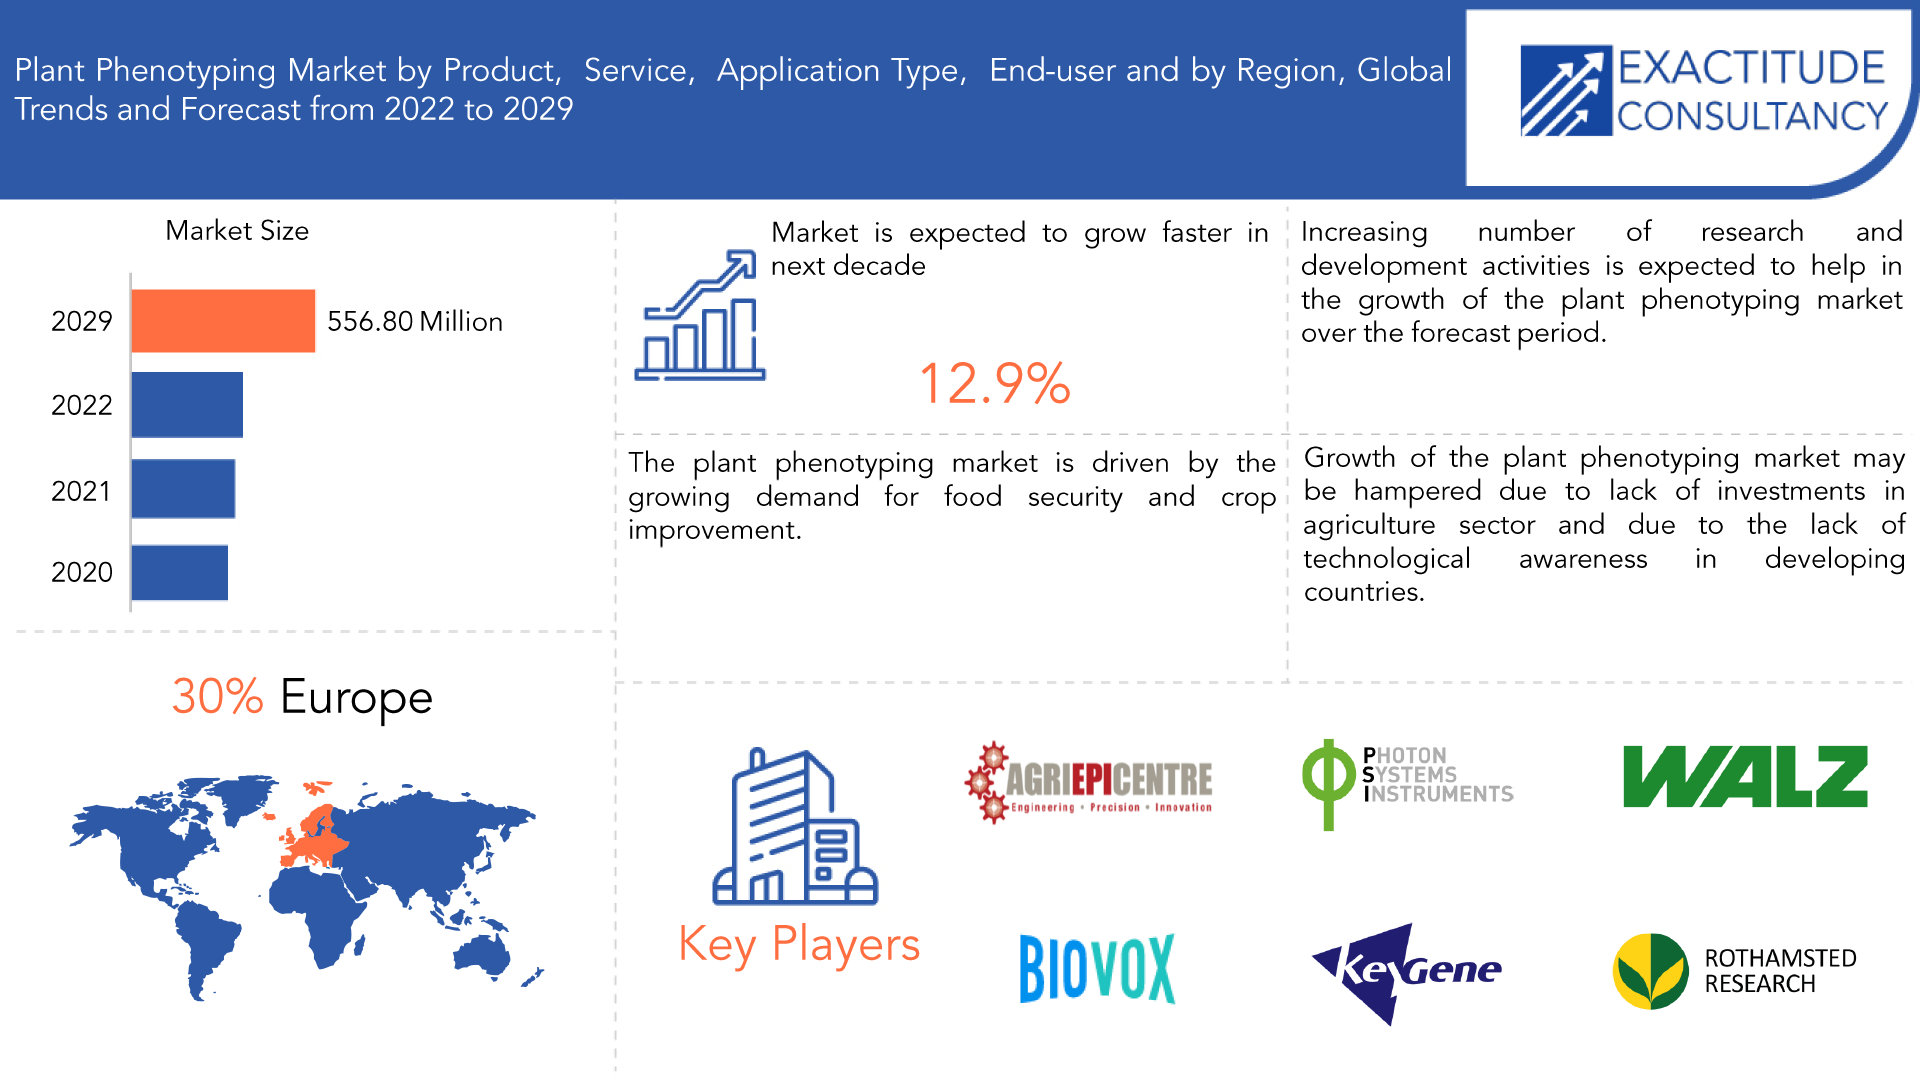
The plant phenotyping market is expected to grow at 12.9% CAGR from 2023 to 2029. It is expected to reach above USD 556.80 million by 2029.
Plant phenotyping refers to the process of measuring and analyzing the physical and biochemical properties of plants to understand their responses to environmental conditions, genetics, and management practices. This includes the study of plant traits such as morphology, physiology, growth, development, and metabolism, using various techniques and tools. The data obtained from plant phenotyping can help in breeding programs, crop improvement, and understanding the interactions between plants and their environment.
Plant phenotyping can provide valuable insights into the performance of crops under different environmental conditions, such as temperature, humidity, and nutrient availability. It can help farmers and researchers to optimize their crop management practices, such as planting density, fertilization, and irrigation, and to develop new crop varieties with desirable traits, such as resistance to pests and diseases, or tolerance to environmental stress. By collecting data on a wide range of plant traits, such as biomass accumulation, leaf area, photosynthetic efficiency, and root architecture, researchers and farmers can gain valuable insights into the performance of crops under different environmental conditions.
| ATTRIBUTE | DETAILS |
| Study period | 2023-2029 |
| Base year | 2021 |
| Estimated year | 2022 |
| Forecasted year | 2023-2029 |
| Historical period | 2018-2020 |
| Unit | Value (USD Million) |
| Segmentation | By product, service, application type, end-user, Region. |
| By Product
|
|
| By Service
|
|
| By Application Type
|
|
| By End-Use
|
|
| By Region
|
|
The market growth of plant phenotyping is being driven by several key factors. Firstly, there is a growing trend of expansions and investments in this field in developed regions, which is contributing to the market's expansion. Secondly, there have been significant advancements in imaging sensors, resulting in increased automation and high-throughput data collection, which has boosted the market's growth. Additionally, the rising incidence of seed-borne diseases is another factor driving the plant phenotyping market. Moreover, the use of remote sensing tools for field-based phenotyping is creating new opportunities, as is the development of research associations in emerging economies. These factors, among others, are expected to drive the growth of the plant phenotyping market in the forecast period.
[caption id="attachment_20581" align="aligncenter" width="1920"]
Frequently Asked Questions
• What is the worth of global plant phenotyping market?
The Plant Phenotyping market size had crossed USD 187 Million in 2020 and will observe a CAGR of more than 12.9% up to 2029
• Which market segments are covered in the report on the plant phenotyping market?
Based on product, service, application type, end-user, the plant phenotyping market report's divisions are broken down
• What is the CAGR of Plant Phenotyping market?
The global plant phenotyping market registered a CAGR of 12.9% from 2022 to 2029. The industry segment was the highest revenue contributor to the market.
• Which are the top companies to hold the market share in Plant Phenotyping market?
Key players profiled in the report include Agri-EPI Centre Ltd, BioVox, CropDesign, Delta-T Devices, Heinz Walz, Hiphen, KeyGene, LemnaTec, Pheno-Inspect GmbH, Phenomix, Phenospex, Photon System Republic, Plant-DiTech LTD, Quibit Phenomics, Rothamstad Research Limited and others.
• Which is the largest regional market for plant phenotyping market?
Europe is the largest regional market for plant phenotyping market.
Plant Phenotyping Market Segment Analysis
The global plant phenotyping market is segmented into product, service, application type, end-user and Region.
The plant phenotyping market is categorized into different product segments, including equipment, software, and sensors. Equipment is further divided into several sub-segments, such as site, platform/carrier, level of automation, analysis system, and application. Software is also segmented into various categories, such as data acquisition, image analysis, system control, data management, schedule assistant, experiment design, and database configuration. Additionally, sensors are divided into image sensors, normalized difference vegetation index (NDVI) sensors, temperature sensors, humidity sensors, and ultrasonic distance sensors. The equipment segment is expected to dominate the plant phenotyping market, while the sensors segment is expected to have the highest growth rate. The rise in accessibility and affordability of imaging equipment has led to an increasing number of plant breeders and researchers using this technology for plant phenotyping, while the demand for more accurate and efficient data collection is driving the growth of the sensors segment.
On the basis of service, the plant phenotyping market is segmented into Data Acquisition, Analysis, and others. Data Acquisition services typically involve the collection of data on plant growth and development using various sensors and imaging technologies. This data is then processed and analyzed to extract relevant information about plant traits and characteristics. Analysis services, on the other hand, involve the interpretation and analysis of plant phenotyping data to extract meaningful insights and draw conclusions. This can involve the use of advanced software tools and algorithms to identify patterns and relationships within the data. Other service category, involves consulting and training services, custom software development, and technical support services. These services can help to support the development, deployment, and use of plant phenotyping technologies in a wide range of applications, such as crop breeding, plant research, and product development.
Based on application type, the plant phenotyping market is segmented high-Throughput Screening, Trait Identification, Photosynthetic, Performance, Morphology, and others. In recent years, there has been a growing interest in high-throughput screening as a means of rapidly and efficiently identifying plants with desirable traits. This suggests that the high-throughput screening segment may be gaining momentum in the plant phenotyping market. Trait identification involves the use of plant phenotyping technology to identify specific traits, such as root length, leaf area, and biomass, that are important for crop performance. Photosynthetic performance is another important application of plant phenotyping, as it provides information on the efficiency of photosynthesis in plants, which is crucial for plant growth and development. Morphology is another important application of plant phenotyping that involves the measurement and analysis of plant structure, such as stem diameter, leaf angle, and plant height.
Based on end-users, the plant phenotyping market is segmented into greenhouse, laboratory and field. The greenhouse segment is expected to be the largest and grow at the fastest CAGR during the forecast period. Greenhouse phenotyping involves conducting experiments in a controlled environment that mimics natural conditions. This provides researchers with precise control over environmental factors such as temperature, humidity, light intensity, and CO2 concentration. Laboratories are another important end-user segment of the plant phenotyping market. Laboratory-based plant phenotyping involves the use of controlled environments and advanced imaging and analytical tools to study plant growth and development. This can be particularly useful for studying plant responses to specific environmental stimuli, such as temperature, light, and nutrient availability. Field-based plant phenotyping is another important end-user segment of the market, as it involves the study of plant growth and development in natural environments, such as farms and fields. This can provide valuable insights into the performance of crops under different environmental conditions and can help farmers to optimize their crop management practices.
[caption id="attachment_20586" align="aligncenter" width="1920"]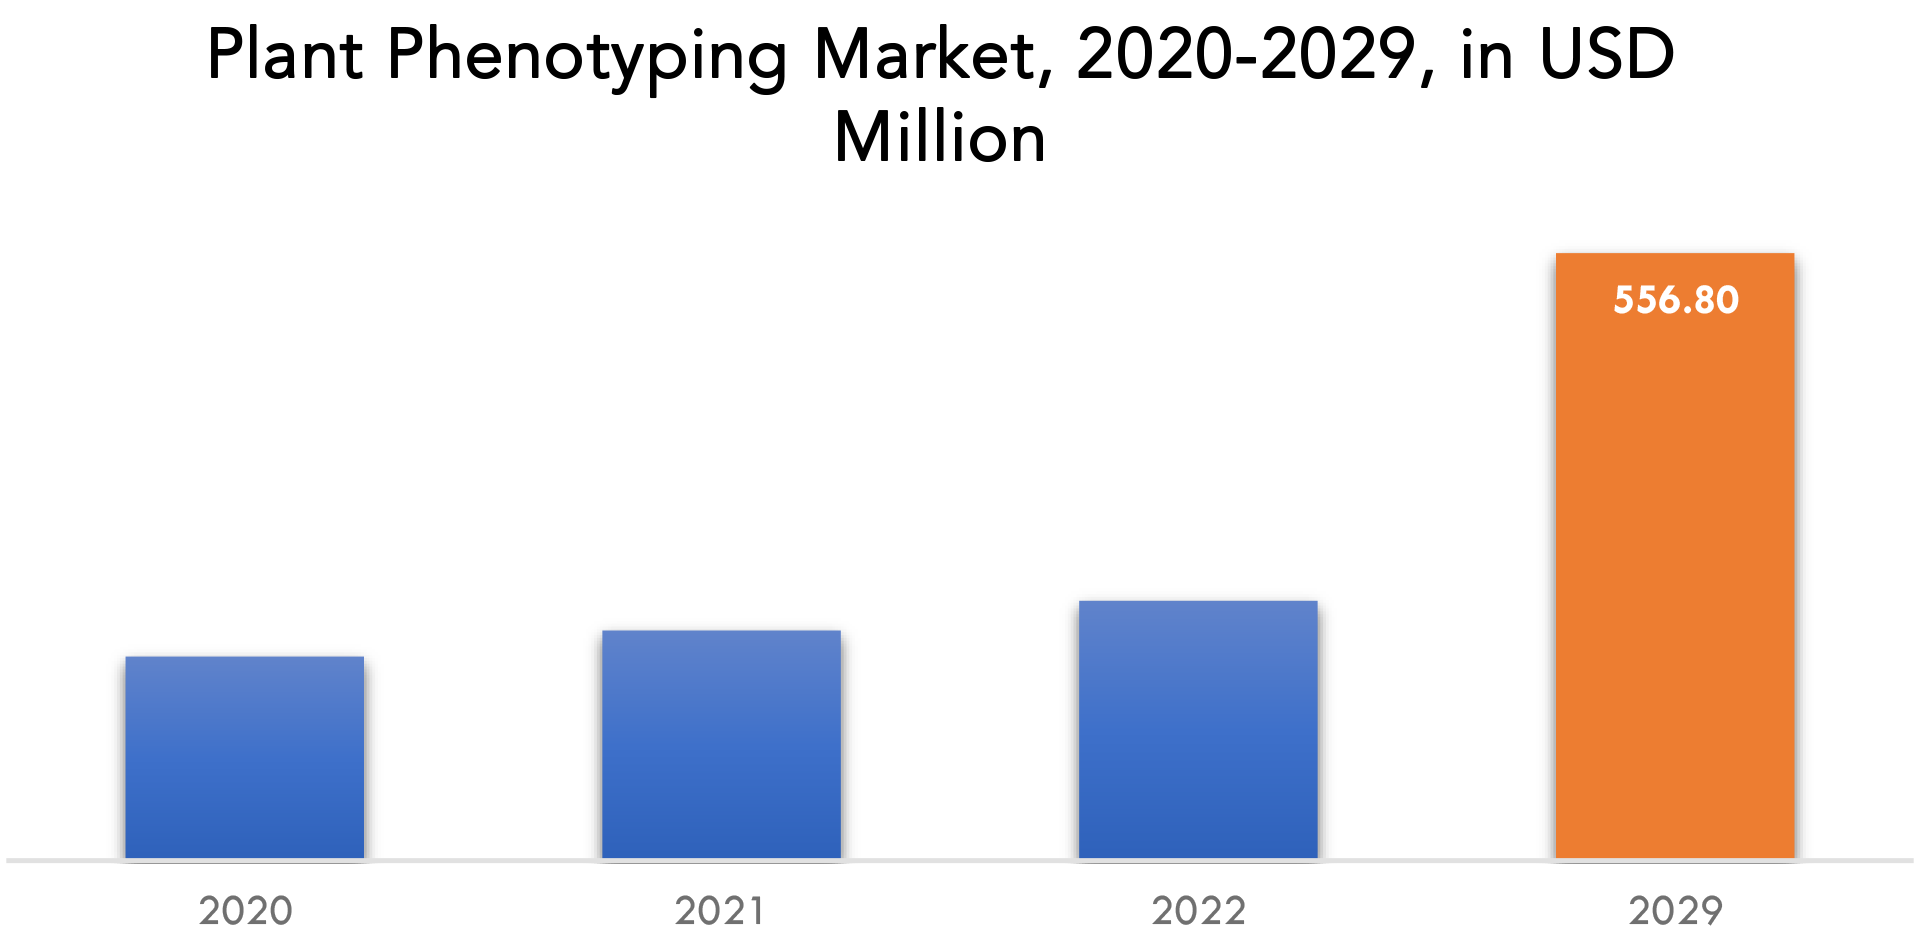 Plant
PlantPlant Phenotyping Market Players
The major players operating in the global Plant Phenotyping industry include Agri-EPI Centre Ltd, BioVox, CropDesign, Delta-T Devices, Heinz Walz, Hiphen, KeyGene, LemnaTec, Pheno-Inspect GmbH, Phenomix, Phenospex, Photon System Republic, Plant-DiTech LTD, Quibit Phenomics, Rothamstad Research Limited and others.
November 22, 2022: BGI-Sanya and KeyGene started its collaboration on spatial transcriptomics for fast identification of lead genes associated with important crop traits. March 3, 2022: Royal Van Zanten and KeyGene started their partnership to accelerate the breeding of ornamental crops.Plant Phenotyping Market Regional Analysis
Geographically, the Plant Phenotyping market is segmented into North America, South America, Europe, APAC and MEA.
- North America: includes the US, Canada, Mexico
- Europe: includes UK, Germany, France, Italy, Spain, Russia, and Rest of Europe
- Asia Pacific: includes China, Japan, South Korea, India, Australia, ASEAN and Rest of APAC
- South America: includes Brazil, Argentina and Rest of South America
- Middle East & Africa: includes Turkey, UAE, Saudi Arabia, South Africa, and Rest of MEA
Europe currently leads the world in plant phenotyping production, with European products exported globally. Europe held around 30% market share in the global plant phenotyping market. The industry offers a diverse range of products, from native to modified services, that can be applied as functional ingredients in various industries including food, non-food, and feed. While no particular end-use application industry dominates, the food industry is expected to experience the highest growth due to the emergence of newer plant phenotyping variations, products, and applications.
Additionally, Europe's plant phenotyping industry has been driven by the increasing demand for high-quality and sustainable agricultural practices. The adoption of precision agriculture and the development of novel phenotyping technologies have also contributed to the growth of the European plant phenotyping market.
Furthermore, there are many countries and regions around the world that are actively engaged in plant phenotyping research and development, including the United States, Australia, China, and several countries in Africa and South America. These regions have also made significant contributions to the field of plant phenotyping and have many companies and research institutions engaged in the production of plant phenotyping technologies.
[caption id="attachment_20587" align="aligncenter" width="1920"]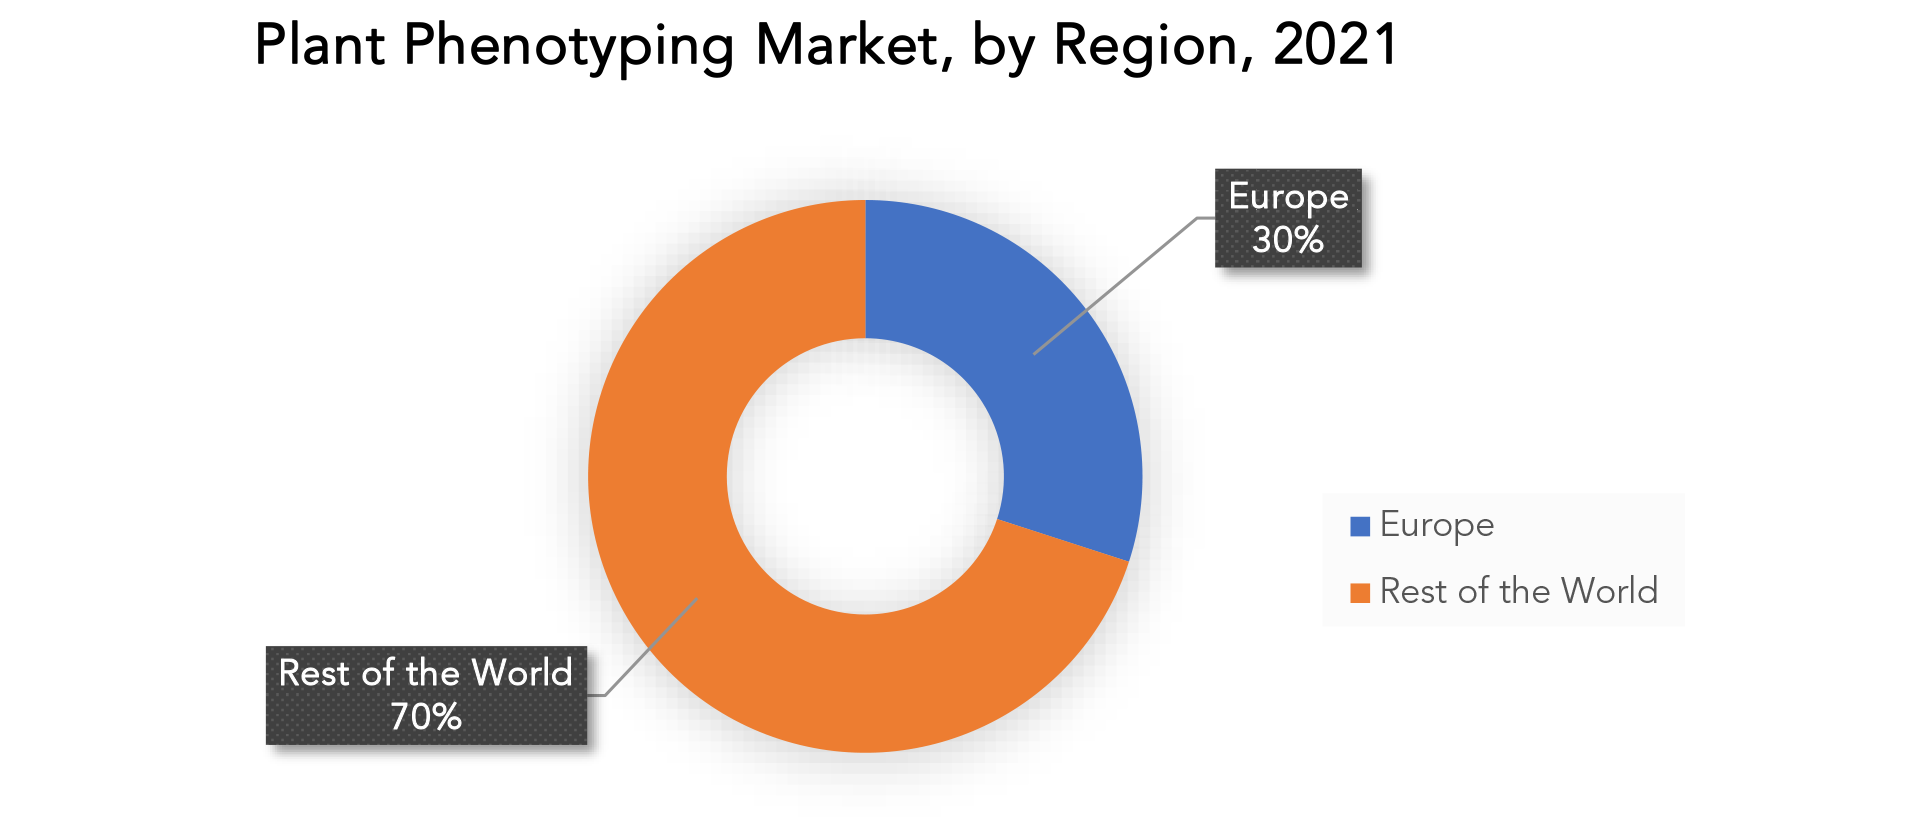
Key Market Segments: Plant Phenotyping Market
Plant Phenotyping Market By Product, (USD Million)- Equipment
- Software
- Sensors
- Data Acquisition
- Analysis
- Others
- High-Throughput Screening
- Trait Identification
- Photosynthetic Performance
- Morphology
- Others
- Greenhouse
- Laboratory
- Field
- North America
- Europe
- Asia Pacific
- South America
- Middle East And Africa
Exactitude Consultancy Services Key Objectives
- Increasing sales and market share
- Developing new technology
- Improving profitability
- Entering new markets
- Enhancing brand reputation
Key Question Answered
- What is the expected growth rate of the plant phenotyping market over the next 7 years?
- Who are the major players in the plant phenotyping market and what is their market share?
- What are the end-user industries driving demand for market and what is their outlook?
- What are the opportunities for growth in emerging markets such as Asia-Pacific, Middle East, and Africa?
- How is the economic environment affecting the plant phenotyping market, including factors such as interest rates, inflation, and exchange rates?
- What is the expected impact of government policies and regulations on the plant phenotyping market?
- What is the current and forecasted size and growth rate of the global plant phenotyping market?
- What are the key drivers of growth in the plant phenotyping market?
- What are the distribution channels and supply chain dynamics in the plant phenotyping market?
- What are the technological advancements and innovations in the plant phenotyping market and their impact on product development and growth?
- What are the regulatory considerations and their impact on the market?
- What are the challenges faced by players in the plant phenotyping market and how are they addressing these challenges?
- What are the opportunities for growth and expansion in the plant phenotyping market?
- What are the service offerings and specifications of leading players in the market?
- Introduction
- Market Definition
- Market Segmentation
- Research Timelines
- Assumptions and Limitations
- Research Methodology
- Data Mining
- Secondary Research
- Primary Research
- Subject-Matter Experts’ Advice
- Quality Checks
- Final Review
- Data Triangulation
- Bottom-Up Approach
- Top-Down Approach
- Research Flow
- Data Sources
- Data Mining
- Executive Summary
- Market Overview
- Global Plant Phenotyping Market Outlook
- Market Drivers
- Market Restraints
- Market Opportunities
- Impact of Covid-19 On the Global Plant Phenotyping Market
- Global Plant Phenotyping Market Outlook
- Global Plant Phenotyping Market by Product, (USD Million)
- Equipment
- Software
- Sensors
- Global Plant Phenotyping Market by Service, (USD Million)
- Data Acquisition
- Analysis
- Others
- Global Plant Phenotyping Market by Application Type, (USD Million)
- High-Throughput Screening
- Trait Identification
- Photosynthetic Performance
- Morphology
- Others
- Global Plant Phenotyping Market by End-User, (USD Million)
- Greenhouse
- Laboratory
- Field
- Global Plant Phenotyping Market by Region, (USD Million)
- Introduction
- Asia-Pacific
- China
- India
- Japan
- South Korea
- Australia
- South-East Asia
- Rest of Asia-Pacific
- North America
- United States
- Canada
- Mexico
- Europe
- Germany
- United Kingdom
- France
- Italy
- Spain
- Russia
- Rest of Europe
- South America
- Brazil
- Argentina
- Colombia
- Rest of South America
- Middle East and Africa
- UAE
- Saudi Arabia
- South Africa
- Rest of Middle East and Africa
- Company Profiles*
(Business Overview, Company Snapshot, Products Offered, Recent Developments)
- Agri-EPI Centre Ltd
- BioVox
- CropDesign
- Delta-T Devices
- Heinz Walz
- Hiphen
- KeyGene
- LemnaTec
- Pheno-Inspect GmbH
- Phenomix
- Phenospex
- Photon System Republic
- Plant-DiTech LTD
- Quibit Phenomics
- Rothamstad Research Limited
- Others
*The Company List Is Indicative
LIST OF TABLES
TABLE 1 GLOBAL PLANT PHENOTYPING MARKET BY PRODUCT (USD MILLION) 2020-2029
TABLE 2 GLOBAL PLANT PHENOTYPING MARKET BY SERVICE (USD MILLION) 2020-2029
TABLE 3 GLOBAL PLANT PHENOTYPING MARKET BY APPLICATION TYPE (USD MILLION) 2020-2029
TABLE 4 GLOBAL PLANT PHENOTYPING MARKET BY END-USER (USD MILLION) 2020-2029
TABLE 5 NORTH AMERICA PLANT PHENOTYPING MARKET BY COUNTRY (USD MILLION) 2020-2029
TABLE 6 NORTH AMERICAPLANT PHENOTYPING MARKET BY PRODUCT (USD MILLION) 2020-2029
TABLE 7 NORTH AMERICAPLANT PHENOTYPING MARKET BY SERVICE (USD MILLION) 2020-2029
TABLE 8 NORTH AMERICAPLANT PHENOTYPING MARKET BY APPLICATION TYPE (USD MILLION) 2020-2029
TABLE 9 NORTH AMERICAPLANT PHENOTYPING MARKET BY END-USER (USD MILLION) 2020-2029
TABLE 10 US PLANT PHENOTYPING MARKET BY PRODUCT (USD MILLION) 2020-2029
TABLE 11 US PLANT PHENOTYPING MARKET BY SERVICE (USD MILLION) 2020-2029
TABLE 12 US PLANT PHENOTYPING MARKET BY APPLICATION TYPE (USD MILLION) 2020-2029
TABLE 13 US PLANT PHENOTYPING MARKET BY END-USER (USD MILLION) 2020-2029
TABLE 14 CANADA PLANT PHENOTYPING MARKET BY PRODUCT (USD MILLION) 2020-2029
TABLE 15 CANADA PLANT PHENOTYPING MARKET BY SERVICE (USD MILLION) 2020-2029
TABLE 16 CANADA PLANT PHENOTYPING MARKET BY APPLICATION TYPE (USD MILLION) 2020-2029
TABLE 17 CANADA PLANT PHENOTYPING MARKET BY END-USER (USD MILLION) 2020-2029
TABLE 18 MEXICO PLANT PHENOTYPING MARKET BY PRODUCT (USD MILLION) 2020-2029
TABLE 19 MEXICO PLANT PHENOTYPING MARKET BY SERVICE (USD MILLION) 2020-2029
TABLE 20 MEXICO PLANT PHENOTYPING MARKET BY APPLICATION TYPE (USD MILLION) 2020-2029
TABLE 21 MEXICO PLANT PHENOTYPING MARKET BY END-USER (USD MILLION) 2020-2029
TABLE 22 SOUTH AMERICA PLANT PHENOTYPING MARKET BY COUNTRY (USD MILLION) 2020-2029
TABLE 23 SOUTH AMERICA PLANT PHENOTYPING MARKET BY PRODUCT (USD MILLION) 2020-2029
TABLE 24 SOUTH AMERICA PLANT PHENOTYPING MARKET BY SERVICE (USD MILLION) 2020-2029
TABLE 25 SOUTH AMERICA PLANT PHENOTYPING MARKET BY APPLICATION TYPE (USD MILLION) 2020-2029
TABLE 26 SOUTH AMERICA PLANT PHENOTYPING MARKET BY END-USER (USD MILLION) 2020-2029
TABLE 27 BRAZIL PLANT PHENOTYPING MARKET BY PRODUCT (USD MILLION) 2020-2029
TABLE 28 BRAZIL PLANT PHENOTYPING MARKET BY SERVICE (USD MILLION) 2020-2029
TABLE 29 BRAZIL PLANT PHENOTYPING MARKET BY APPLICATION TYPE (USD MILLION) 2020-2029
TABLE 30 BRAZIL PLANT PHENOTYPING MARKET BY END-USER (USD MILLION) 2020-2029
TABLE 31 ARGENTINA PLANT PHENOTYPING MARKET BY PRODUCT (USD MILLION) 2020-2029
TABLE 32 ARGENTINA PLANT PHENOTYPING MARKET BY SERVICE (USD MILLION) 2020-2029
TABLE 33 ARGENTINA PLANT PHENOTYPING MARKET BY APPLICATION TYPE (USD MILLION) 2020-2029
TABLE 34 ARGENTINA PLANT PHENOTYPING MARKET BY END-USER (USD MILLION) 2020-2029
TABLE 35 COLOMBIA PLANT PHENOTYPING MARKET BY PRODUCT (USD MILLION) 2020-2029
TABLE 36 COLOMBIA PLANT PHENOTYPING MARKET BY SERVICE (USD MILLION) 2020-2029
TABLE 37 COLOMBIA PLANT PHENOTYPING MARKET BY APPLICATION TYPE (USD MILLION) 2020-2029
TABLE 38 COLOMBIA PLANT PHENOTYPING MARKET BY END-USER (USD MILLION) 2020-2029
TABLE 39 REST OF SOUTH AMERICA PLANT PHENOTYPING MARKET BY PRODUCT (USD MILLION) 2020-2029
TABLE 40 REST OF SOUTH AMERICA PLANT PHENOTYPING MARKET BY SERVICE (USD MILLION) 2020-2029
TABLE 41 REST OF SOUTH AMERICA PLANT PHENOTYPING MARKET BY APPLICATION TYPE (USD MILLION) 2020-2029
TABLE 42 REST OF SOUTH AMERICA PLANT PHENOTYPING MARKET BY END-USER (USD MILLION) 2020-2029
TABLE 43 ASIA-PACIFIC PLANT PHENOTYPING MARKET BY COUNTRY (USD MILLION) 2020-2029
TABLE 44 ASIA-PACIFIC PLANT PHENOTYPING MARKET BY PRODUCT (USD MILLION) 2020-2029
TABLE 45 ASIA-PACIFICPLANT PHENOTYPING MARKET BY SERVICE (USD MILLION) 2020-2029
TABLE 46 ASIA-PACIFICPLANT PHENOTYPING MARKET BY APPLICATION TYPE (USD MILLION) 2020-2029
TABLE 47 ASIA-PACIFICPLANT PHENOTYPING MARKET BY END-USER (USD MILLION) 2020-2029
TABLE 48 INDIA PLANT PHENOTYPING MARKET BY PRODUCT (USD MILLION) 2020-2029
TABLE 49 INDIA PLANT PHENOTYPING MARKET BY SERVICE (USD MILLION) 2020-2029
TABLE 50 INDIA PLANT PHENOTYPING MARKET BY APPLICATION TYPE (USD MILLION) 2020-2029
TABLE 51 INDIA PLANT PHENOTYPING MARKET BY END-USER (USD MILLION) 2020-2029
TABLE 52 CHINA PLANT PHENOTYPING MARKET BY PRODUCT (USD MILLION) 2020-2029
TABLE 53 CHINA PLANT PHENOTYPING MARKET BY SERVICE (USD MILLION) 2020-2029
TABLE 54 CHINA PLANT PHENOTYPING MARKET BY APPLICATION TYPE (USD MILLION) 2020-2029
TABLE 55 CHINA PLANT PHENOTYPING MARKET BY END-USER (USD MILLION) 2020-2029
TABLE 56 JAPAN PLANT PHENOTYPING MARKET BY PRODUCT (USD MILLION) 2020-2029
TABLE 57 JAPAN PLANT PHENOTYPING MARKET BY SERVICE (USD MILLION) 2020-2029
TABLE 58 JAPAN PLANT PHENOTYPING MARKET BY APPLICATION TYPE (USD MILLION) 2020-2029
TABLE 59 JAPAN PLANT PHENOTYPING MARKET BY END-USER (USD MILLION) 2020-2029
TABLE 60 SOUTH KOREA PLANT PHENOTYPING MARKET BY PRODUCT (USD MILLION) 2020-2029
TABLE 61 SOUTH KOREA PLANT PHENOTYPING MARKET BY SERVICE (USD MILLION) 2020-2029
TABLE 62 SOUTH KOREA PLANT PHENOTYPING MARKET BY APPLICATION TYPE (USD MILLION) 2020-2029
TABLE 63 SOUTH KOREA PLANT PHENOTYPING MARKET BY END-USER (USD MILLION) 2020-2029
TABLE 64 AUSTRALIA PLANT PHENOTYPING MARKET BY PRODUCT (USD MILLION) 2020-2029
TABLE 65 AUSTRALIA PLANT PHENOTYPING MARKET BY SERVICE (USD MILLION) 2020-2029
TABLE 66 AUSTRALIA PLANT PHENOTYPING MARKET BY APPLICATION TYPE (USD MILLION) 2020-2029
TABLE 67 AUSTRALIA PLANT PHENOTYPING MARKET BY END-USER (USD MILLION) 2020-2029
TABLE 68 SOUTH-EAST ASIA PLANT PHENOTYPING MARKET BY PRODUCT (USD MILLION) 2020-2029
TABLE 69 SOUTH-EAST ASIA PLANT PHENOTYPING MARKET BY SERVICE (USD MILLION) 2020-2029
TABLE 70 SOUTH-EAST ASIA PLANT PHENOTYPING MARKET BY APPLICATION TYPE (USD MILLION) 2020-2029
TABLE 71 SOUTH-EAST ASIA PLANT PHENOTYPING MARKET BY END-USER (USD MILLION) 2020-2029
TABLE 72 REST OF ASIA PACIFIC PLANT PHENOTYPING MARKET BY PRODUCT (USD MILLION) 2020-2029
TABLE 73 REST OF ASIA PACIFIC PLANT PHENOTYPING MARKET BY SERVICE (USD MILLION) 2020-2029
TABLE 74 REST OF ASIA PACIFIC PLANT PHENOTYPING MARKET BY APPLICATION TYPE (USD MILLION) 2020-2029
TABLE 75 REST OF ASIA PACIFIC PLANT PHENOTYPING MARKET BY END-USER (USD MILLION) 2020-2029
TABLE 76 EUROPE PLANT PHENOTYPING MARKET BY COUNTRY (USD MILLION) 2020-2029
TABLE 77 EUROPE PLANT PHENOTYPING MARKET BY PRODUCT (USD MILLION) 2020-2029
TABLE 78 EUROPE PLANT PHENOTYPING MARKET BY SERVICE (USD MILLION) 2020-2029
TABLE 79 EUROPE PLANT PHENOTYPING MARKET BY APPLICATION TYPE (USD MILLION) 2020-2029
TABLE 80 EUROPE PLANT PHENOTYPING MARKET BY END-USER (USD MILLION) 2020-2029
TABLE 81 GERMANY PLANT PHENOTYPING MARKET BY PRODUCT (USD MILLION) 2020-2029
TABLE 82 GERMANY PLANT PHENOTYPING MARKET BY SERVICE (USD MILLION) 2020-2029
TABLE 83 GERMANY PLANT PHENOTYPING MARKET BY APPLICATION TYPE (USD MILLION) 2020-2029
TABLE 84 GERMANY PLANT PHENOTYPING MARKET BY END-USER (USD MILLION) 2020-2029
TABLE 85 UK PLANT PHENOTYPING MARKET BY PRODUCT (USD MILLION) 2020-2029
TABLE 86 UK PLANT PHENOTYPING MARKET BY SERVICE (USD MILLION) 2020-2029
TABLE 87 UK PLANT PHENOTYPING MARKET BY APPLICATION TYPE (USD MILLION) 2020-2029
TABLE 88 UK PLANT PHENOTYPING MARKET BY END-USER (USD MILLION) 2020-2029
TABLE 89 FRANCE PLANT PHENOTYPING MARKET BY PRODUCT (USD MILLION) 2020-2029
TABLE 90 FRANCE PLANT PHENOTYPING MARKET BY SERVICE (USD MILLION) 2020-2029
TABLE 91 FRANCE PLANT PHENOTYPING MARKET BY APPLICATION TYPE (USD MILLION) 2020-2029
TABLE 92 FRANCE PLANT PHENOTYPING MARKET BY END-USER (USD MILLION) 2020-2029
TABLE 93 ITALY PLANT PHENOTYPING MARKET BY PRODUCT (USD MILLION) 2020-2029
TABLE 94 ITALY PLANT PHENOTYPING MARKET BY SERVICE (USD MILLION) 2020-2029
TABLE 95 ITALY PLANT PHENOTYPING MARKET BY APPLICATION TYPE (USD MILLION) 2020-2029
TABLE 96 ITALY PLANT PHENOTYPING MARKET BY END-USER (USD MILLION) 2020-2029
TABLE 97 SPAIN PLANT PHENOTYPING MARKET BY PRODUCT (USD MILLION) 2020-2029
TABLE 98 SPAIN PLANT PHENOTYPING MARKET BY SERVICE (USD MILLION) 2020-2029
TABLE 99 SPAIN PLANT PHENOTYPING MARKET BY APPLICATION TYPE (USD MILLION) 2020-2029
TABLE 100 SPAIN PLANT PHENOTYPING MARKET BY END-USER (USD MILLION) 2020-2029
TABLE 101 RUSSIA PLANT PHENOTYPING MARKET BY PRODUCT (USD MILLION) 2020-2029
TABLE 102 RUSSIA PLANT PHENOTYPING MARKET BY SERVICE (USD MILLION) 2020-2029
TABLE 103 RUSSIA PLANT PHENOTYPING MARKET BY APPLICATION TYPE (USD MILLION) 2020-2029
TABLE 104 RUSSIA PLANT PHENOTYPING MARKET BY END-USER (USD MILLION) 2020-2029
TABLE 105 REST OF EUROPE PLANT PHENOTYPING MARKET BY PRODUCT (USD MILLION) 2020-2029
TABLE 106 REST OF EUROPE PLANT PHENOTYPING MARKET BY SERVICE (USD MILLION) 2020-2029
TABLE 107 REST OF EUROPE PLANT PHENOTYPING MARKET BY APPLICATION TYPE (USD MILLION) 2020-2029
TABLE 108 REST OF EUROPE PLANT PHENOTYPING MARKET BY END-USER (USD MILLION) 2020-2029
TABLE 109 MIDDLE EAST AND AFRICA PLANT PHENOTYPING MARKET BY COUNTRY (USD MILLION) 2020-2029
TABLE 110 MIDDLE EAST AND AFRICA PLANT PHENOTYPING MARKET BY PRODUCT (USD MILLION) 2020-2029
TABLE 111 MIDDLE EAST AND AFRICA PLANT PHENOTYPING MARKET BY SERVICE (USD MILLION) 2020-2029
TABLE 112 MIDDLE EAST AND AFRICA PLANT PHENOTYPING MARKET BY APPLICATION TYPE (USD MILLION) 2020-2029
TABLE 113 MIDDLE EAST AND AFRICA PLANT PHENOTYPING MARKET BY END-USER (USD MILLION) 2020-2029
TABLE 114 UAE PLANT PHENOTYPING MARKET BY PRODUCT (USD MILLION) 2020-2029
TABLE 115 UAE PLANT PHENOTYPING MARKET BY SERVICE (USD MILLION) 2020-2029
TABLE 116 UAE PLANT PHENOTYPING MARKET BY APPLICATION TYPE (USD MILLION) 2020-2029
TABLE 117 UAE PLANT PHENOTYPING MARKET BY END-USER (USD MILLION) 2020-2029
TABLE 118 SAUDI ARABIA PLANT PHENOTYPING MARKET BY PRODUCT (USD MILLION) 2020-2029
TABLE 119 SAUDI ARABIA PLANT PHENOTYPING MARKET BY SERVICE (USD MILLION) 2020-2029
TABLE 120 SAUDI ARABIA PLANT PHENOTYPING MARKET BY APPLICATION TYPE (USD MILLION) 2020-2029
TABLE 121 SAUDI ARABIA PLANT PHENOTYPING MARKET BY END-USER (USD MILLION) 2020-2029
TABLE 122 SOUTH AFRICA PLANT PHENOTYPING MARKET BY PRODUCT (USD MILLION) 2020-2029
TABLE 123 SOUTH AFRICA PLANT PHENOTYPING MARKET BY SERVICE (USD MILLION) 2020-2029
TABLE 124 SOUTH AFRICA PLANT PHENOTYPING MARKET BY APPLICATION TYPE (USD MILLION) 2020-2029
TABLE 125 SOUTH AFRICA PLANT PHENOTYPING MARKET BY END-USER (USD MILLION) 2020-2029
TABLE 126 REST OF MIDDLE EAST AND AFRICA PLANT PHENOTYPING MARKET BY PRODUCT (USD MILLION) 2020-2029
TABLE 127 REST OF MIDDLE EAST AND AFRICA PLANT PHENOTYPING MARKET BY SERVICE (USD MILLION) 2020-2029
TABLE 128 REST OF MIDDLE EAST AND AFRICA PLANT PHENOTYPING MARKET BY APPLICATION TYPE (USD MILLION) 2020-2029
TABLE 129 REST OF MIDDLE EAST AND AFRICA PLANT PHENOTYPING MARKET BY END-USER (USD MILLION) 2020-2029
LIST OF FIGURES
FIGURE 1 MARKET DYNAMICS
FIGURE 2 MARKET SEGMENTATION
FIGURE 3 REPORT TIMELINES: YEARS CONSIDERED
FIGURE 4 DATA TRIANGULATION
FIGURE 5 BOTTOM-UP APPROACH
FIGURE 6 TOP-DOWN APPROACH
FIGURE 7 RESEARCH FLOW
FIGURE 8 GLOBAL PLANT PHENOTYPING MARKET BY PRODUCT, USD MILLION, 2020-2029
FIGURE 9 GLOBAL PLANT PHENOTYPING MARKET BY SERVICE, USD MILLION, 2020-2029
FIGURE 10 GLOBAL PLANT PHENOTYPING MARKET BY APPLICATION TYPE, USD MILLION, 2020-2029
FIGURE 11 GLOBAL PLANT PHENOTYPING MARKET BY END-USER, USD MILLION, 2020-2029
FIGURE 12 GLOBAL PLANT PHENOTYPING MARKET BY REGION, USD MILLION, 2020-2029
FIGURE 13 PORTER’S FIVE FORCES MODEL
FIGURE 14 GLOBAL PLANT PHENOTYPING MARKET BY PRODUCT, 2021
FIGURE 15 GLOBAL PLANT PHENOTYPING MARKET BY SERVICE, 2021
FIGURE 16 GLOBAL PLANT PHENOTYPING MARKET BY APPLICATION TYPE, 2021
FIGURE 17 GLOBAL PLANT PHENOTYPING MARKET BY END-USER, 2021
FIGURE 18 PLANT PHENOTYPING MARKET BY REGION, 2021
FIGURE 19 MARKET SHARE ANALYSIS
FIGURE 20 AGRI-EPI CENTRE LTD: COMPANY SNAPSHOT
FIGURE 21 BIOVOX: COMPANY SNAPSHOT
FIGURE 22 CROPDESIGN: COMPANY SNAPSHOT
FIGURE 23 DELTA-T DEVICES: COMPANY SNAPSHOT
FIGURE 24 HEINZ WALZ: COMPANY SNAPSHOT
FIGURE 25 HIPHEN: COMPANY SNAPSHOT
FIGURE 26 KEYGENE: COMPANY SNAPSHOT
FIGURE 27 LEMNATEC: COMPANY SNAPSHOT
FIGURE 28 PHENO-INSPECT GMBH: COMPANY SNAPSHOT
FIGURE 29 PHENOMIX: COMPANY SNAPSHOT
FIGURE 30 PHENOSPEX: COMPANY SNAPSHOT
FIGURE 31 PHOTON SYSTEM REPUBLIC: COMPANY SNAPSHOT
FIGURE 32 PLANT-DITECH LTD: COMPANY SNAPSHOT
FIGURE 33 QUIBIT PHENOMICS: COMPANY SNAPSHOT
FIGURE 34 ROTHAMSTAD RESEARCH LIMITED: COMPANY SNAPSHOT
DOWNLOAD FREE SAMPLE REPORT
License Type
SPEAK WITH OUR ANALYST
Want to know more about the report or any specific requirement?
WANT TO CUSTOMIZE THE REPORT?
Our Clients Speak
We asked them to research ‘ Equipment market’ all over the world, and their whole arrangement was helpful to us. thehealthanalytics.com insightful analysis and reports contributed to our current analysis and in creating a future strategy. Besides, the te
Yosuke Mitsui
Senior Associate Construction Equipment Sales & Marketing
We asked them to research ‘Equipment market’ all over the world, and their whole arrangement was helpful to us. thehealthanalytics.com insightful analysis and reports contributed to our current analysis and in creating a future strategy. Besides, the te


