

Base Year Value ()
x.x %
x.x %
CAGR ()
x.x %
x.x %
Forecast Year Value ()
x.x %
x.x %
Historical Data Period
Largest Region
Forecast Period
Biophotonics Market by End User (Medical Diagnostics, Medical Therapeutic, Tests & Components, Nonmedical Application), by Application (See-through Imaging, Inside Imaging, Spectro Molecular, Surface Imaging, Microscopy, Light Therapy, Analytical Sensing, Biosensors) and Region, Global Trends and Forecast From 2022 To 2029
Instant access to hundreds of data points and trends
- Market estimates from 2014-2029
- Competitive analysis, industry segmentation, financial benchmarks
- Incorporates SWOT, Porter's Five Forces and risk management frameworks
- PDF report or online database with Word, Excel and PowerPoint export options
- 100% money back guarantee
Biophotonics Market Overview
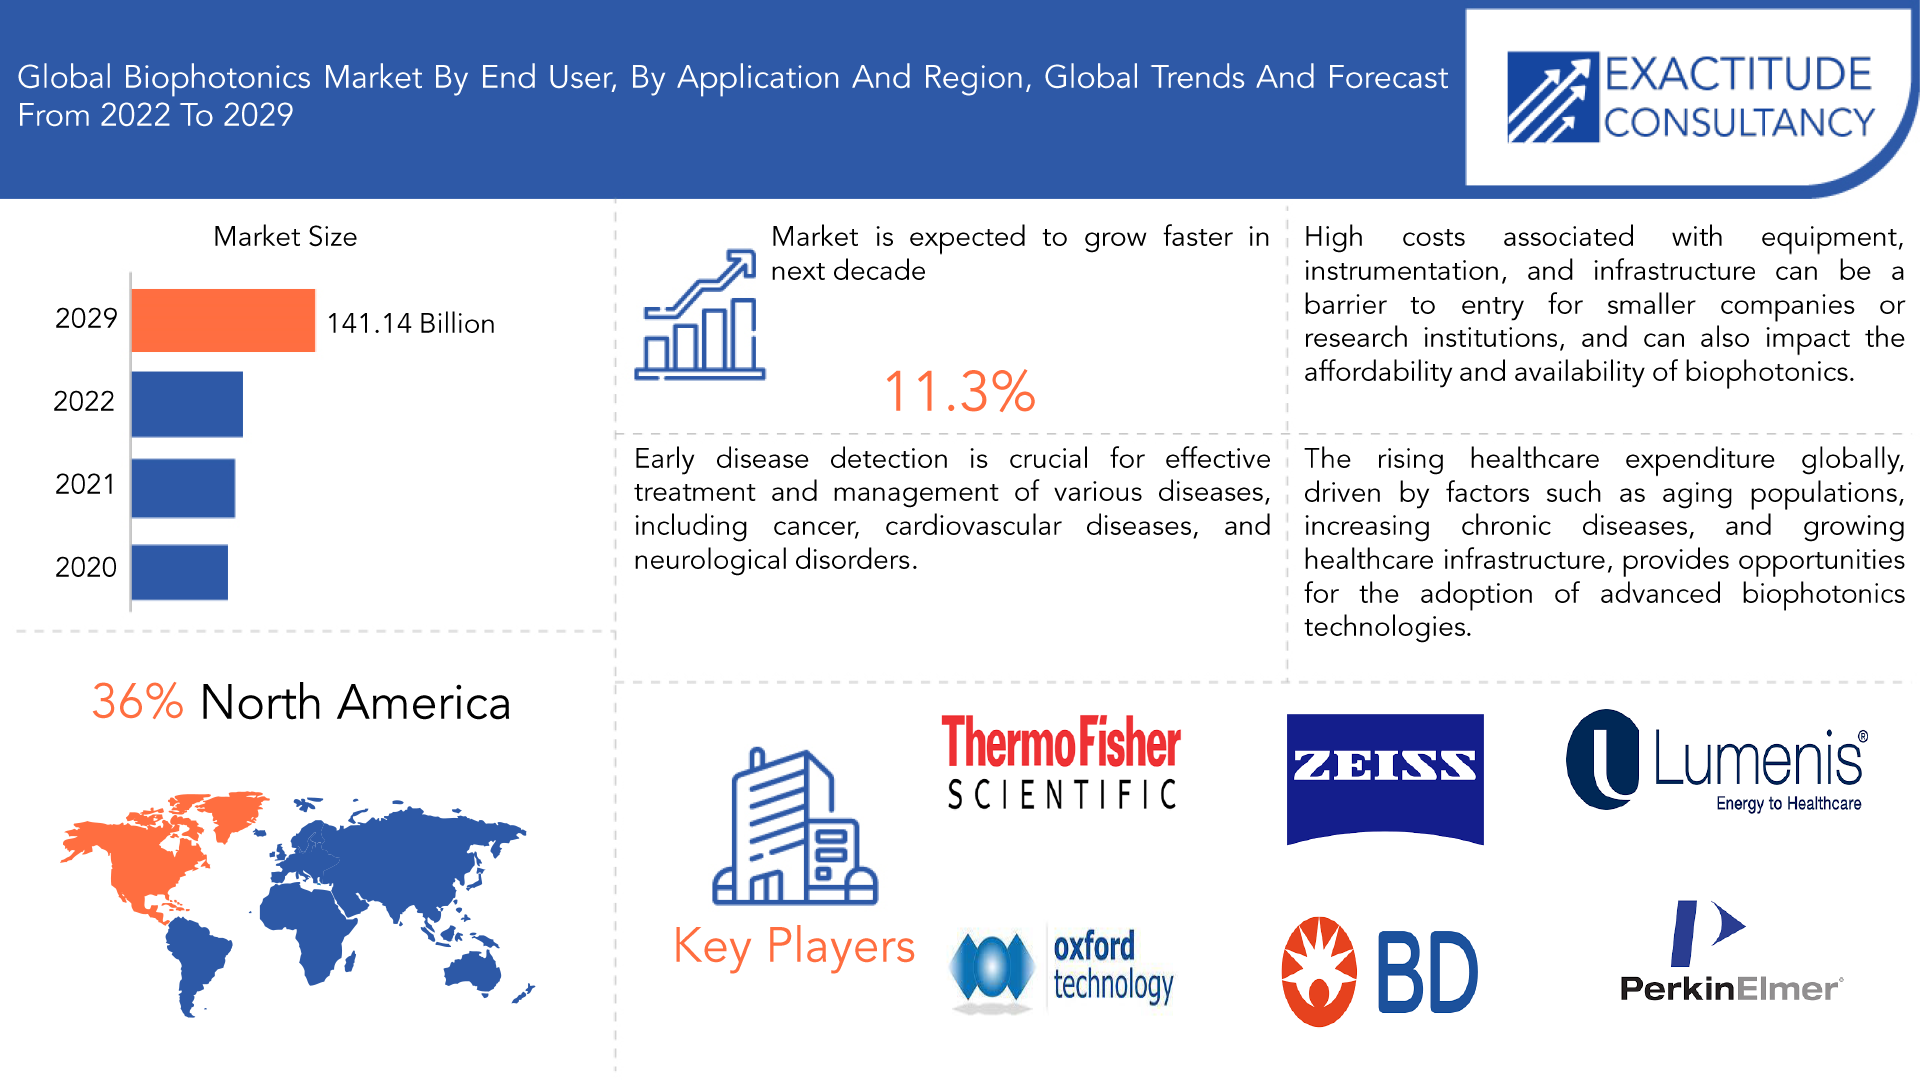
The global biophotonics market is expected to grow at 11.30 % CAGR from 2020 to 2029. It is expected to reach above USD 141.14 Billion by 2029 from USD 53.85 Billion in 2020.
Biophotonics is a multidisciplinary field that involves the use of light-based technologies to study, diagnose, and treat biological systems. It encompasses the interaction of light with biological tissues, cells, molecules, and other biomaterials to gain insights into their structure, function, and behavior. Biophotonics combines principles of optics, biology, physics, and engineering to develop and apply innovative techniques and tools for a wide range of applications in medicine, life sciences, and environmental sciences. Biophotonics technologies utilize various optical techniques such as imaging, spectroscopy, microscopy, sensing, and therapy to enable non-invasive, label-free, and minimally invasive approaches for studying biological systems at different scales, from macroscopic to microscopic and nanoscopic levels.
| ATTRIBUTE | DETAILS |
| Study period | 2020-2029 |
| Base year | 2021 |
| Estimated year | 2022 |
| Forecasted year | 2022-2029 |
| Historical period | 2018-2020 |
| Unit | Value (USD Billion) |
| Segmentation | By End User, Application and region. |
| By End User |
|
| By Application |
|
| By Region |
|
The growing need for early disease detection and personalized medicine is a significant driver for the biophotonics market. Early detection of diseases, such as cancer, cardiovascular diseases, and neurological disorders, can lead to more effective treatment outcomes and improved patient outcomes. Biophotonics technologies offer non-invasive, sensitive, and real-time methods for early disease detection, which can enable timely interventions and personalized treatment plans tailored to an individual's unique characteristics.
High costs associated with biophotonics technologies, including research and development, manufacturing, instrumentation, infrastructure, regulatory compliance, training, and market competition, can be a significant restraint on their adoption. These costs pose challenges for smaller companies or research institutions, limit accessibility in certain settings, and impact affordability and availability of biophotonics-based products and services. Addressing the cost challenges through increased funding, optimized manufacturing processes, regulatory efficiencies, and skill development programs may help in mitigating this restraint and promoting wider adoption of biophotonics technologies.
The increasing healthcare expenditure globally presents an opportunity for the adoption of biophotonics technologies. As healthcare expenditure continues to rise due to factors such as aging populations, increasing chronic diseases, and growing healthcare infrastructure, there is a growing need for cost-effective, efficient, and non-invasive healthcare solutions. Biophotonics technologies, with their capabilities in imaging, sensing, diagnostics, therapy, and monitoring, can offer innovative and advanced solutions for various healthcare applications. Biophotonics can enable early disease detection, personalized medicine, and precision therapies, which can contribute to improved patient outcomes and cost savings in healthcare. Therefore, the increasing healthcare expenditure provides opportunities for the wider adoption of biophotonics technologies in healthcare settings globally.
The COVID-19 pandemic had a positive impact on the biophotonics market, including increased demand for diagnostics such as fluorescence-based diagnostics, spectroscopy, and imaging for COVID-19 testing. The adoption of tele healthcare and remote monitoring had accelerated, creating opportunities for biophotonics technologies in virtual consultations and home-based monitoring. Increased research collaborations and funding had facilitated the development of new biophotonics-based solutions for COVID-19 detection and therapy. The pandemic had also highlighted the importance of healthcare preparedness, showcasing the potential of biophotonics in addressing healthcare challenges. Furthermore, advancements in biophotonics technologies developed for COVID-19 have the potential for broader applications beyond the pandemic, such as cancer detection, neuroimaging, ophthalmology, and cardiovascular disease management. These factors had contributed to the positive impact of COVID-19 on the biophotonics market, driving its growth and expansion in various healthcare fields.
[caption id="attachment_20615" align="aligncenter" width="1000"]
Frequently Asked Questions
• What is the worth of the global biophotonics market?
The global biophotonics market is expected to grow at 11.30 % CAGR from 2020 to 2029. It is expected to reach above USD 141.14 Billion by 2029 from USD 53.85 Billion in 2020.
• What is the size of the North America biophotonics market?
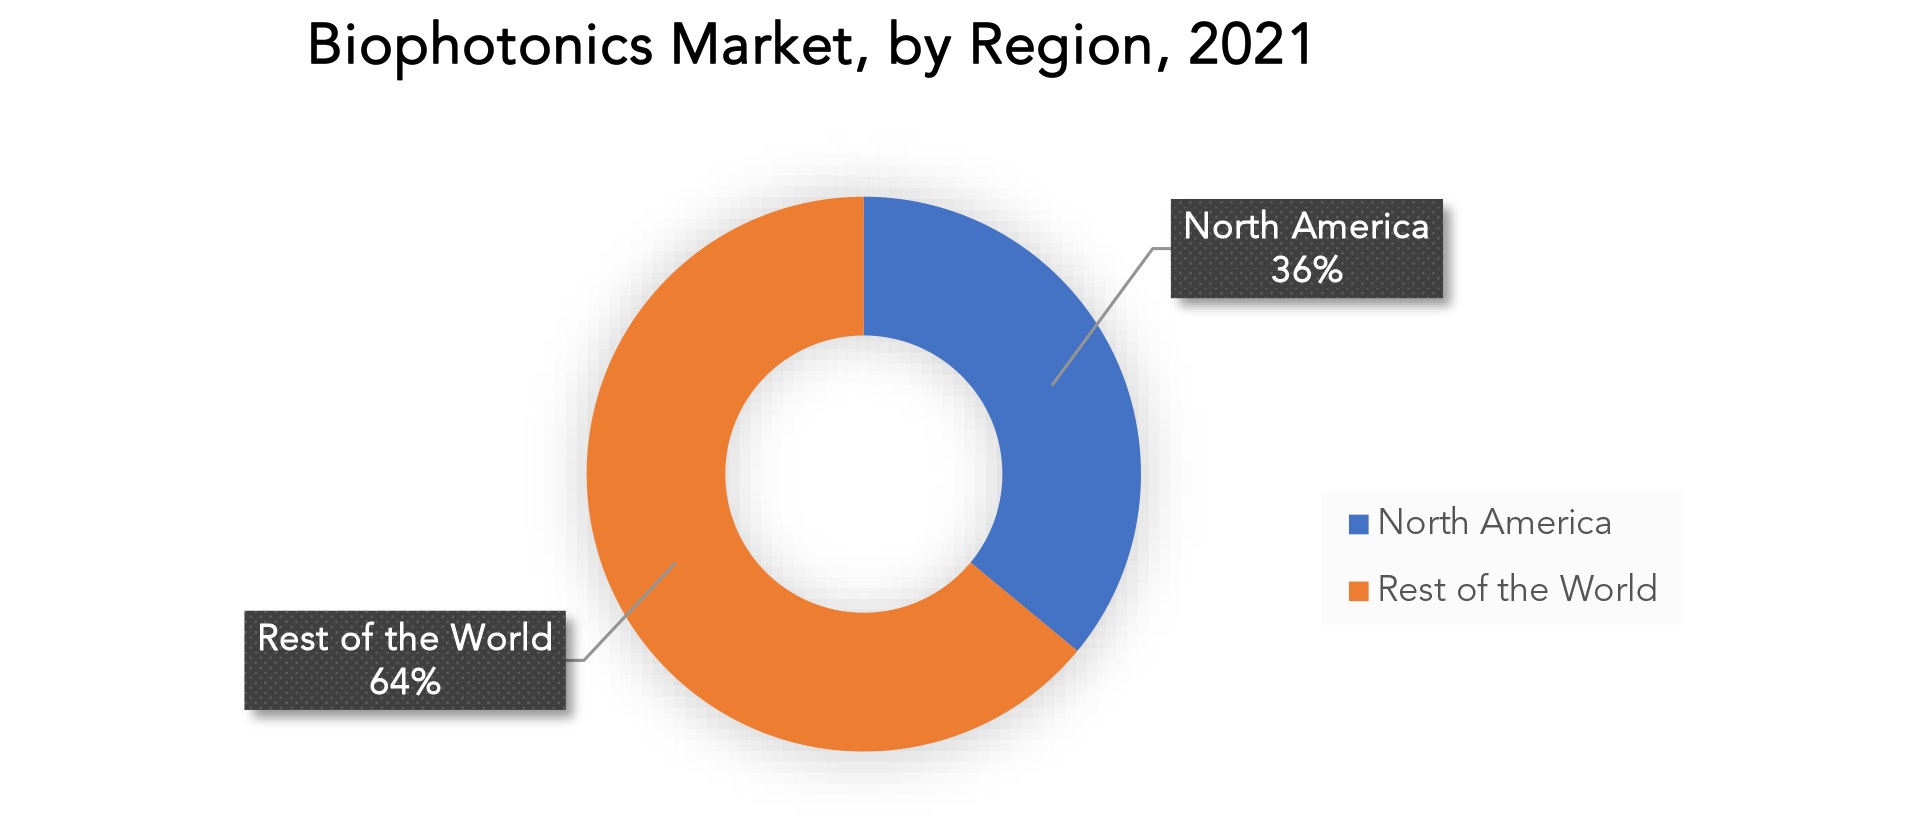
North America held more than 36% of the biophotonics market revenue share in 2020 and will witness tremendous expansion during the forecast period.
• What are some of the market's driving forces?
Early disease detection is crucial for effective treatment and management of various diseases, including cancer, cardiovascular diseases, and neurological disorders.
• Which are the top companies to hold the market share in the biophotonics market?
The biophotonics market key players include Thermo Fisher Scientific Inc., Oxford Technologies, Carl Zeiss AG, Glenbrook Technologies Inc., Becton Dickinson and Company, Hamamatsu Photonics K.K., Lumenis Ltd., Olympus Corporation, PerkinElmer Inc., Zenalux Biomedical Inc.
• What is the leading application of the biophotonics market?
The health care sector is major sector where the application of biophotonics has seen more.
• Which is the largest regional market for biophotonics market?
The markets largest share is in the North America region.
Biophotonics Market Segment Analysis
Medical diagnostics is widely considered as one of the major segments in the biophotonics market. Biophotonics technologies are used in various diagnostic applications, including fluorescence-based diagnostics, Raman spectroscopy, optical coherence tomography (OCT), and other imaging techniques for disease detection, monitoring, and characterization. Biophotonics plays a significant role in areas such as cancer diagnosis, infectious disease testing, cardiovascular disease management, and ophthalmology, among others. Fluorescence-based diagnostics, in particular, are widely used in medical diagnostics and are based on the principles of biophotonics. Fluorescence microscopy and fluorescence spectroscopy are used for the detection of various diseases by utilizing the fluorescence properties of biological molecules, such as proteins, enzymes, and nucleic acids, to identify specific targets or markers associated with diseases. See-through imaging is indeed considered as one of the prominent applications in the field of biophotonics. See-through imaging techniques, such as optical coherence tomography (OCT), near-infrared (NIR) imaging, and other imaging modalities, allow for non-invasive visualization of biological tissues and structures with high resolution and depth penetration. These imaging techniques are widely used in medical and biological research for imaging and diagnosis of various conditions in fields such as ophthalmology, dermatology, cardiology, neurology, and other areas. [caption id="attachment_20686" align="aligncenter" width="1920"]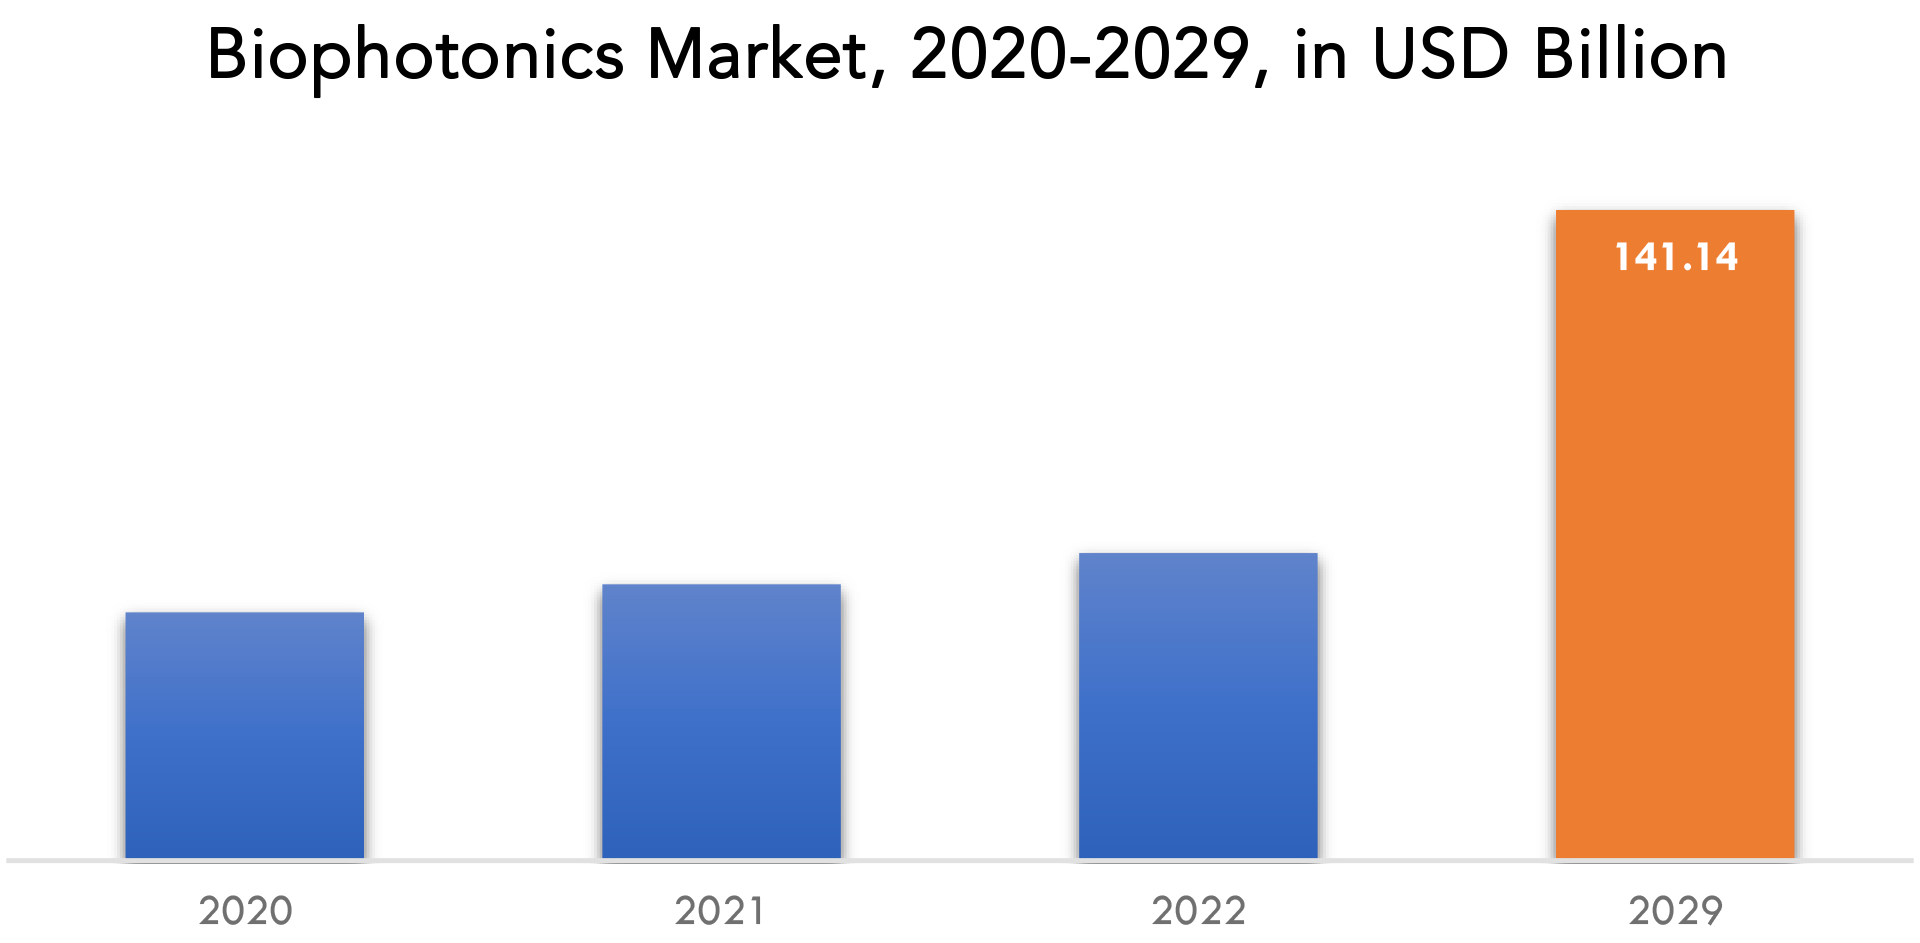
Biophotonics Market Players
The biophotonics market key players include Thermo Fisher Scientific Inc., Oxford Technologies, Carl Zeiss AG, Glenbrook Technologies Inc., Becton Dickinson and Company, Hamamatsu Photonics K.K., Lumenis Ltd., Olympus Corporation, PerkinElmer Inc., Zenalux Biomedical Inc. For corporate expansion, these key leaders are implementing strategic formulations such as new product development and commercialization, commercial expansion, and distribution agreements. Moreover, these participants are substantially spending on product development, which is fueling revenue generation.Industry Developments:
March 2021 ZEISS the leading global optics and optoelectronics technology company, had completed construction of its new R&D, production, sales and customer service site in the San Francisco Bay Area. November 2021 Andor Technology, an Oxford Instruments company and world leader in scientific imaging solutions, announced the addition of BC43, a revolutionary benchtop confocal system, to its award-winning microscopy portfolio.Who Should Buy? Or Key stakeholders
- Investors
- Raw Materials Manufacturer
- Healthcare Companies
- Research Organizations
- Regulatory Authorities
- Institutional & retail players
- Others
Biophotonics Market Regional Analysis
The Biophotonics Market by region includes North America, Asia-Pacific (APAC), Europe, South America, and Middle East & Africa (MEA).- North America: includes the US, Canada, Mexico
- Asia Pacific: includes China, Japan, South Korea, India, Australia, ASEAN, and Rest of APAC
- Europe: includes the UK, Germany, France, Italy, Spain, Russia, and the Rest of Europe
- South America: includes Brazil, Argentina, and Rest of South America
- Middle East & Africa: includes Turkey, UAE, Saudi Arabia, South Africa, and the Rest of MEA
Key Market Segments: Biophotonics Market
Biophotonics Market By End User, 2020-2029, (USD Billion).- Medical Diagnostics
- Medical Therapeutic
- Tests & Components
- Nonmedical Application
- See-Through Imaging
- Inside Imaging
- Spectro Molecular
- Surface Imaging
- Microscopy
- Light Therapy
- Analytical Sensing
- Biosensors
- North America
- Asia Pacific
- Europe
- South America
- Middle East And Africa
Exactitude Consultancy Services Key Objectives:
- Increasing sales and market share
- Developing new technology
- Improving profitability
- Entering new markets
- Enhancing brand reputation
Key Question Answered
- What is the expected growth rate of the biophotonics market over the next 7 years?
- Who are the major players in the biophotonics market and what is their market share?
- What are the end-user industries driving demand for market and what is their outlook?
- What are the opportunities for growth in emerging markets such as Asia-pacific, middle east, and Africa?
- How is the economic environment affecting the biophotonics market, including factors such as interest rates, inflation, and exchange rates?
- What is the expected impact of government policies and regulations on the biophotonics market?
- What is the current and forecasted size and growth rate of the global biophotonics market?
- What are the key drivers of growth in the biophotonics market?
- What are the distribution channels and supply chain dynamics in the biophotonics market?
- What are the technological advancements and innovations in the biophotonics market and their impact on product development and growth?
- What are the regulatory considerations and their impact on the market?
- What are the challenges faced by players in the biophotonics market and how are they addressing these challenges?
- What are the opportunities for growth and expansion in the biophotonics market?
- What are the product offerings and specifications of leading players in the market?
- What is the pricing trend of biophotonics in the market and what is the impact of raw material prices on the price trend?
- INTRODUCTION
- MARKET DEFINITION
- MARKET SEGMENTATION
- RESEARCH TIMELINES
- ASSUMPTIONS AND LIMITATIONS
- RESEARCH METHODOLOGY
- DATA MINING
- SECONDARY RESEARCH
- PRIMARY RESEARCH
- SUBJECT-MATTER EXPERTS’ ADVICE
- QUALITY CHECKS
- FINAL REVIEW
- DATA TRIANGULATION
- BOTTOM-UP APPROACH
- TOP-DOWN APPROACH
- RESEARCH FLOW
- DATA SOURCES
- DATA MINING
- EXECUTIVE SUMMARY
- MARKET OVERVIEW
- GLOBAL BIOPHOTONICS MARKET OUTLOOK
- MARKET DRIVERS
- MARKET RESTRAINTS
- MARKET OPPORTUNITIES
- IMPACT OF COVID-19 ON BIOPHOTONICS MARKET
- PORTER’S FIVE FORCES MODEL
- THREAT FROM NEW ENTRANTS
- THREAT FROM SUBSTITUTES
- BARGAINING POWER OF SUPPLIERS
- BARGAINING POWER OF CUSTOMERS
- DEGREE OF COMPETITION
- INDUSTRY VALUE CHAIN ANALYSIS
- GLOBAL BIOPHOTONICS MARKET OUTLOOK
- GLOBAL BIOPHOTONICS MARKET BY END USER, 2020-2029, (USD BILLION).
- MEDICAL DIAGNOSTICS
- MEDICAL THERAPEUTIC
- TESTS & COMPONENTS
- NONMEDICAL APPLICATION
- GLOBAL BIOPHOTONICS MARKET BY APPLICATION, 2020-2029, (USD BILLION).
- SEE-THROUGH IMAGING
- INSIDE IMAGING
- SPECTRO MOLECULAR
- SURFACE IMAGING
- MICROSCOPY
- LIGHT THERAPY
- ANALYTICAL SENSING
- BIOSENSORS
- GLOBAL BIOPHOTONICS MARKET BY REGION, 2020-2029, (USD BILLION).
- NORTH AMERICA
- US
- CANADA
- MEXICO
- SOUTH AMERICA
- BRAZIL
- ARGENTINA
- COLOMBIA
- REST OF SOUTH AMERICA
- EUROPE
- GERMANY
- UK
- FRANCE
- ITALY
- SPAIN
- RUSSIA
- REST OF EUROPE
- ASIA PACIFIC
- INDIA
- CHINA
- JAPAN
- SOUTH KOREA
- AUSTRALIA
- SOUTH-EAST ASIA
- REST OF ASIA PACIFIC
- MIDDLE EAST AND AFRICA
- UAE
- SAUDI ARABIA
- SOUTH AFRICA
- REST OF MIDDLE EAST AND AFRICA
- NORTH AMERICA
- COMPANY PROFILES*(BUSINESS OVERVIEW, COMPANY SNAPSHOT, PRODUCTS OFFERED, RECENT DEVELOPMENTS)
- THERMO FISHER SCIENTIFIC INC.
- OXFORD TECHNOLOGIES
- CARL ZEISS AG
- GLENBROOK TECHNOLOGIES INC.
- BECTON, DICKINSON AND COMPANY
- HAMAMATSU PHOTONICS K.K.
- LUMENIS LTD.
- OLYMPUS CORPORATION
- PERKINELMER INC.
- ZENALUX BIOMEDICAL INC.
*THE COMPANY LIST IS INDICATIVE
LIST OF TABLES
TABLE 1 GLOBAL BIOPHOTONICS MARKET BY END USER (USD BILLION), 2020-2029
TABLE 2 GLOBAL BIOPHOTONICS MARKET BY APPLICATION (USD BILLION), 2020-2029
TABLE 3 GLOBAL BIOPHOTONICS MARKET BY REGION (USD BILLIONS), 2020-2029
TABLE 4 NORTH AMERICA BIOPHOTONICS MARKET BY END USER (USD BILLIONS), 2020-2029
TABLE 5 NORTH AMERICA BIOPHOTONICS MARKET BY APPLICATION (USD BILLION), 2020-2029
TABLE 6 NORTH AMERICA BIOPHOTONICS MARKET BY COUNTRY (USD BILLION), 2020-2029
TABLE 7 US BIOPHOTONICS MARKET BY END USER (USD BILLIONS), 2020-2029
TABLE 8 US BIOPHOTONICS MARKET BY APPLICATION (USD BILLION), 2020-2029
TABLE 9 CANADA BIOPHOTONICS MARKET BY END USER (BILLIONS), 2020-2029
TABLE 10 CANADA BIOPHOTONICS MARKET BY APPLICATION (USD BILLION), 2020-2029
TABLE 11 MEXICO BIOPHOTONICS MARKET BY END USER (USD BILLIONS), 2020-2029
TABLE 12 MEXICO BIOPHOTONICS MARKET BY APPLICATION (USD BILLION), 2020-2029
TABLE 13 SOUTH AMERICA BIOPHOTONICS MARKET BY END USER (USD BILLIONS), 2020-2029
TABLE 14 SOUTH AMERICA BIOPHOTONICS MARKET BY APPLICATION (USD BILLION), 2020-2029
TABLE 15 SOUTH AMERICA BIOPHOTONICS MARKET BY COUNTRY (USD BILLION), 2020-2029
TABLE 16 BRAZIL BIOPHOTONICS MARKET BY END USER (USD BILLIONS), 2020-2029
TABLE 17 BRAZIL BIOPHOTONICS MARKET BY APPLICATION (USD BILLION), 2020-2029
TABLE 18 ARGENTINA BIOPHOTONICS MARKET BY END USER (USD BILLIONS), 2020-2029
TABLE 19 ARGENTINA BIOPHOTONICS MARKET BY APPLICATION (USD BILLION), 2020-2029
TABLE 20 REST OF SOUTH AMERICA BIOPHOTONICS MARKET BY END USER (USD BILLIONS), 2020-2029
TABLE 21 REST OF SOUTH AMERICA BIOPHOTONICS MARKET BY APPLICATION (USD BILLION), 2020-2029
TABLE 22 ASIA -PACIFIC BIOPHOTONICS MARKET BY END USER (USD BILLIONS), 2020-2029
TABLE 23 ASIA -PACIFIC BIOPHOTONICS MARKET BY APPLICATION (USD BILLION), 2020-2029
TABLE 24 ASIA -PACIFIC BIOPHOTONICS MARKET BY COUNTRY (USD BILLION), 2020-2029
TABLE 25 INDIA BIOPHOTONICS MARKET BY END USER (USD BILLIONS), 2020-2029
TABLE 26 INDIA BIOPHOTONICS MARKET BY APPLICATION (USD BILLION), 2020-2029
TABLE 27 CHINA BIOPHOTONICS MARKET BY END USER (USD BILLIONS), 2020-2029
TABLE 28 CHINA BIOPHOTONICS MARKET BY APPLICATION (USD BILLION), 2020-2029
TABLE 29 JAPAN BIOPHOTONICS MARKET BY END USER (USD BILLIONS), 2020-2029
TABLE 30 JAPAN BIOPHOTONICS MARKET BY APPLICATION (USD BILLION), 2020-2029
TABLE 31 SOUTH KOREA BIOPHOTONICS MARKET BY END USER (USD BILLIONS), 2020-2029
TABLE 32 SOUTH KOREA BIOPHOTONICS MARKET BY APPLICATION (USD BILLION), 2020-2029
TABLE 33 AUSTRALIA BIOPHOTONICS MARKET BY END USER (USD BILLIONS), 2020-2029
TABLE 34 AUSTRALIA HYBRID FUNCTIONBY APPLICATION (USD BILLION), 2020-2029
TABLE 35 AUSTRALIA BIOPHOTONICS MARKET BY FUNCTION (USD BILLIONS), 2020-2029
TABLE 36 AUSTRALIA BIOPHOTONICS MARKET BY ORGANIZATION SIZE (USD BILLION), 2020-2029
TABLE 37 REST OF ASIA PACIFIC BIOPHOTONICS MARKET BY END USER (USD BILLIONS), 2020-2029
TABLE 38 REST OF ASIA PACIFIC HYBRID FUNCTIONBY APPLICATION (USD BILLION), 2020-2029
TABLE 39 EUROPE BIOPHOTONICS MARKET BY END USER (USD BILLIONS), 2020-2029
TABLE 40 EUROPE BIOPHOTONICS MARKET BY APPLICATION (USD BILLION), 2020-2029
TABLE 41 EUROPE BIOPHOTONICS MARKET BY COUNTRY (USD BILLION), 2020-2029
TABLE 42 GERMANY BIOPHOTONICS MARKET BY END USER (USD BILLIONS), 2020-2029
TABLE 43 GERMANY BIOPHOTONICS MARKET BY APPLICATION (USD BILLION), 2020-2029
TABLE 44 UK BIOPHOTONICS MARKET BY END USER (USD BILLIONS), 2020-2029
TABLE 45 UK BIOPHOTONICS MARKET BY APPLICATION (USD BILLION), 2020-2029
TABLE 46 FRANCE BIOPHOTONICS MARKET BY END USER (USD BILLIONS), 2020-2029
TABLE 47 FRANCE BIOPHOTONICS MARKET BY APPLICATION (USD BILLION), 2020-2029
TABLE 48 ITALY BIOPHOTONICS MARKET BY END USER (USD BILLIONS), 2020-2029
TABLE 49 ITALY BIOPHOTONICS MARKET BY APPLICATION (USD BILLION), 2020-2029
TABLE 50 SPAIN BIOPHOTONICS MARKET BY END USER (USD BILLIONS), 2020-2029
TABLE 51 SPAIN BIOPHOTONICS MARKET BY APPLICATION (USD BILLION), 2020-2029
TABLE 52 REST OF EUROPE BIOPHOTONICS MARKET BY END USER (USD BILLIONS), 2020-2029
TABLE 53 REST OF EUROPE BIOPHOTONICS MARKET BY APPLICATION (USD BILLION), 2020-2029
TABLE 54 MIDDLE EAST AND AFRICA BIOPHOTONICS MARKET BY END USER (USD BILLIONS), 2020-2029
TABLE 55 MIDDLE EAST AND AFRICA BIOPHOTONICS MARKET BY APPLICATION (USD BILLION), 2020-2029
TABLE 56 MIDDLE EAST ABD AFRICA BIOPHOTONICS MARKET BY COUNTRY (USD BILLION), 2020-2029
TABLE 57 UAE BIOPHOTONICS MARKET BY END USER (USD BILLIONS), 2020-2029
TABLE 58 UAE BIOPHOTONICS MARKET BY APPLICATION (USD BILLION), 2020-2029
TABLE 59 SOUTH AFRICA BIOPHOTONICS MARKET BY END USER (USD BILLIONS), 2020-2029
TABLE 60 SOUTH AFRICA BIOPHOTONICS MARKET BY APPLICATION (USD BILLION), 2020-2029
TABLE 61 REST OF MIDDLE EAST AND AFRICA BIOPHOTONICS MARKET BY END USER (USD BILLIONS), 2020-2029
TABLE 62 REST OF MIDDLE EAST AND AFRICA BIOPHOTONICS MARKET BY APPLICATION (USD BILLION), 2020-2029
LIST OF FIGURES
FIGURE 1 MARKET DYNAMICS
FIGURE 2 MARKET SEGMENTATION
FIGURE 3 REPORT TIMELINES: YEARS CONSIDERED
FIGURE 4 DATA TRIANGULATION
FIGURE 5 BOTTOM-UP APPROACH
FIGURE 6 TOP-DOWN APPROACH
FIGURE 7 RESEARCH FLOW
FIGURE 8 GLOBAL BIOPHOTONICS MARKET BY END USER, USD BILLION, 2020-2029
FIGURE 9 GLOBAL BIOPHOTONICS MARKET BY APPLICATION, USD BILLION, 2020-2029
FIGURE 10 GLOBAL BIOPHOTONICS MARKET BY REGION, USD BILLION, 2020-2029
FIGURE 11 PORTER’S FIVE FORCES MODEL
FIGURE 12 GLOBAL BIOPHOTONICS MARKET BY END USER, USD BILLION, 2021
FIGURE 13 GLOBAL BIOPHOTONICS MARKET BY APPLICATION, USD BILLION, 2021
FIGURE 14 GLOBAL BIOPHOTONICS MARKET BY REGION, USD BILLION, 2021
FIGURE 15 MARKET SHARE ANALYSIS
FIGURE 16 THERMO FISHER SCIENTIFIC INC.: COMPANY SNAPSHOT
FIGURE 17 OXFORD TECHNOLOGIES: COMPANY SNAPSHOT
FIGURE 18 CARL ZEISS AG: COMPANY SNAPSHOT
FIGURE 19 GLENBROOK TECHNOLOGIES INC.: COMPANY SNAPSHOT
FIGURE 20 BECTON DICKINSON AND COMPANY: COMPANY SNAPSHOT
FIGURE 21 HAMAMATSU PHOTONICS K.K.: COMPANY SNAPSHOT
FIGURE 22 LUMENIS LTD.: COMPANY SNAPSHOT
FIGURE 23 OLYMPUS CORPORATION: COMPANY SNAPSHOT
FIGURE 24 PERKINELMER INC.: COMPANY SNAPSHOT
FIGURE 25 ZENALUX BIOMEDICAL INC.: COMPANY SNAPSHOT
DOWNLOAD FREE SAMPLE REPORT
License Type
SPEAK WITH OUR ANALYST
Want to know more about the report or any specific requirement?
WANT TO CUSTOMIZE THE REPORT?
Our Clients Speak
We asked them to research ‘ Equipment market’ all over the world, and their whole arrangement was helpful to us. thehealthanalytics.com insightful analysis and reports contributed to our current analysis and in creating a future strategy. Besides, the te
Yosuke Mitsui
Senior Associate Construction Equipment Sales & Marketing
We asked them to research ‘Equipment market’ all over the world, and their whole arrangement was helpful to us. thehealthanalytics.com insightful analysis and reports contributed to our current analysis and in creating a future strategy. Besides, the te


