

Base Year Value ()
x.x %
x.x %
CAGR ()
x.x %
x.x %
Forecast Year Value ()
x.x %
x.x %
Historical Data Period
Largest Region
Forecast Period
Autonomous Surface Vehicles (ASV) Market by Type (Mechanical Propulsion Equipment, Hybrid Propulsion Equipment, Electric Propulsion Equipment, Solar Powered Propulsion Equipment), by Application (Defense, Scientific Research, Commercial, Miscellaneous) and by Region Global Trends and Forecast from 2022 to 2029
Instant access to hundreds of data points and trends
- Market estimates from 2014-2029
- Competitive analysis, industry segmentation, financial benchmarks
- Incorporates SWOT, Porter's Five Forces and risk management frameworks
- PDF report or online database with Word, Excel and PowerPoint export options
- 100% money back guarantee
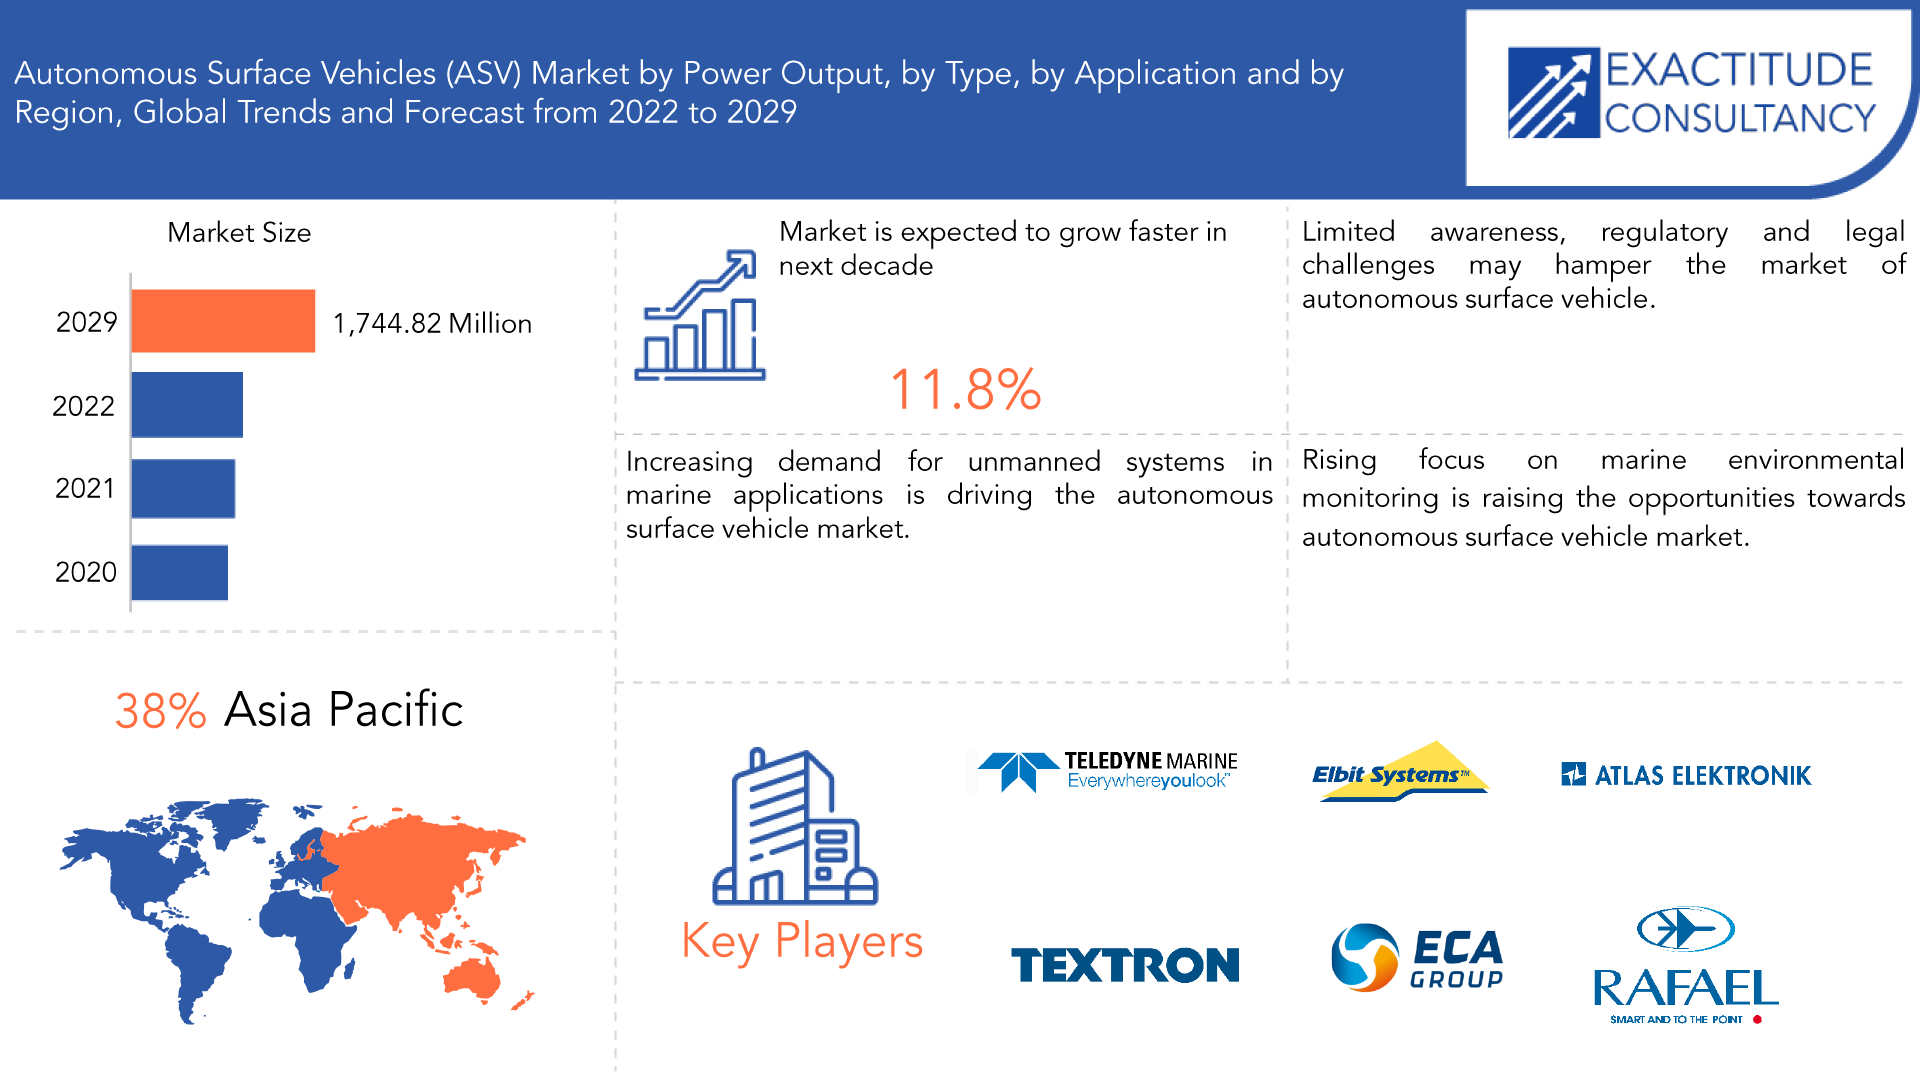
Autonomous Surface Vehicles (ASV) Market Overview
The global autonomous surface vehicles market is expected to grow at an 11.8% CAGR from 2022 to 2029, from USD 714.85 million in 2021.
The term "autonomous surface vehicle" (ASV) refers to a marine craft that can navigate without any help from a human. ASVs are typically employed in military, academic, or industrial settings. ASVs are available in a range of forms and sizes and can be remotely controlled or operated autonomously. The rising demand for autonomous maritime systems across various application segments is responsible for this market's expansion.
| ATTRIBUTE | DETAILS |
| Study period | 2020-2029 |
| Base year | 2021 |
| Estimated year | 2022 |
| Forecasted year | 2022-2029 |
| Historical period | 2018-2020 |
| Unit | Value (USD Million) (Thousand Units) |
| Segmentation | By Type, By Application, By Region. |
| By Type |
|
| By Application |
|
| By Region |
|
Waves, wind, and even all or part of solar energy are used to propel the ASVS. For months at a time, these ASVS can deploy on missions without having to return to base. Growing commercial, scientific, and military concerns are driving up demand for autonomous surface vehicles (ASVS). The market is boosted by the widespread use of ASVS in military applications for a range of missions and tasks, such as surveillance and reconnaissance, mine countermeasures, defence system testing, and training.
An increase in global hydrographic, oceanographic, and environmental surveys is driving the market for autonomous marine vehicles. Underwater features are described and mapped as part of a hydrographic survey. The primary goal of these surveys is to create the navigational charts required for the safe passage of ships.
Government agencies and for-profit businesses have invested a lot in the design and production of cutting-edge and effective autonomous surface vehicles.
Three ASVs are operated by the NOC: an ASV-Global Ltd C-Enduro, a MOST Ltd AutoNaut, and a Liquid Robotics SV3 Waveglider from the USA. Each has unique advantages and disadvantages. The key trends in the global market for autonomous surface vehicles include growing research and development in the hydrography and oceanography fields as well as a growing need for monitoring anti-submarine warfare and ocean quality.
Submarine gliders and autonomous underwater vehicles are the two main products sold in the autonomous marine vehicles market. Values in this market are referred to as "factory gate values," which are the prices at which goods are sold by their producers, whether they sell them directly to consumers or to other businesses (such as other producers down the supply chain, wholesalers, distributors, and retailers). The creators' sales of complementary services are included in the value of the goods in this market.
The need for trustworthy, highly advanced, and reliable USVs, particularly in the military sector, as well as extensive ocean freshwater contamination projects and the need to prevent contamination are the main factors propelling the growth of the global autonomous surface vehicle market. In the military, autonomous surface vehicles are used for target detection and mine clearance operations. Additionally, USVs are regarded as essential vehicles for use in hydrographic survey. By acting as a force multiplier, using small USVs in tandem with traditional survey vessels aims to double survey coverage while decreasing on-time site.
An oceanographic survey contributes to a thorough understanding of marine and freshwater environments for port and harbour development, wastewater and industrial outfalls, power plant intakes and outfalls, and offshore disposals. An autonomous surface vehicle (ASV) offers a cost- and time-effective way to carry out a hydrographic survey.
The market for autonomous marine vehicles is significantly constrained by the vulnerability of ships to cyber threats as a result of automation. This is primarily due to the fact that cyberspace and the infrastructure it is connected to are susceptible to a wide range of risks from cyberthreats and attacks. Security breaches are more likely when automation is used as it eliminates the need for human intervention on ships and in ports.
[caption id="attachment_20848" align="aligncenter" width="1920"]
Frequently Asked Questions
• What is the worth of global Autonomous Surface Vehicles (ASV) market?
The Autonomous Surface Vehicles (ASV) market size had crossed USD 714.85 Million in 2020 and will observe a CAGR of more than 11.8% up to 2029 driven by the increasing adoption in defense.
• What are the upcoming trends of Autonomous Surface Vehicles (ASV) market, globally?
The upcoming trend in Autonomous Surface Vehicles (ASV) market is an opportunity in enterprise applications is an opportunity for market growth.
• What is the CAGR of Autonomous Surface Vehicles (ASV) market?
The global Autonomous Surface Vehicles (ASV) market registered a CAGR of 11.8% from 2022 to 2029. The application segment was the highest revenue contributor to the market.
• Which are the top companies to hold the market share in Autonomous Surface Vehicles (ASV) market?
Key players profiled in the report ASV Global, Teledyne Marine, Textron, Elbit Systems, ATLAS ELEKTRONIK, ECA GROUP, Liquid Robotics, SeaRobotics, Rafael Advanced Defense Systems, 5G International, ASV Unmanned Marine Systems, Israel Aerospace Industries, Kongsberg Maritime.
• Which is the largest regional market for Autonomous Surface Vehicles (ASV) market?
The North America region dominated the market, accounting for more than 38% of worldwide revenue in 2021. The growth of the market in this region is attributed towards increasing incidents of violence in countries along with rampant technological upgradation.
Autonomous Surface Vehicles (ASV) Segment Analysis
Surface vehicles and underwater vehicles are the two main categories of autonomous marine vehicles. As opposed to a tube car or any other elevated car, a surface vehicle is a vehicle used for transportation on land. Military and defense, archaeology, exploration, oil and gas, environmental protection and monitoring, search and rescue operations, and oceanography are among the various applications involved. Imaging, navigation, communication, collision avoidance, and propulsion technologies are all involved.
The market is divided into mechanical propulsion equipment, hybrid propulsion equipment, electric propulsion equipment, and solar powered propulsion equipment based on type. Due to their versatility and ability to carry out a variety of tasks, such as surveillance, environmental monitoring, and oceanographic research, autonomous surface vehicles are anticipated to command the largest market share.
The market is classified into four applications: defence, scientific research, commercial, and miscellaneous. The largest segment is anticipated to be oceanographic research, which will be fuelled by the rising demand for autonomous systems in scientific investigation and exploration.
[caption id="attachment_20849" align="aligncenter" width="1920"]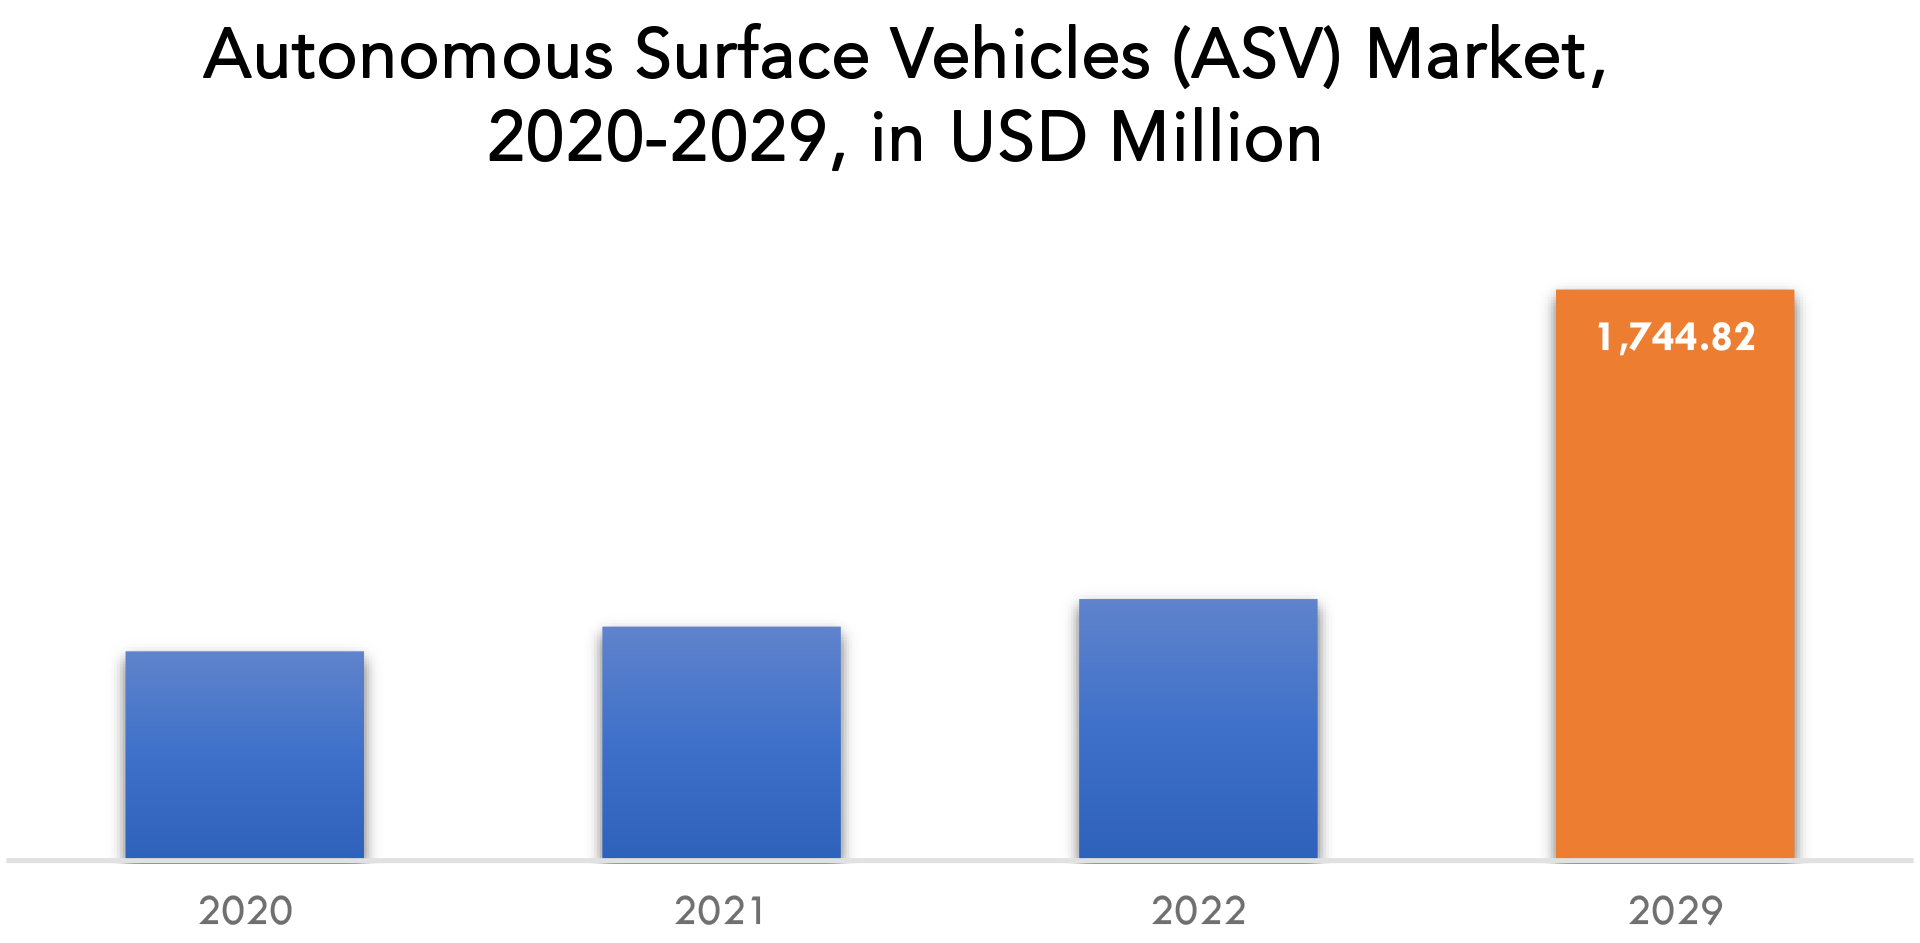
Autonomous Surface Vehicles (ASV) Market Players
The major players operating in the global Autonomous Surface Vehicles (ASV) industry include ASV Global, Teledyne Marine, Textron, Elbit Systems, ATLAS ELEKTRONIK, ECA GROUP, Liquid Robotics, SeaRobotics, Rafael Advanced Defense Systems, 5G International, ASV Unmanned Marine Systems, Israel Aerospace Industries, Kongsberg Maritime. Mergers and acquisitions, joint ventures, capacity increases, major distribution, and branding decisions to increase market share and regional presence are characteristics of the presence of established industry players. Additionally, they are working continuously on R&D projects to create new products and are concentrating on growing their product line. As a result, there will likely be more competition and a threat to new market entrants.
Who Should Buy? Or Key stakeholders
- Research and development
- Manufacturing
- End Use industries
- Automotive
- Electronic Industry
- E-Commerce and Retail
- Industrial and Manufacturing
Autonomous Surface Vehicles (ASV) Market Regional Analysis
Geographically, the Autonomous Surface Vehicles (ASV) market is segmented into North America, South America, Europe, APAC and MEA.- North America: includes the US, Canada, Mexico
- Europe: includes UK, Germany, France, Italy, Spain, Russia, and Rest of Europe
- Asia Pacific: includes China, Japan, South Korea, India, Australia, ASEAN and Rest of APAC
- South America: includes Brazil, Argentina and Rest of South America
- Middle East & Africa: includes Turkey, UAE, Saudi Arabia, South Africa, and Rest of MEA
A virus or fungus that has a general or specific effect on or against harmful aquatic organisms or pathogens is considered an active substance under the International Convention for the Control and Management of Ships' Ballast Water and Sediments. Therefore, rules like these would keep both the makers of ballast water management systems and the businesses in the market for autonomous marine vehicles under control.
Due to the presence of several major players in the region, the rising demand for unmanned systems in marine applications, and supportive government initiatives, the ASV market in North America is anticipated to hold the largest market share. Due to the presence of several top ASV manufacturers and suppliers in the country, the United States is the largest market for ASVs in North America.
A large demand for ocean data mapping and water quality monitoring is expected to cause Europe to experience the highest CAGR during the forecast period. Other factors boosting the development of the unmanned surface vehicle market in this region include the soaring demand for autonomous surface vehicles used by navies for ISR operations and oceanographic studies. Due to the rising use of ASVs in military and defense applications, the rising demand for unmanned systems in marine research and exploration, and the growing emphasis on marine environmental monitoring, the ASV market in the Asia-Pacific region is anticipated to experience the highest growth during the forecast period. China, Japan, and South Korea are anticipated to be the region's ASV market's main growth contributors.
The swarm uses several sensing techniques to quickly sense a larger area while working together to create a detailed map of the environment as it navigates through the underwater environment. For instance, the Ocean2020 research project, which the European Union (EU) is currently funding, enables the combination of drones and unmanned submarines into swarms or fleet units.
[caption id="attachment_20851" align="aligncenter" width="1920"]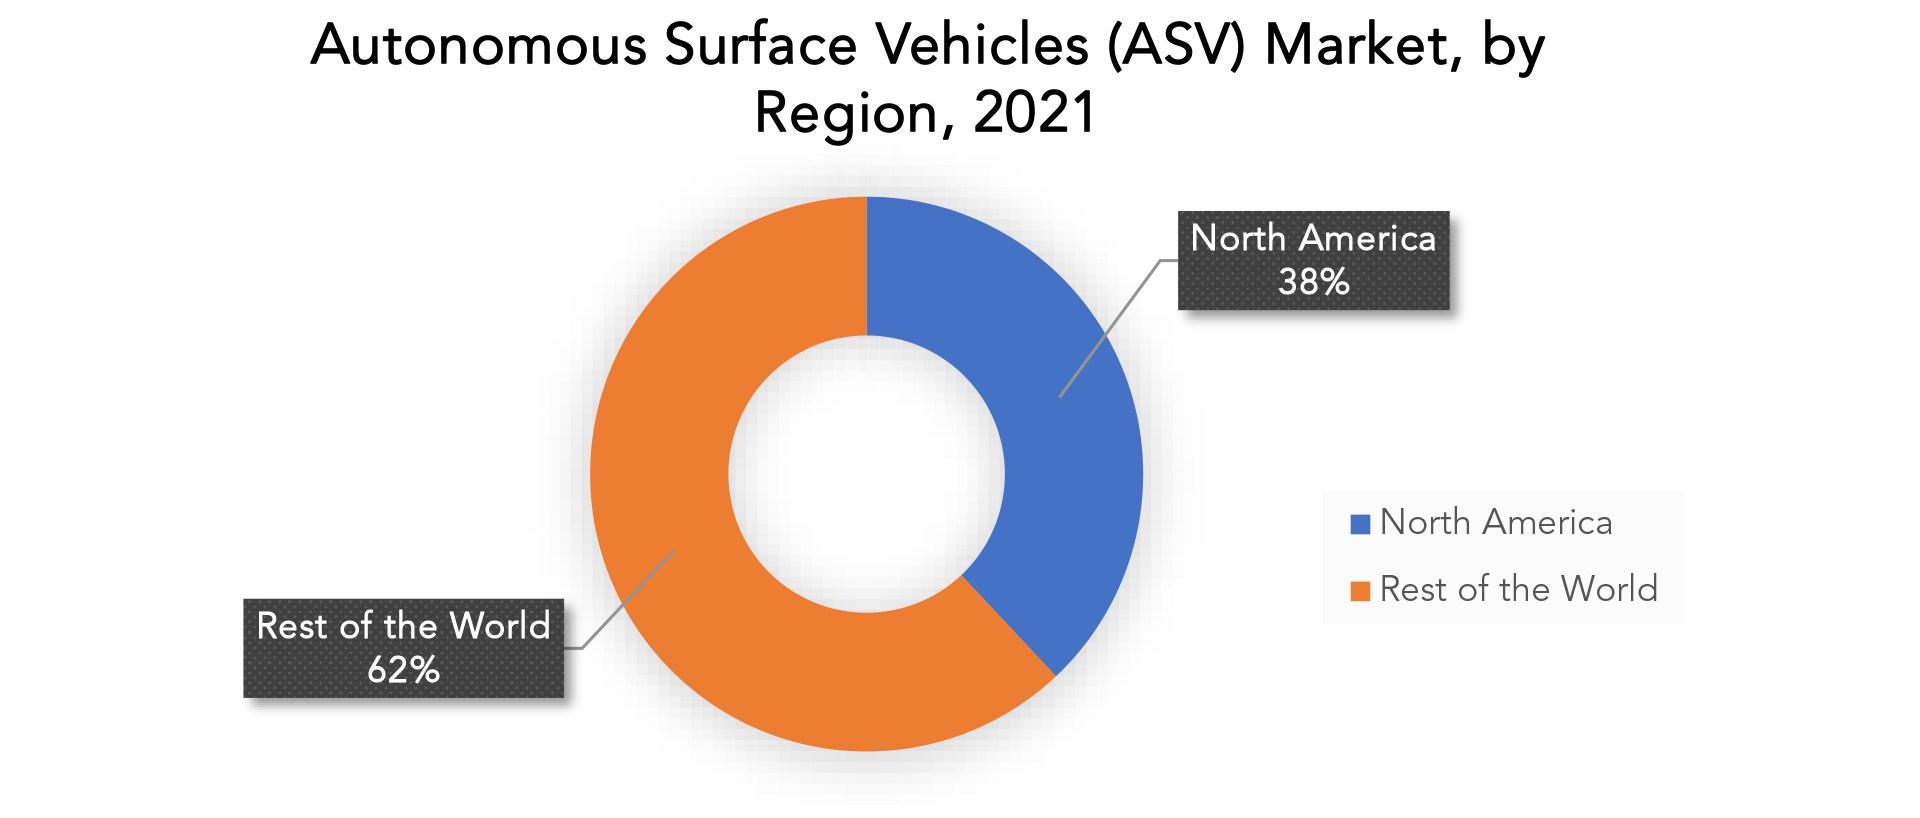
Key Market Segments: Autonomous Surface Vehicles (ASV) Market
Autonomous Surface Vehicles (ASV) Market By Type, 2020-2029, (USD Million) (Thousand Units)- Mechanical Propulsion Equipment
- Hybrid Propulsion Equipment
- Electric Propulsion Equipment
- Solar Powered Propulsion Equipment
- Defense
- Scientific Research
- Commercial
- Miscellaneous
- North America
- Europe
- Asia Pacific
- South America
- Middle East And Africa
Key Question Answered
- What is the expected growth rate of the Autonomous Surface Vehicles (ASV) market over the next 7 years?
- Who are the major players in the Autonomous Surface Vehicles (ASV) market and what is their market share?
- What are the end-user industries driving demand for market and what is their outlook?
- What are the opportunities for growth in emerging markets such as Asia-Pacific, Middle East, and Africa?
- How is the economic environment affecting the Autonomous Surface Vehicles (ASV) market, including factors such as interest rates, inflation, and exchange rates?
- What is the expected impact of government policies and regulations on the Autonomous Surface Vehicles (ASV) market?
- What is the current and forecasted size and growth rate of the global Autonomous Surface Vehicles (ASV) market?
- What are the key drivers of growth in the Autonomous Surface Vehicles (ASV) market?
- Who are the major players in the market and what is their market share?
- What are the distribution channels and supply chain dynamics in the Autonomous Surface Vehicles (ASV) market?
- What are the technological advancements and innovations in the Autonomous Surface Vehicles (ASV) market and their impact on product development and growth?
- What are the regulatory considerations and their impact on the market?
- What are the challenges faced by players in the Autonomous Surface Vehicles (ASV) market and how are they addressing these challenges?
- What are the opportunities for growth and expansion in the Autonomous Surface Vehicles (ASV) market?
- What are the product offerings and specifications of leading players in the market?
- What is the pricing trend of toluene in the market and what is the impact of raw material prices on the price trend?
- INTRODUCTION
- MARKET DEFINITION
- MARKET SEGMENTATION
- RESEARCH TIMELINES
- ASSUMPTIONS AND LIMITATIONS
- RESEARCH METHODOLOGY
- DATA MINING
- SECONDARY RESEARCH
- PRIMARY RESEARCH
- SUBJECT-MATTER EXPERTS’ ADVICE
- QUALITY CHECKS
- FINAL REVIEW
- DATA TRIANGULATION
- BOTTOM-UP APPROACH
- TOP-DOWN APPROACH
- RESEARCH FLOW
- DATA SOURCES
- DATA MINING
- EXECUTIVE SUMMARY
- MARKET OVERVIEW
- GLOBAL AUTONOMOUS SURFACE VEHICLES (ASV) MARKET OUTLOOK
- MARKET DRIVERS
- MARKET RESTRAINTS
- MARKET OPPORTUNITIES
- IMPACT OF COVID-19 ON AUTONOMOUS SURFACE VEHICLES (ASV) MARKET
- PORTER’S FIVE FORCES MODEL
- THREAT FROM NEW ENTRANTS
- THREAT FROM SUBSTITUTES
- BARGAINING POWER OF SUPPLIERS
- BARGAINING POWER OF CUSTOMERS
- DEGREE OF COMPETITION
- INDUSTRY VALUE CHAIN ANALYSIS
- GLOBAL AUTONOMOUS SURFACE VEHICLES (ASV) MARKET OUTLOOK
- GLOBAL AUTONOMOUS SURFACE VEHICLES (ASV) MARKET BY TYPE, 2020-2029, (USD MILLION) (THOUSAND UNITS)
- MECHANICAL PROPULSION EQUIPMENT
- HYBRID PROPULSION EQUIPMENT
- ELECTRIC PROPULSION EQUIPMENT
- SOLAR POWERED PROPULSION EQUIPMENT
- GLOBAL AUTONOMOUS SURFACE VEHICLES (ASV) MARKET BY APPLICATION, 2020-2029, (USD MILLION) (THOUSAND UNITS)
- DEFENSE
- SCIENTIFIC RESEARCH
- COMMERCIAL
- MISCELLANEOUS
- GLOBAL AUTONOMOUS SURFACE VEHICLES (ASV) MARKET BY REGION, 2020-2029, (USD MILLION) (THOUSAND UNITS)
- NORTH AMERICA
- US
- CANADA
- MEXICO
- SOUTH AMERICA
- BRAZIL
- ARGENTINA
- COLOMBIA
- REST OF SOUTH AMERICA
- EUROPE
- GERMANY
- UK
- FRANCE
- ITALY
- SPAIN
- RUSSIA
- REST OF EUROPE
- ASIA PACIFIC
- INDIA
- CHINA
- JAPAN
- SOUTH KOREA
- AUSTRALIA
- SOUTH-EAST ASIA
- REST OF ASIA PACIFIC
- MIDDLE EAST AND AFRICA
- UAE
- SAUDI ARABIA
- SOUTH AFRICA
- REST OF MIDDLE EAST AND AFRICA
- NORTH AMERICA
- COMPANY PROFILES*
(BUSINESS OVERVIEW, COMPANY SNAPSHOT, PRODUCTS OFFERED, RECENT DEVELOPMENTS)
8.1. ASV GLOBAL
8.2. TELEDYNE MARINE
8.3. TEXTRON
8.4. ELBIT SYSTEMS
8.5. ATLAS ELEKTRONIK
8.6. ECA GROUP
8.7. LIQUID ROBOTICS
8.8. SEAROBOTICS
8.9. RAFAEL ADVANCED DEFENSE SYSTEMS
8.10. ASV UNMANNED MARINE SYSTEMS*THE COMPANY LIST IS INDICATIVE
LIST OF TABLES
TABLE 1 GLOBAL AUTONOMOUS SURFACE VEHICLES (ASV) MARKET BY TYPE (USD MILLION) 2020-2029
TABLE 2 GLOBAL AUTONOMOUS SURFACE VEHICLES (ASV) MARKET BY TYPE (THOUSAND UNITS) 2020-2029
TABLE 3 GLOBAL AUTONOMOUS SURFACE VEHICLES (ASV) MARKET BY APPLICATION (USD MILLION) 2020-2029
TABLE 4 GLOBAL AUTONOMOUS SURFACE VEHICLES (ASV) MARKET BY APPLICATION (THOUSAND UNITS) 2020-2029
TABLE 5 GLOBAL AUTONOMOUS SURFACE VEHICLES (ASV) MARKET BY REGION (USD MILLION) 2020-2029
TABLE 6 GLOBAL AUTONOMOUS SURFACE VEHICLES (ASV) MARKET BY REGION (THOUSAND UNITS) 2020-2029
TABLE 7 NORTH AMERICA AUTONOMOUS SURFACE VEHICLES (ASV) MARKET BY TYPE (USD MILLION) 2020-2029
TABLE 8 NORTH AMERICA AUTONOMOUS SURFACE VEHICLES (ASV) MARKET BY TYPE (THOUSAND UNITS) 2020-2029
TABLE 9 NORTH AMERICA AUTONOMOUS SURFACE VEHICLES (ASV) MARKET BY APPLICATION (USD MILLION) 2020-2029
TABLE 10 NORTH AMERICA AUTONOMOUS SURFACE VEHICLES (ASV) MARKET BY APPLICATION (THOUSAND UNITS) 2020-2029
TABLE 11 NORTH AMERICA AUTONOMOUS SURFACE VEHICLES (ASV) MARKET BY COUNTRY (USD MILLION) 2020-2029
TABLE 12 NORTH AMERICA AUTONOMOUS SURFACE VEHICLES (ASV) MARKET BY COUNTRY (THOUSAND UNITS) 2020-2029
TABLE 13 US AUTONOMOUS SURFACE VEHICLES (ASV) MARKET BY TYPE (USD MILLION) 2020-2029
TABLE 14 US AUTONOMOUS SURFACE VEHICLES (ASV) MARKET BY TYPE (THOUSAND UNITS) 2020-2029
TABLE 15 US AUTONOMOUS SURFACE VEHICLES (ASV) MARKET BY APPLICATION (USD MILLION) 2020-2029
TABLE 16 US AUTONOMOUS SURFACE VEHICLES (ASV) MARKET BY APPLICATION (THOUSAND UNITS) 2020-2029
TABLE 17 CANADA AUTONOMOUS SURFACE VEHICLES (ASV) MARKET BY TYPE (USD MILLION) 2020-2029
TABLE 18 CANADA AUTONOMOUS SURFACE VEHICLES (ASV) MARKET BY TYPE (THOUSAND UNITS) 2020-2029
TABLE 19 CANADA AUTONOMOUS SURFACE VEHICLES (ASV) MARKET BY APPLICATION (USD MILLION) 2020-2029
TABLE 20 CANADA AUTONOMOUS SURFACE VEHICLES (ASV) MARKET BY APPLICATION (THOUSAND UNITS) 2020-2029
TABLE 21 MEXICO AUTONOMOUS SURFACE VEHICLES (ASV) MARKET BY TYPE (USD MILLION) 2020-2029
TABLE 22 MEXICO AUTONOMOUS SURFACE VEHICLES (ASV) MARKET BY TYPE (THOUSAND UNITS) 2020-2029
TABLE 23 MEXICO AUTONOMOUS SURFACE VEHICLES (ASV) MARKET BY APPLICATION (USD MILLION) 2020-2029
TABLE 24 MEXICO AUTONOMOUS SURFACE VEHICLES (ASV) MARKET BY APPLICATION (THOUSAND UNITS) 2020-2029
TABLE 25 SOUTH AMERICA AUTONOMOUS SURFACE VEHICLES (ASV) MARKET BY TYPE (USD MILLION) 2020-2029
TABLE 26 SOUTH AMERICA AUTONOMOUS SURFACE VEHICLES (ASV) MARKET BY TYPE (THOUSAND UNITS) 2020-2029
TABLE 27 SOUTH AMERICA AUTONOMOUS SURFACE VEHICLES (ASV) MARKET BY APPLICATION (USD MILLION) 2020-2029
TABLE 28 SOUTH AMERICA AUTONOMOUS SURFACE VEHICLES (ASV) MARKET BY APPLICATION (THOUSAND UNITS) 2020-2029
TABLE 29 SOUTH AMERICA AUTONOMOUS SURFACE VEHICLES (ASV) MARKET BY COUNTRY (USD MILLION) 2020-2029
TABLE 30 SOUTH AMERICA AUTONOMOUS SURFACE VEHICLES (ASV) MARKET BY COUNTRY (THOUSAND UNITS) 2020-2029
TABLE 31 BRAZIL AUTONOMOUS SURFACE VEHICLES (ASV) MARKET BY TYPE (USD MILLION) 2020-2029
TABLE 32 BRAZIL AUTONOMOUS SURFACE VEHICLES (ASV) MARKET BY TYPE (THOUSAND UNITS) 2020-2029
TABLE 33 BRAZIL AUTONOMOUS SURFACE VEHICLES (ASV) MARKET BY APPLICATION (USD MILLION) 2020-2029
TABLE 34 BRAZIL AUTONOMOUS SURFACE VEHICLES (ASV) MARKET BY APPLICATION (THOUSAND UNITS) 2020-2029
TABLE 35 ARGENTINA AUTONOMOUS SURFACE VEHICLES (ASV) MARKET BY TYPE (USD MILLION) 2020-2029
TABLE 36 ARGENTINA AUTONOMOUS SURFACE VEHICLES (ASV) MARKET BY TYPE (THOUSAND UNITS) 2020-2029
TABLE 37 ARGENTINA AUTONOMOUS SURFACE VEHICLES (ASV) MARKET BY APPLICATION (USD MILLION) 2020-2029
TABLE 38 ARGENTINA AUTONOMOUS SURFACE VEHICLES (ASV) MARKET BY APPLICATION (THOUSAND UNITS) 2020-2029
TABLE 39 COLOMBIA AUTONOMOUS SURFACE VEHICLES (ASV) MARKET BY TYPE (USD MILLION) 2020-2029
TABLE 40 COLOMBIA AUTONOMOUS SURFACE VEHICLES (ASV) MARKET BY TYPE (THOUSAND UNITS) 2020-2029
TABLE 41 COLOMBIA AUTONOMOUS SURFACE VEHICLES (ASV) MARKET BY APPLICATION (USD MILLION) 2020-2029
TABLE 42 COLOMBIA AUTONOMOUS SURFACE VEHICLES (ASV) MARKET BY APPLICATION (THOUSAND UNITS) 2020-2029
TABLE 43 REST OF SOUTH AMERICA AUTONOMOUS SURFACE VEHICLES (ASV) MARKET BY TYPE (USD MILLION) 2020-2029
TABLE 44 REST OF SOUTH AMERICA AUTONOMOUS SURFACE VEHICLES (ASV) MARKET BY TYPE (THOUSAND UNITS) 2020-2029
TABLE 45 REST OF SOUTH AMERICA AUTONOMOUS SURFACE VEHICLES (ASV) MARKET BY APPLICATION (USD MILLION) 2020-2029
TABLE 46 REST OF SOUTH AMERICA AUTONOMOUS SURFACE VEHICLES (ASV) MARKET BY APPLICATION (THOUSAND UNITS) 2020-2029
TABLE 47 ASIA PACIFIC AUTONOMOUS SURFACE VEHICLES (ASV) MARKET BY TYPE (USD MILLION) 2020-2029
TABLE 48 ASIA PACIFIC AUTONOMOUS SURFACE VEHICLES (ASV) MARKET BY TYPE (THOUSAND UNITS) 2020-2029
TABLE 49 ASIA PACIFIC AUTONOMOUS SURFACE VEHICLES (ASV) MARKET BY APPLICATION (USD MILLION) 2020-2029
TABLE 50 ASIA PACIFIC AUTONOMOUS SURFACE VEHICLES (ASV) MARKET BY APPLICATION (THOUSAND UNITS) 2020-2029
TABLE 51 ASIA PACIFIC AUTONOMOUS SURFACE VEHICLES (ASV) MARKET BY COUNTRY (USD MILLION) 2020-2029
TABLE 52 ASIA PACIFIC AUTONOMOUS SURFACE VEHICLES (ASV) MARKET BY COUNTRY (THOUSAND UNITS) 2020-2029
TABLE 53 INDIA AUTONOMOUS SURFACE VEHICLES (ASV) MARKET BY TYPE (USD MILLION) 2020-2029
TABLE 54 INDIA AUTONOMOUS SURFACE VEHICLES (ASV) MARKET BY TYPE (THOUSAND UNITS) 2020-2029
TABLE 55 INDIA AUTONOMOUS SURFACE VEHICLES (ASV) MARKET BY APPLICATION (USD MILLION) 2020-2029
TABLE 56 INDIA AUTONOMOUS SURFACE VEHICLES (ASV) MARKET BY APPLICATION (THOUSAND UNITS) 2020-2029
TABLE 57 CHINA AUTONOMOUS SURFACE VEHICLES (ASV) MARKET BY TYPE (USD MILLION) 2020-2029
TABLE 58 CHINA AUTONOMOUS SURFACE VEHICLES (ASV) MARKET BY TYPE (THOUSAND UNITS) 2020-2029
TABLE 59 CHINA AUTONOMOUS SURFACE VEHICLES (ASV) MARKET BY APPLICATION (USD MILLION) 2020-2029
TABLE 60 CHINA AUTONOMOUS SURFACE VEHICLES (ASV) MARKET BY APPLICATION (THOUSAND UNITS) 2020-2029
TABLE 61 JAPAN AUTONOMOUS SURFACE VEHICLES (ASV) MARKET BY TYPE (USD MILLION) 2020-2029
TABLE 62 JAPAN AUTONOMOUS SURFACE VEHICLES (ASV) MARKET BY TYPE (THOUSAND UNITS) 2020-2029
TABLE 63 JAPAN AUTONOMOUS SURFACE VEHICLES (ASV) MARKET BY APPLICATION (USD MILLION) 2020-2029
TABLE 64 JAPAN AUTONOMOUS SURFACE VEHICLES (ASV) MARKET BY APPLICATION (THOUSAND UNITS) 2020-2029
TABLE 65 SOUTH KOREA AUTONOMOUS SURFACE VEHICLES (ASV) MARKET BY TYPE (USD MILLION) 2020-2029
TABLE 66 SOUTH KOREA AUTONOMOUS SURFACE VEHICLES (ASV) MARKET BY TYPE (THOUSAND UNITS) 2020-2029
TABLE 67 SOUTH KOREA AUTONOMOUS SURFACE VEHICLES (ASV) MARKET BY APPLICATION (USD MILLION) 2020-2029
TABLE 68 SOUTH KOREA AUTONOMOUS SURFACE VEHICLES (ASV) MARKET BY APPLICATION (THOUSAND UNITS) 2020-2029
TABLE 69 AUSTRALIA AUTONOMOUS SURFACE VEHICLES (ASV) MARKET BY TYPE (USD MILLION) 2020-2029
TABLE 70 AUSTRALIA AUTONOMOUS SURFACE VEHICLES (ASV) MARKET BY TYPE (THOUSAND UNITS) 2020-2029
TABLE 71 AUSTRALIA AUTONOMOUS SURFACE VEHICLES (ASV) MARKET BY APPLICATION (USD MILLION) 2020-2029
TABLE 72 AUSTRALIA AUTONOMOUS SURFACE VEHICLES (ASV) MARKET BY APPLICATION (THOUSAND UNITS) 2020-2029
TABLE 73 SOUTH EAST ASIA AUTONOMOUS SURFACE VEHICLES (ASV) MARKET BY TYPE (USD MILLION) 2020-2029
TABLE 74 SOUTH EAST ASIA AUTONOMOUS SURFACE VEHICLES (ASV) MARKET BY TYPE (THOUSAND UNITS) 2020-2029
TABLE 75 SOUTH EAST ASIA AUTONOMOUS SURFACE VEHICLES (ASV) MARKET BY APPLICATION (USD MILLION) 2020-2029
TABLE 76 SOUTH EAST ASIA AUTONOMOUS SURFACE VEHICLES (ASV) MARKET BY APPLICATION (THOUSAND UNITS) 2020-2029
TABLE 77 REST OF ASIA PACIFIC AUTONOMOUS SURFACE VEHICLES (ASV) MARKET BY TYPE (USD MILLION) 2020-2029
TABLE 78 REST OF ASIA PACIFIC AUTONOMOUS SURFACE VEHICLES (ASV) MARKET BY TYPE (THOUSAND UNITS) 2020-2029
TABLE 79 REST OF ASIA PACIFIC AUTONOMOUS SURFACE VEHICLES (ASV) MARKET BY APPLICATION (USD MILLION) 2020-2029
TABLE 80 REST OF ASIA PACIFIC AUTONOMOUS SURFACE VEHICLES (ASV) MARKET BY APPLICATION (THOUSAND UNITS) 2020-2029
TABLE 81 EUROPE AUTONOMOUS SURFACE VEHICLES (ASV) MARKET BY TYPE (USD MILLION) 2020-2029
TABLE 82 EUROPE AUTONOMOUS SURFACE VEHICLES (ASV) MARKET BY TYPE (THOUSAND UNITS) 2020-2029
TABLE 83 EUROPE AUTONOMOUS SURFACE VEHICLES (ASV) MARKET BY APPLICATION (USD MILLION) 2020-2029
TABLE 84 EUROPE AUTONOMOUS SURFACE VEHICLES (ASV) MARKET BY APPLICATION (THOUSAND UNITS) 2020-2029
TABLE 85 EUROPE AUTONOMOUS SURFACE VEHICLES (ASV) MARKET BY COUNTRY (USD MILLION) 2020-2029
TABLE 86 EUROPE AUTONOMOUS SURFACE VEHICLES (ASV) MARKET BY COUNTRY (THOUSAND UNITS) 2020-2029
TABLE 87 GERMANY AUTONOMOUS SURFACE VEHICLES (ASV) MARKET BY TYPE (USD MILLION) 2020-2029
TABLE 88 GERMANY AUTONOMOUS SURFACE VEHICLES (ASV) MARKET BY TYPE (THOUSAND UNITS) 2020-2029
TABLE 89 GERMANY AUTONOMOUS SURFACE VEHICLES (ASV) MARKET BY APPLICATION (USD MILLION) 2020-2029
TABLE 90 GERMANY AUTONOMOUS SURFACE VEHICLES (ASV) MARKET BY APPLICATION (THOUSAND UNITS) 2020-2029
TABLE 91 UK AUTONOMOUS SURFACE VEHICLES (ASV) MARKET BY TYPE (USD MILLION) 2020-2029
TABLE 92 UK AUTONOMOUS SURFACE VEHICLES (ASV) MARKET BY TYPE (THOUSAND UNITS) 2020-2029
TABLE 93 UK AUTONOMOUS SURFACE VEHICLES (ASV) MARKET BY APPLICATION (USD MILLION) 2020-2029
TABLE 94 UK AUTONOMOUS SURFACE VEHICLES (ASV) MARKET BY APPLICATION (THOUSAND UNITS) 2020-2029
TABLE 95 FRANCE AUTONOMOUS SURFACE VEHICLES (ASV) MARKET BY TYPE (USD MILLION) 2020-2029
TABLE 96 FRANCE AUTONOMOUS SURFACE VEHICLES (ASV) MARKET BY TYPE (THOUSAND UNITS) 2020-2029
TABLE 97 FRANCE AUTONOMOUS SURFACE VEHICLES (ASV) MARKET BY APPLICATION (USD MILLION) 2020-2029
TABLE 98 FRANCE AUTONOMOUS SURFACE VEHICLES (ASV) MARKET BY APPLICATION (THOUSAND UNITS) 2020-2029
TABLE 99 ITALY AUTONOMOUS SURFACE VEHICLES (ASV) MARKET BY TYPE (USD MILLION) 2020-2029
TABLE 100 ITALY AUTONOMOUS SURFACE VEHICLES (ASV) MARKET BY TYPE (THOUSAND UNITS) 2020-2029
TABLE 101 ITALY AUTONOMOUS SURFACE VEHICLES (ASV) MARKET BY APPLICATION (USD MILLION) 2020-2029
TABLE 102 ITALY AUTONOMOUS SURFACE VEHICLES (ASV) MARKET BY APPLICATION (THOUSAND UNITS) 2020-2029
TABLE 103 SPAIN AUTONOMOUS SURFACE VEHICLES (ASV) MARKET BY TYPE (USD MILLION) 2020-2029
TABLE 104 SPAIN AUTONOMOUS SURFACE VEHICLES (ASV) MARKET BY TYPE (THOUSAND UNITS) 2020-2029
TABLE 105 SPAIN AUTONOMOUS SURFACE VEHICLES (ASV) MARKET BY APPLICATION (USD MILLION) 2020-2029
TABLE 106 SPAIN AUTONOMOUS SURFACE VEHICLES (ASV) MARKET BY APPLICATION (THOUSAND UNITS) 2020-2029
TABLE 107 RUSSIA AUTONOMOUS SURFACE VEHICLES (ASV) MARKET BY TYPE (USD MILLION) 2020-2029
TABLE 108 RUSSIA AUTONOMOUS SURFACE VEHICLES (ASV) MARKET BY TYPE (THOUSAND UNITS) 2020-2029
TABLE 109 RUSSIA AUTONOMOUS SURFACE VEHICLES (ASV) MARKET BY APPLICATION (USD MILLION) 2020-2029
TABLE 110 RUSSIA AUTONOMOUS SURFACE VEHICLES (ASV) MARKET BY APPLICATION (THOUSAND UNITS) 2020-2029
TABLE 111 REST OF EUROPE AUTONOMOUS SURFACE VEHICLES (ASV) MARKET BY TYPE (USD MILLION) 2020-2029
TABLE 112 REST OF EUROPE AUTONOMOUS SURFACE VEHICLES (ASV) MARKET BY TYPE (THOUSAND UNITS) 2020-2029
TABLE 113 REST OF EUROPE AUTONOMOUS SURFACE VEHICLES (ASV) MARKET BY APPLICATION (USD MILLION) 2020-2029
TABLE 114 REST OF EUROPE AUTONOMOUS SURFACE VEHICLES (ASV) MARKET BY APPLICATION (THOUSAND UNITS) 2020-2029
TABLE 115 MIDDLE EAST & AFRICA AUTONOMOUS SURFACE VEHICLES (ASV) MARKET BY TYPE (USD MILLION) 2020-2029
TABLE 116 MIDDLE EAST & AFRICA AUTONOMOUS SURFACE VEHICLES (ASV) MARKET BY TYPE (THOUSAND UNITS) 2020-2029
TABLE 117 MIDDLE EAST & AFRICA AUTONOMOUS SURFACE VEHICLES (ASV) MARKET BY APPLICATION (USD MILLION) 2020-2029
TABLE 118 MIDDLE EAST & AFRICA AUTONOMOUS SURFACE VEHICLES (ASV) MARKET BY APPLICATION (THOUSAND UNITS) 2020-2029
TABLE 119 MIDDLE EAST & AFRICA AUTONOMOUS SURFACE VEHICLES (ASV) MARKET BY COUNTRY (USD MILLION) 2020-2029
TABLE 120 MIDDLE EAST & AFRICA AUTONOMOUS SURFACE VEHICLES (ASV) MARKET BY COUNTRY (THOUSAND UNITS) 2020-2029
TABLE 121 UAE AUTONOMOUS SURFACE VEHICLES (ASV) MARKET BY TYPE (USD MILLION) 2020-2029
TABLE 122 UAE AUTONOMOUS SURFACE VEHICLES (ASV) MARKET BY TYPE (THOUSAND UNITS) 2020-2029
TABLE 123 UAE AUTONOMOUS SURFACE VEHICLES (ASV) MARKET BY APPLICATION (USD MILLION) 2020-2029
TABLE 124 UAE AUTONOMOUS SURFACE VEHICLES (ASV) MARKET BY APPLICATION (THOUSAND UNITS) 2020-2029
TABLE 125 SAUDI ARABIA AUTONOMOUS SURFACE VEHICLES (ASV) MARKET BY TYPE (USD MILLION) 2020-2029
TABLE 126 SAUDI ARABIA AUTONOMOUS SURFACE VEHICLES (ASV) MARKET BY TYPE (THOUSAND UNITS) 2020-2029
TABLE 127 SAUDI ARABIA AUTONOMOUS SURFACE VEHICLES (ASV) MARKET BY APPLICATION (USD MILLION) 2020-2029
TABLE 128 SAUDI ARABIA AUTONOMOUS SURFACE VEHICLES (ASV) MARKET BY APPLICATION (THOUSAND UNITS) 2020-2029
TABLE 129 SOUTH AFRICA AUTONOMOUS SURFACE VEHICLES (ASV) MARKET BY TYPE (USD MILLION) 2020-2029
TABLE 130 SOUTH AFRICA AUTONOMOUS SURFACE VEHICLES (ASV) MARKET BY TYPE (THOUSAND UNITS) 2020-2029
TABLE 131 SOUTH AFRICA AUTONOMOUS SURFACE VEHICLES (ASV) MARKET BY APPLICATION (USD MILLION) 2020-2029
TABLE 132 SOUTH AFRICA AUTONOMOUS SURFACE VEHICLES (ASV) MARKET BY APPLICATION (THOUSAND UNITS) 2020-2029
TABLE 133 REST OF MIDDLE EAST & AFRICA AUTONOMOUS SURFACE VEHICLES (ASV) MARKET BY TYPE (USD MILLION) 2020-2029
TABLE 134 REST OF MIDDLE EAST & AFRICA AUTONOMOUS SURFACE VEHICLES (ASV) MARKET BY TYPE (THOUSAND UNITS) 2020-2029
TABLE 135 REST OF MIDDLE EAST & AFRICA AUTONOMOUS SURFACE VEHICLES (ASV) MARKET BY APPLICATION (USD MILLION) 2020-2029
TABLE 136 REST OF MIDDLE EAST & AFRICA AUTONOMOUS SURFACE VEHICLES (ASV) MARKET BY APPLICATION (THOUSAND UNITS) 2020-2029
LIST OF FIGURES
FIGURE 1 MARKET DYNAMICS
FIGURE 2 MARKET SEGMENTATION
FIGURE 3 REPORT TIMELINES: YEARS CONSIDERED
FIGURE 4 DATA TRIANGULATION
FIGURE 5 BOTTOM-UP APPROACH
FIGURE 6 TOP-DOWN APPROACH
FIGURE 7 RESEARCH FLOW
FIGURE 8 GLOBAL AUTONOMOUS SURFACE VEHICLES (ASV) MARKET BY TYPE, USD MILLION, 2020-2029
FIGURE 9 GLOBAL AUTONOMOUS SURFACE VEHICLES (ASV) MARKET BY APPLICATION, USD MILLION, 2020-2029
FIGURE 10 GLOBAL AUTONOMOUS SURFACE VEHICLES (ASV) MARKET BY REGION, USD MILLION, 2020-2029
FIGURE 11 PORTER’S FIVE FORCES MODEL
FIGURE 12 GLOBAL AUTONOMOUS SURFACE VEHICLES (ASV) MARKET BY TYPE (USD MILLION), 2021
FIGURE 13 GLOBAL AUTONOMOUS SURFACE VEHICLES (ASV) MARKET BY APPLICATION (USD MILLION), 2021
FIGURE 10 GLOBAL AUTONOMOUS SURFACE VEHICLES (ASV) MARKET BY REGION, USD MILLION, 2021
FIGURE 14 MARKET SHARE ANALYSIS
FIGURE 15 ASV GLOBAL: COMPANY SNAPSHOT
FIGURE 16 TELEDYNE MARINE: COMPANY SNAPSHOT
FIGURE 17 TEXTRON: COMPANY SNAPSHOT
FIGURE 18 ELBIT SYSTEMS: COMPANY SNAPSHOT
FIGURE 19 ATLAS ELEKTRONIK: COMPANY SNAPSHOT
FIGURE 20 ECA GROUP: COMPANY SNAPSHOT
FIGURE 21 LIQUID ROBOTICS: COMPANY SNAPSHOT
FIGURE 22 SEAROBOTICS: COMPANY SNAPSHOT
FIGURE 23 RAFAEL ADVANCED DEFENSE SYSTEMS: COMPANY SNAPSHOT
FIGURE 24 ASV UNMANNED MARINE SYSTEMS: COMPANY SNAPSHOT
DOWNLOAD FREE SAMPLE REPORT
License Type
SPEAK WITH OUR ANALYST
Want to know more about the report or any specific requirement?
WANT TO CUSTOMIZE THE REPORT?
Our Clients Speak
We asked them to research ‘ Equipment market’ all over the world, and their whole arrangement was helpful to us. thehealthanalytics.com insightful analysis and reports contributed to our current analysis and in creating a future strategy. Besides, the te
Yosuke Mitsui
Senior Associate Construction Equipment Sales & Marketing
We asked them to research ‘Equipment market’ all over the world, and their whole arrangement was helpful to us. thehealthanalytics.com insightful analysis and reports contributed to our current analysis and in creating a future strategy. Besides, the te


