

Base Year Value ()
x.x %
x.x %
CAGR ()
x.x %
x.x %
Forecast Year Value ()
x.x %
x.x %
Historical Data Period
Largest Region
Forecast Period
Mobile and Wireless Backhaul Market by Type (Equipment, Services) and Application (Building-To-Building Connectivity, Cellular Backhaul, Broadband Connectivity Backhaul, Video Surveillance Backhaul) Region (North America, Asia Pacific, Europe, South America, Middle East & Africa), Global Trends And Forecast From 2019 To 2028
Instant access to hundreds of data points and trends
- Market estimates from 2014-2029
- Competitive analysis, industry segmentation, financial benchmarks
- Incorporates SWOT, Porter's Five Forces and risk management frameworks
- PDF report or online database with Word, Excel and PowerPoint export options
- 100% money back guarantee
Mobile and Wireless Backhaul Market Overview
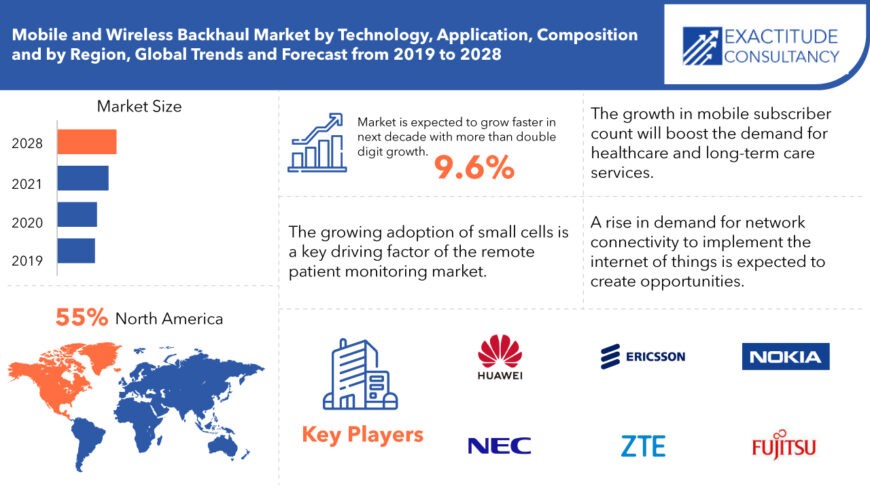
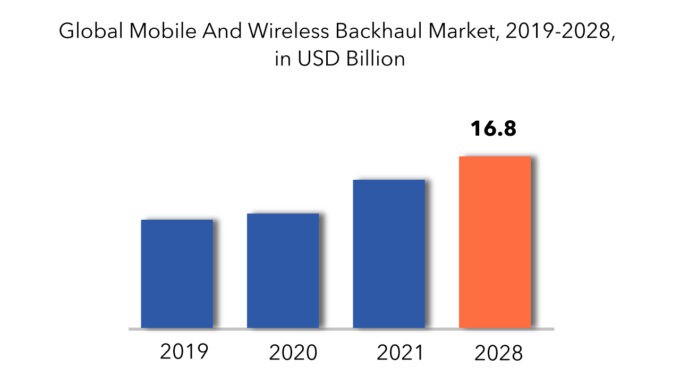
The Global mobile and wireless backhaul market is expected to grow at 9.6 CAGR from 2019 to 2028. It is expected to reach above USD 16.8 billion by 2028 from USD 10.6 billion in 2019.
Backhaul refers to the process of transmitting voice and data traffic from a radio cell site to an edge switch located at the ingress/egress point of the backbone core network. The primary role of wireless and mobile backhaul is to gather data from users and convey it to a network infrastructure, such as an academic institution, government agency, major corporation, or the internet. It also entails the management and distribution of large volumes of data, thereby substantially improving the user experience. Mobile Backhaul (MBH) begins with connecting cell site air interfaces to wireline networks, which are then linked to data centers responsible for hosting the content and applications accessed by mobile users, including both human users and machine-based applications.
The proliferation of small cells, a notable surge in mobile data traffic, and increased adoption of point-to-point microwave transmission technologies are driving the expansion of the Mobile and Wireless Backhaul Market. The Global Mobile and Wireless Backhaul Market report offers a comprehensive assessment of the market, encompassing an analysis of key segments, trends, drivers, restraints, competitive landscape, and factors influencing market dynamics.
[caption id="attachment_2876" align="aligncenter" width="870"]
Regulatory bodies such as the Federal Communications Commission (FCC) in the United States, the European Telecommunications Standards Institute (ETSI) in Europe, and the International Telecommunication Union (ITU) globally play crucial roles in establishing standards, allocating spectrum, and enforcing compliance within the Mobile and Wireless Backhaul sector. These regulations encompass various aspects including spectrum licensing, interference management, quality of service (QoS) standards, data privacy regulations, security protocols, and infrastructure deployment guidelines. Compliance with these regulatory frameworks is imperative for mobile network operators, equipment vendors, and service providers to ensure seamless connectivity, interoperability, and reliability of mobile and wireless backhaul networks.
[caption id="attachment_2878" align="aligncenter" width="680"]
Mobile and Wireless Backhaul Market Segment Analysis
Global mobile and wireless backhaul market by type include Equipment, Services Others. 4G LTE has brought about numerous significant developments, including increased cell backhaul capacity and the introduction of Multiple Input Multiple Output (MIMO) antennas to reduce air interference between towers and User Equipment (UE). 4G runs in frequencies as high as 6GHz, with a peak throughput of 1GB per second. It provides improvements such as increased peak bandwidth and energy efficiency for IoT connectivity. The success of 4G LTE has placed even greater demands on mobile carriers as they aim for more network capacity, reduced latency, and the need to provide a better user experience.
The Services component of the mobile and wireless backhaul Market is predicted to increase at a faster rate. Services allow for the development of a cost-effective, comprehensive, and customizable backhaul transport solution while minimizing expenses and optimizing operational efficiency. Mobile and wireless backhaul service providers provide consultancy for installing the most appropriate topologies and network designs to facilitate the transformation of mobile transport networks.
Mobile and Wireless Backhaul Market Players
From large companies to small ones, many companies are actively working in the mobile and wireless backhaul market. These key players include, Ericssom, Huawei, Nokia, NEC Corporation, ZTE, Fujitsu, Broadcom, Ceragon, Aviat, SIAE, Proxim Wireless, Intracom Telecom, AR RF/Microwave Instrumentation, Redline, DragonWave-X, E-Band, CBNG, Radwin, CableFree, and CommScope.
Companies are mainly in device manufacturing and they are competing closely with each other. Innovation is one of the most important and key strategies as it has to be for any health-related market. However, companies in the market have also opted and successfully driven inorganic growth strategies like mergers & acquisitions and so on.
- Aviat Networks Inc., announced a five-year global supplier frame agreement with Ooredoo. Ooredoo is trying to leverage Aviat's solutions to lower overall expenses.
- Fujitsu Network Communications Inc. and BridgeWave Communications announced the signing of an agreement for Fujitsu to supply and support BridgeWave wireless backhaul systems, as part of Fujitsu’s end-to-end transport solutions portfolio.
Who Should Buy? Or Key stakeholders
- Investors
- Manufacturing companies
- End user companies
- Research institutes
Mobile and Wireless Backhaul Market Segment Regional Analysis
The mobile and wireless backhaul Market by region includes North America, Asia-Pacific (APAC), Europe, South America, and Middle East & Africa (MEA).
- North America: includes the US, Canada, Mexico
- Asia Pacific: includes China, Japan, South Korea, India, Australia, ASEAN and Rest of APAC
- Europe: includes UK, Germany, France, Italy, Spain, Russia, and Rest of Europe
- South America: includes Brazil, Argentina and Rest of South America
- Middle East & Africa: includes Turkey, UAE, Saudi Arabia, South Africa, and Rest of MEA
Its major share is occupied by North America, Europe and Asia Pacific region. North America shares 55% of total market. After that, Europe and Asia Pacific contribute to the 24% and 23% of global market respectively.
[caption id="attachment_2877" align="alignnone" width="680"]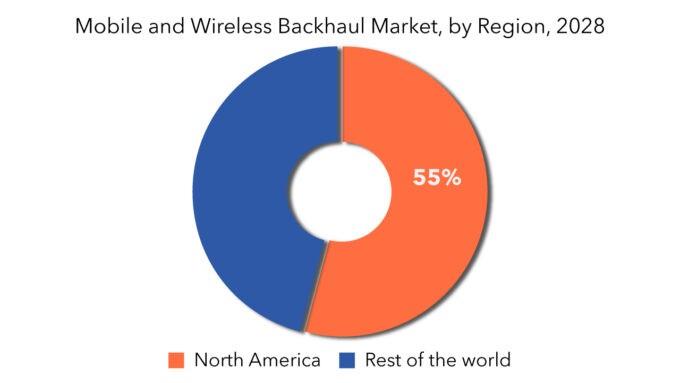
Key Market Segments: Mobile and wireless backhaul Market
Mobile and Wireless Backhaul Market by Type, 2019-2028, (In USD Million)- Equipment
- Services
- Building-To-Building Connectivity
- Cellular Backhaul
- Broadband Connectivity Backhaul
- Video Surveillance Backhaul
- North America
- Europe
- Asia Pacific
- South America
- Middle East And Africa
Key Question Answered
- What are the growth opportunities related to the adoption of mobile and wireless backhaul across major regions in the future?
- What are the new trends and advancements in the mobile and wireless backhaul market?
- Which product categories are expected to have highest growth rate in the mobile and wireless backhaul market?
- Which are the key factors driving the mobile and wireless backhaul market?
- What will the market growth rate, growth momentum or acceleration the market carries during the forecast period?
- Introduction
- Market Definition
- Market Segmentation
- Research Timelines
- Assumptions and Limitations
- Research Methodology
- Data Mining
- Secondary Research
- Primary Research
- Subject-Matter Experts’ Advice
- Quality Checks
- Final Review
- Data Triangulation
- Bottom-Up Approach
- Top-Down Approach
- Research Flow
- Data Sources
- Data Mining
- Executive Summary
- Market Overview
- Global Mobile and Wireless Backhaul Market Outlook
- Market Drivers
- Market Restraints
- Market Opportunities
- Impact of Covid-19 On Global Mobile and Wireless Backhaul Market
- Global Mobile and Wireless Backhaul Market by Service type, (USD Million)
- Equipment
- Services
- Global Mobile and Wireless Backhaul Market by Service Application
- Designing and Consulting
- Integration and Deployment
- Support and Maintenance
- Global Mobile and Wireless Backhaul Market by Region, (USD Million)
- Introduction
- Asia-Pacific
- China
- India
- Japan
- South Korea
- Australia
- South-East Asia
- Rest of Asia-Pacific
- North America
- United States
- Canada
- Mexico
- Europe
- Germany
- United Kingdom
- France
- Italy
- Spain
- Russia
- Rest of Europe
- South America
- Brazil
- Argentina
- Colombia
- Rest of South America
- Middle East and Africa
- UAE
- Saudi Arabia
- South Africa
- Rest of Middle East and Africa
- Company Profiles* (Business Overview, Company Snapshot, Products Offered, Recent Developments)
- Ericssom
- Huawei
- Nokia
- NECCorporation
- ZTE
- Fujitsu
- Broadcom
- Ceragon
- Aviat
- SIAE
- ProximWireless
- IntracomTelecom
- ARRF/MicrowaveInstrumentation
- Redline
- DragonWave-X
- E-Band
- CBNG
- Radwin
- CableFree
- ASF
*The Company List Is Indicative
LIST OF TABLES
TABLE 1 GLOBAL MOBILE AND WIRELESS BACKHAUL MARKET BY SERVICE TYPE (USD MILLIONS), 2019-2028
TABLE 2 GLOBAL MOBILE AND WIRELESS BACKHAUL MARKET BY SERVICE TYPE (THOUSAND UNIT), 2019-2028
TABLE 3 GLOBAL MOBILE AND WIRELESS BACKHAUL MARKET BY DEPTH (USD MILLIONS), 2019-2028
TABLE 4 GLOBAL MOBILE AND WIRELESS BACKHAUL MARKET BY DEPTH (THOUSAND UNIT), 2019-2028
TABLE 5 GLOBAL MOBILE AND WIRELESS BACKHAUL MARKET BY REGION (USD MILLIONS), 2019-2028
TABLE 6 GLOBAL MOBILE AND WIRELESS BACKHAUL MARKET BY REGION (THOUSAND UNIT), 2019-2028
TABLE 7 NORTH AMERICA MOBILE AND WIRELESS BACKHAUL MARKET BY COUNTRY (USD MILLIONS), 2019-2028
TABLE 8 NORTH AMERICA MOBILE AND WIRELESS BACKHAUL MARKET BY COUNTRY (THOUSAND UNIT), 2019-2028
TABLE 9 US MOBILE AND WIRELESS BACKHAUL MARKET BY SERVICE TYPE (USD MILLIONS), 2019-2028
TABLE 10 US MOBILE AND WIRELESS BACKHAUL MARKET BY SERVICE TYPE (THOUSAND UNIT), 2019-2028
TABLE 11 US MOBILE AND WIRELESS BACKHAUL MARKET BY DEPTH (USD MILLIONS), 2019-2028
TABLE 12 US MOBILE AND WIRELESS BACKHAUL MARKET BY DEPTH (THOUSAND UNIT), 2019-2028
TABLE 13 US MOBILE AND WIRELESS BACKHAUL MARKET BY STRUCTURE (USD MILLIONS), 2019-2028
TABLE 14 US MOBILE AND WIRELESS BACKHAUL MARKET BY STRUCTURE (THOUSAND UNIT), 2019-2028
TABLE 15 US MOBILE AND WIRELESS BACKHAUL MARKET BY REMOVAL (USD MILLIONS), 2019-2028
TABLE 16 US MOBILE AND WIRELESS BACKHAUL MARKET BY REMOVAL (THOUSAND UNIT), 2019-2028
TABLE 17 CANADA MOBILE AND WIRELESS BACKHAUL MARKET BY SERVICE TYPE (USD MILLIONS), 2019-2028
TABLE 18 CANADA MOBILE AND WIRELESS BACKHAUL MARKET BY SERVICE TYPE (THOUSAND UNIT), 2019-2028
TABLE 19 CANADA MOBILE AND WIRELESS BACKHAUL MARKET BY DEPTH (USD MILLIONS), 2019-2028
TABLE 20 CANADA MOBILE AND WIRELESS BACKHAUL MARKET BY DEPTH (THOUSAND UNIT), 2019-2028
TABLE 21 CANADA MOBILE AND WIRELESS BACKHAUL MARKET BY STRUCTURE (USD MILLIONS), 2019-2028
TABLE 22 CANADA MOBILE AND WIRELESS BACKHAUL MARKET BY STRUCTURE (THOUSAND UNIT), 2019-2028
TABLE 23 CANADA MOBILE AND WIRELESS BACKHAUL MARKET BY REMOVAL (USD MILLIONS), 2019-2028
TABLE 24 CANADA MOBILE AND WIRELESS BACKHAUL MARKET BY REMOVAL (THOUSAND UNIT), 2019-2028
TABLE 25 MEXICO MOBILE AND WIRELESS BACKHAUL MARKET BY SERVICE TYPE (USD MILLIONS), 2019-2028
TABLE 26 MEXICO MOBILE AND WIRELESS BACKHAUL MARKET BY SERVICE TYPE (THOUSAND UNIT), 2019-2028
TABLE 27 MEXICO MOBILE AND WIRELESS BACKHAUL MARKET BY DEPTH (USD MILLIONS), 2019-2028
TABLE 28 MEXICO MOBILE AND WIRELESS BACKHAUL MARKET BY DEPTH (THOUSAND UNIT), 2019-2028
TABLE 29 MEXICO MOBILE AND WIRELESS BACKHAUL MARKET BY STRUCTURE (USD MILLIONS), 2019-2028
TABLE 30 MEXICO MOBILE AND WIRELESS BACKHAUL MARKET BY STRUCTURE (THOUSAND UNIT), 2019-2028
TABLE 31 MEXICO MOBILE AND WIRELESS BACKHAUL MARKET BY REMOVAL (USD MILLIONS), 2019-2028
TABLE 32 MEXICO MOBILE AND WIRELESS BACKHAUL MARKET BY REMOVAL (THOUSAND UNIT), 2019-2028
TABLE 33 SOUTH AMERICA MOBILE AND WIRELESS BACKHAUL MARKET BY COUNTRY (USD MILLIONS), 2019-2028
TABLE 34 SOUTH AMERICA MOBILE AND WIRELESS BACKHAUL MARKET BY COUNTRY (THOUSAND UNIT), 2019-2028
TABLE 35 BRAZIL MOBILE AND WIRELESS BACKHAUL MARKET BY SERVICE TYPE (BRAZILD MILLIONS), 2019-2028
TABLE 36 BRAZIL MOBILE AND WIRELESS BACKHAUL MARKET BY SERVICE TYPE (THOUSAND UNIT), 2019-2028
TABLE 37 BRAZIL MOBILE AND WIRELESS BACKHAUL MARKET BY DEPTH (BRAZILD MILLIONS), 2019-2028
TABLE 38 BRAZIL MOBILE AND WIRELESS BACKHAUL MARKET BY DEPTH (THOUSAND UNIT), 2019-2028
TABLE 39 BRAZIL MOBILE AND WIRELESS BACKHAUL MARKET BY STRUCTURE (BRAZILD MILLIONS), 2019-2028
TABLE 40 BRAZIL MOBILE AND WIRELESS BACKHAUL MARKET BY STRUCTURE (THOUSAND UNIT), 2019-2028
TABLE 41 BRAZIL MOBILE AND WIRELESS BACKHAUL MARKET BY REMOVAL (BRAZILD MILLIONS), 2019-2028
TABLE 42 BRAZIL MOBILE AND WIRELESS BACKHAUL MARKET BY REMOVAL (THOUSAND UNIT), 2019-2028
TABLE 43 ARGENTINA MOBILE AND WIRELESS BACKHAUL MARKET BY SERVICE TYPE (USD MILLIONS), 2019-2028
TABLE 44 ARGENTINA MOBILE AND WIRELESS BACKHAUL MARKET BY SERVICE TYPE (THOUSAND UNIT), 2019-2028
TABLE 45 ARGENTINA MOBILE AND WIRELESS BACKHAUL MARKET BY DEPTH (USD MILLIONS), 2019-2028
TABLE 46 ARGENTINA MOBILE AND WIRELESS BACKHAUL MARKET BY DEPTH (THOUSAND UNIT), 2019-2028
TABLE 47 ARGENTINA MOBILE AND WIRELESS BACKHAUL MARKET BY STRUCTURE (USD MILLIONS), 2019-2028
TABLE 48 ARGENTINA MOBILE AND WIRELESS BACKHAUL MARKET BY STRUCTURE (THOUSAND UNIT), 2019-2028
TABLE 49 ARGENTINA MOBILE AND WIRELESS BACKHAUL MARKET BY REMOVAL (USD MILLIONS), 2019-2028
TABLE 50 ARGENTINA MOBILE AND WIRELESS BACKHAUL MARKET BY REMOVAL (THOUSAND UNIT), 2019-2028
TABLE 51 COLOMBIA MOBILE AND WIRELESS BACKHAUL MARKET BY SERVICE TYPE (USD MILLIONS), 2019-2028
TABLE 52 COLOMBIA MOBILE AND WIRELESS BACKHAUL MARKET BY SERVICE TYPE (THOUSAND UNIT), 2019-2028
TABLE 53 COLOMBIA MOBILE AND WIRELESS BACKHAUL MARKET BY DEPTH (USD MILLIONS), 2019-2028
TABLE 54 COLOMBIA MOBILE AND WIRELESS BACKHAUL MARKET BY DEPTH (THOUSAND UNIT), 2019-2028
TABLE 55 COLOMBIA MOBILE AND WIRELESS BACKHAUL MARKET BY STRUCTURE (USD MILLIONS), 2019-2028
TABLE 56 COLOMBIA MOBILE AND WIRELESS BACKHAUL MARKET BY STRUCTURE (THOUSAND UNIT), 2019-2028
TABLE 57 COLOMBIA MOBILE AND WIRELESS BACKHAUL MARKET BY REMOVAL (USD MILLIONS), 2019-2028
TABLE 58 COLOMBIA MOBILE AND WIRELESS BACKHAUL MARKET BY REMOVAL (THOUSAND UNIT), 2019-2028
TABLE 59 REST OF SOUTH AMERICA MOBILE AND WIRELESS BACKHAUL MARKET BY SERVICE TYPE (USD MILLIONS), 2019-2028
TABLE 60 REST OF SOUTH AMERICA MOBILE AND WIRELESS BACKHAUL MARKET BY SERVICE TYPE (THOUSAND UNIT), 2019-2028
TABLE 61 REST OF SOUTH AMERICA MOBILE AND WIRELESS BACKHAUL MARKET BY DEPTH (USD MILLIONS), 2019-2028
TABLE 62 REST OF SOUTH AMERICA MOBILE AND WIRELESS BACKHAUL MARKET BY DEPTH (THOUSAND UNIT), 2019-2028
TABLE 63 REST OF SOUTH AMERICA MOBILE AND WIRELESS BACKHAUL MARKET BY STRUCTURE (USD MILLIONS), 2019-2028
TABLE 64 REST OF SOUTH AMERICA MOBILE AND WIRELESS BACKHAUL MARKET BY STRUCTURE (THOUSAND UNIT), 2019-2028
TABLE 65 REST OF SOUTH AMERICA MOBILE AND WIRELESS BACKHAUL MARKET BY REMOVAL (USD MILLIONS), 2019-2028
TABLE 66 REST OF SOUTH AMERICA MOBILE AND WIRELESS BACKHAUL MARKET BY REMOVAL (THOUSAND UNIT), 2019-2028
TABLE 67 ASIA PACIFIC MOBILE AND WIRELESS BACKHAUL MARKET BY COUNTRY (USD MILLIONS), 2019-2028
TABLE 68 ASIA PACIFIC MOBILE AND WIRELESS BACKHAUL MARKET BY COUNTRY (THOUSAND UNIT), 2019-2028
TABLE 69 INDIA MOBILE AND WIRELESS BACKHAUL MARKET BY SERVICE TYPE (INDIAD MILLIONS), 2019-2028
TABLE 70 INDIA MOBILE AND WIRELESS BACKHAUL MARKET BY SERVICE TYPE (THOUSAND UNIT), 2019-2028
TABLE 71 INDIA MOBILE AND WIRELESS BACKHAUL MARKET BY DEPTH (INDIAD MILLIONS), 2019-2028
TABLE 72 INDIA MOBILE AND WIRELESS BACKHAUL MARKET BY DEPTH (THOUSAND UNIT), 2019-2028
TABLE 73 INDIA MOBILE AND WIRELESS BACKHAUL MARKET BY STRUCTURE (INDIAD MILLIONS), 2019-2028
TABLE 74 INDIA MOBILE AND WIRELESS BACKHAUL MARKET BY STRUCTURE (THOUSAND UNIT), 2019-2028
TABLE 75 INDIA MOBILE AND WIRELESS BACKHAUL MARKET BY REMOVAL (INDIAD MILLIONS), 2019-2028
TABLE 76 INDIA MOBILE AND WIRELESS BACKHAUL MARKET BY REMOVAL (THOUSAND UNIT), 2019-2028
TABLE 77 CHINA MOBILE AND WIRELESS BACKHAUL MARKET BY SERVICE TYPE (USD MILLIONS), 2019-2028
TABLE 78 CHINA MOBILE AND WIRELESS BACKHAUL MARKET BY SERVICE TYPE (THOUSAND UNIT), 2019-2028
TABLE 79 CHINA MOBILE AND WIRELESS BACKHAUL MARKET BY DEPTH (USD MILLIONS), 2019-2028
TABLE 80 CHINA MOBILE AND WIRELESS BACKHAUL MARKET BY DEPTH (THOUSAND UNIT), 2019-2028
TABLE 81 CHINA MOBILE AND WIRELESS BACKHAUL MARKET BY STRUCTURE (USD MILLIONS), 2019-2028
TABLE 82 CHINA MOBILE AND WIRELESS BACKHAUL MARKET BY STRUCTURE (THOUSAND UNIT), 2019-2028
TABLE 83 CHINA MOBILE AND WIRELESS BACKHAUL MARKET BY REMOVAL (USD MILLIONS), 2019-2028
TABLE 84 CHINA MOBILE AND WIRELESS BACKHAUL MARKET BY REMOVAL (THOUSAND UNIT), 2019-2028
TABLE 85 JAPAN MOBILE AND WIRELESS BACKHAUL MARKET BY SERVICE TYPE (USD MILLIONS), 2019-2028
TABLE 86 JAPAN MOBILE AND WIRELESS BACKHAUL MARKET BY SERVICE TYPE (THOUSAND UNIT), 2019-2028
TABLE 87 JAPAN MOBILE AND WIRELESS BACKHAUL MARKET BY DEPTH (USD MILLIONS), 2019-2028
TABLE 88 JAPAN MOBILE AND WIRELESS BACKHAUL MARKET BY DEPTH (THOUSAND UNIT), 2019-2028
TABLE 89 JAPAN MOBILE AND WIRELESS BACKHAUL MARKET BY STRUCTURE (USD MILLIONS), 2019-2028
TABLE 90 JAPAN MOBILE AND WIRELESS BACKHAUL MARKET BY STRUCTURE (THOUSAND UNIT), 2019-2028
TABLE 91 JAPAN MOBILE AND WIRELESS BACKHAUL MARKET BY REMOVAL (USD MILLIONS), 2019-2028
TABLE 92 JAPAN MOBILE AND WIRELESS BACKHAUL MARKET BY REMOVAL (THOUSAND UNIT), 2019-2028
TABLE 93 SOUTH KOREA MOBILE AND WIRELESS BACKHAUL MARKET BY SERVICE TYPE (USD MILLIONS), 2019-2028
TABLE 94 SOUTH KOREA MOBILE AND WIRELESS BACKHAUL MARKET BY SERVICE TYPE (THOUSAND UNIT), 2019-2028
TABLE 95 SOUTH KOREA MOBILE AND WIRELESS BACKHAUL MARKET BY DEPTH (USD MILLIONS), 2019-2028
TABLE 96 SOUTH KOREA MOBILE AND WIRELESS BACKHAUL MARKET BY DEPTH (THOUSAND UNIT), 2019-2028
TABLE 97 SOUTH KOREA MOBILE AND WIRELESS BACKHAUL MARKET BY STRUCTURE (USD MILLIONS), 2019-2028
TABLE 98 SOUTH KOREA MOBILE AND WIRELESS BACKHAUL MARKET BY STRUCTURE (THOUSAND UNIT), 2019-2028
TABLE 99 SOUTH KOREA MOBILE AND WIRELESS BACKHAUL MARKET BY REMOVAL (USD MILLIONS), 2019-2028
TABLE 100 SOUTH KOREA MOBILE AND WIRELESS BACKHAUL MARKET BY REMOVAL (THOUSAND UNIT), 2019-2028
TABLE 101 AUSTRALIA MOBILE AND WIRELESS BACKHAUL MARKET BY SERVICE TYPE (USD MILLIONS), 2019-2028
TABLE 102 AUSTRALIA MOBILE AND WIRELESS BACKHAUL MARKET BY SERVICE TYPE (THOUSAND UNIT), 2019-2028
TABLE 103 AUSTRALIA MOBILE AND WIRELESS BACKHAUL MARKET BY DEPTH (USD MILLIONS), 2019-2028
TABLE 104 AUSTRALIA MOBILE AND WIRELESS BACKHAUL MARKET BY DEPTH (THOUSAND UNIT), 2019-2028
TABLE 105 AUSTRALIA MOBILE AND WIRELESS BACKHAUL MARKET BY STRUCTURE (USD MILLIONS), 2019-2028
TABLE 106 AUSTRALIA MOBILE AND WIRELESS BACKHAUL MARKET BY STRUCTURE (THOUSAND UNIT), 2019-2028
TABLE 107 AUSTRALIA MOBILE AND WIRELESS BACKHAUL MARKET BY REMOVAL (USD MILLIONS), 2019-2028
TABLE 108 AUSTRALIA MOBILE AND WIRELESS BACKHAUL MARKET BY REMOVAL (THOUSAND UNIT), 2019-2028
TABLE 109 SOUTH EAST ASIA MOBILE AND WIRELESS BACKHAUL MARKET BY SERVICE TYPE (USD MILLIONS), 2019-2028
TABLE 110 SOUTH EAST ASIA MOBILE AND WIRELESS BACKHAUL MARKET BY SERVICE TYPE (THOUSAND UNIT), 2019-2028
TABLE 111 SOUTH EAST ASIA MOBILE AND WIRELESS BACKHAUL MARKET BY DEPTH (USD MILLIONS), 2019-2028
TABLE 112 SOUTH EAST ASIA MOBILE AND WIRELESS BACKHAUL MARKET BY DEPTH (THOUSAND UNIT), 2019-2028
TABLE 113 SOUTH EAST ASIA MOBILE AND WIRELESS BACKHAUL MARKET BY STRUCTURE (USD MILLIONS), 2019-2028
TABLE 114 SOUTH EAST ASIA MOBILE AND WIRELESS BACKHAUL MARKET BY STRUCTURE (THOUSAND UNIT), 2019-2028
TABLE 115 SOUTH EAST ASIA MOBILE AND WIRELESS BACKHAUL MARKET BY REMOVAL (USD MILLIONS), 2019-2028
TABLE 116 SOUTH EAST ASIA MOBILE AND WIRELESS BACKHAUL MARKET BY REMOVAL (THOUSAND UNIT), 2019-2028
TABLE 117 REST OF ASIA PACIFIC MOBILE AND WIRELESS BACKHAUL MARKET BY SERVICE TYPE (USD MILLIONS), 2019-2028
TABLE 118 REST OF ASIA PACIFIC MOBILE AND WIRELESS BACKHAUL MARKET BY SERVICE TYPE (THOUSAND UNIT), 2019-2028
TABLE 119 REST OF ASIA PACIFIC MOBILE AND WIRELESS BACKHAUL MARKET BY DEPTH (USD MILLIONS), 2019-2028
TABLE 120 REST OF ASIA PACIFIC MOBILE AND WIRELESS BACKHAUL MARKET BY DEPTH (THOUSAND UNIT), 2019-2028
TABLE 121 REST OF ASIA PACIFIC MOBILE AND WIRELESS BACKHAUL MARKET BY STRUCTURE (USD MILLIONS), 2019-2028
TABLE 122 REST OF ASIA PACIFIC MOBILE AND WIRELESS BACKHAUL MARKET BY STRUCTURE (THOUSAND UNIT), 2019-2028
TABLE 123 REST OF ASIA PACIFIC MOBILE AND WIRELESS BACKHAUL MARKET BY REMOVAL (USD MILLIONS), 2019-2028
TABLE 124 REST OF ASIA PACIFIC MOBILE AND WIRELESS BACKHAUL MARKET BY REMOVAL (THOUSAND UNIT), 2019-2028
TABLE 125 EUROPE MOBILE AND WIRELESS BACKHAUL MARKET BY COUNTRY (USD MILLIONS), 2019-2028
TABLE 126 EUROPE MOBILE AND WIRELESS BACKHAUL MARKET BY COUNTRY (THOUSAND UNIT), 2019-2028
TABLE 127 GERMANY MOBILE AND WIRELESS BACKHAUL MARKET BY SERVICE TYPE (USD MILLIONS), 2019-2028
TABLE 128 GERMANY MOBILE AND WIRELESS BACKHAUL MARKET BY SERVICE TYPE (THOUSAND UNIT), 2019-2028
TABLE 129 GERMANY MOBILE AND WIRELESS BACKHAUL MARKET BY DEPTH (USD MILLIONS), 2019-2028
TABLE 130 GERMANY MOBILE AND WIRELESS BACKHAUL MARKET BY DEPTH (THOUSAND UNIT), 2019-2028
TABLE 131 GERMANY MOBILE AND WIRELESS BACKHAUL MARKET BY STRUCTURE (USD MILLIONS), 2019-2028
TABLE 132 GERMANY MOBILE AND WIRELESS BACKHAUL MARKET BY STRUCTURE (THOUSAND UNIT), 2019-2028
TABLE 133 GERMANY MOBILE AND WIRELESS BACKHAUL MARKET BY REMOVAL (USD MILLIONS), 2019-2028
TABLE 134 GERMANY MOBILE AND WIRELESS BACKHAUL MARKET BY REMOVAL (THOUSAND UNIT), 2019-2028
TABLE 135 UK MOBILE AND WIRELESS BACKHAUL MARKET BY SERVICE TYPE (USD MILLIONS), 2019-2028
TABLE 136 UK MOBILE AND WIRELESS BACKHAUL MARKET BY SERVICE TYPE (THOUSAND UNIT), 2019-2028
TABLE 137 UK MOBILE AND WIRELESS BACKHAUL MARKET BY DEPTH (USD MILLIONS), 2019-2028
TABLE 138 UK MOBILE AND WIRELESS BACKHAUL MARKET BY DEPTH (THOUSAND UNIT), 2019-2028
TABLE 139 UK MOBILE AND WIRELESS BACKHAUL MARKET BY STRUCTURE (USD MILLIONS), 2019-2028
TABLE 140 UK MOBILE AND WIRELESS BACKHAUL MARKET BY STRUCTURE (THOUSAND UNIT), 2019-2028
TABLE 141 UK MOBILE AND WIRELESS BACKHAUL MARKET BY REMOVAL (USD MILLIONS), 2019-2028
TABLE 142 UK MOBILE AND WIRELESS BACKHAUL MARKET BY REMOVAL (THOUSAND UNIT), 2019-2028
TABLE 143 FRANCE MOBILE AND WIRELESS BACKHAUL MARKET BY SERVICE TYPE (USD MILLIONS), 2019-2028
TABLE 144 FRANCE MOBILE AND WIRELESS BACKHAUL MARKET BY SERVICE TYPE (THOUSAND UNIT), 2019-2028
TABLE 145 FRANCE MOBILE AND WIRELESS BACKHAUL MARKET BY DEPTH (USD MILLIONS), 2019-2028
TABLE 146 FRANCE MOBILE AND WIRELESS BACKHAUL MARKET BY DEPTH (THOUSAND UNIT), 2019-2028
TABLE 147 FRANCE MOBILE AND WIRELESS BACKHAUL MARKET BY STRUCTURE (USD MILLIONS), 2019-2028
TABLE 148 FRANCE MOBILE AND WIRELESS BACKHAUL MARKET BY STRUCTURE (THOUSAND UNIT), 2019-2028
TABLE 149 FRANCE MOBILE AND WIRELESS BACKHAUL MARKET BY REMOVAL (USD MILLIONS), 2019-2028
TABLE 150 FRANCE MOBILE AND WIRELESS BACKHAUL MARKET BY REMOVAL (THOUSAND UNIT), 2019-2028
TABLE 151 ITALY MOBILE AND WIRELESS BACKHAUL MARKET BY SERVICE TYPE (USD MILLIONS), 2019-2028
TABLE 152 ITALY MOBILE AND WIRELESS BACKHAUL MARKET BY SERVICE TYPE (THOUSAND UNIT), 2019-2028
TABLE 153 ITALY MOBILE AND WIRELESS BACKHAUL MARKET BY DEPTH (USD MILLIONS), 2019-2028
TABLE 154 ITALY MOBILE AND WIRELESS BACKHAUL MARKET BY DEPTH (THOUSAND UNIT), 2019-2028
TABLE 155 ITALY MOBILE AND WIRELESS BACKHAUL MARKET BY STRUCTURE (USD MILLIONS), 2019-2028
TABLE 156 ITALY MOBILE AND WIRELESS BACKHAUL MARKET BY STRUCTURE (THOUSAND UNIT), 2019-2028
TABLE 157 ITALY MOBILE AND WIRELESS BACKHAUL MARKET BY REMOVAL (USD MILLIONS), 2019-2028
TABLE 158 ITALY MOBILE AND WIRELESS BACKHAUL MARKET BY REMOVAL (THOUSAND UNIT), 2019-2028
TABLE 159 SPAIN MOBILE AND WIRELESS BACKHAUL MARKET BY SERVICE TYPE (USD MILLIONS), 2019-2028
TABLE 160 SPAIN MOBILE AND WIRELESS BACKHAUL MARKET BY SERVICE TYPE (THOUSAND UNIT), 2019-2028
TABLE 161 SPAIN MOBILE AND WIRELESS BACKHAUL MARKET BY DEPTH (USD MILLIONS), 2019-2028
TABLE 162 SPAIN MOBILE AND WIRELESS BACKHAUL MARKET BY DEPTH (THOUSAND UNIT), 2019-2028
TABLE 163 SPAIN MOBILE AND WIRELESS BACKHAUL MARKET BY STRUCTURE (USD MILLIONS), 2019-2028
TABLE 164 SPAIN MOBILE AND WIRELESS BACKHAUL MARKET BY STRUCTURE (THOUSAND UNIT), 2019-2028
TABLE 165 SPAIN MOBILE AND WIRELESS BACKHAUL MARKET BY REMOVAL (USD MILLIONS), 2019-2028
TABLE 166 SPAIN MOBILE AND WIRELESS BACKHAUL MARKET BY REMOVAL (THOUSAND UNIT), 2019-2028
TABLE 167 RUSSIA MOBILE AND WIRELESS BACKHAUL MARKET BY SERVICE TYPE (USD MILLIONS), 2019-2028
TABLE 168 RUSSIA MOBILE AND WIRELESS BACKHAUL MARKET BY SERVICE TYPE (THOUSAND UNIT), 2019-2028
TABLE 169 RUSSIA MOBILE AND WIRELESS BACKHAUL MARKET BY DEPTH (USD MILLIONS), 2019-2028
TABLE 170 RUSSIA MOBILE AND WIRELESS BACKHAUL MARKET BY DEPTH (THOUSAND UNIT), 2019-2028
TABLE 171 RUSSIA MOBILE AND WIRELESS BACKHAUL MARKET BY STRUCTURE (USD MILLIONS), 2019-2028
TABLE 172 RUSSIA MOBILE AND WIRELESS BACKHAUL MARKET BY STRUCTURE (THOUSAND UNIT), 2019-2028
TABLE 173 RUSSIA MOBILE AND WIRELESS BACKHAUL MARKET BY REMOVAL (USD MILLIONS), 2019-2028
TABLE 174 RUSSIA MOBILE AND WIRELESS BACKHAUL MARKET BY REMOVAL (THOUSAND UNIT), 2019-2028
TABLE 175 REST OF EUROPE MOBILE AND WIRELESS BACKHAUL MARKET BY SERVICE TYPE (USD MILLIONS), 2019-2028
TABLE 176 REST OF EUROPE MOBILE AND WIRELESS BACKHAUL MARKET BY SERVICE TYPE (THOUSAND UNIT), 2019-2028
TABLE 177 REST OF EUROPE MOBILE AND WIRELESS BACKHAUL MARKET BY DEPTH (USD MILLIONS), 2019-2028
TABLE 178 REST OF EUROPE MOBILE AND WIRELESS BACKHAUL MARKET BY DEPTH (THOUSAND UNIT), 2019-2028
TABLE 179 REST OF EUROPE MOBILE AND WIRELESS BACKHAUL MARKET BY STRUCTURE (USD MILLIONS), 2019-2028
TABLE 180 REST OF EUROPE MOBILE AND WIRELESS BACKHAUL MARKET BY STRUCTURE (THOUSAND UNIT), 2019-2028
TABLE 181 REST OF EUROPE MOBILE AND WIRELESS BACKHAUL MARKET BY REMOVAL (USD MILLIONS), 2019-2028
TABLE 182 REST OF EUROPE MOBILE AND WIRELESS BACKHAUL MARKET BY REMOVAL (THOUSAND UNIT), 2019-2028
TABLE 183 MIDDLE EAST & AFRICA MOBILE AND WIRELESS BACKHAUL MARKET BY COUNTRY (USD MILLIONS), 2019-2028
TABLE 184 MIDDLE EAST & AFRICA MOBILE AND WIRELESS BACKHAUL MARKET BY COUNTRY (THOUSAND UNIT), 2019-2028
TABLE 185 UAE MOBILE AND WIRELESS BACKHAUL MARKET BY SERVICE TYPE (UAED MILLIONS), 2019-2028
TABLE 186 UAE MOBILE AND WIRELESS BACKHAUL MARKET BY SERVICE TYPE (THOUSAND UNIT), 2019-2028
TABLE 187 UAE MOBILE AND WIRELESS BACKHAUL MARKET BY DEPTH (UAED MILLIONS), 2019-2028
TABLE 188 UAE MOBILE AND WIRELESS BACKHAUL MARKET BY DEPTH (THOUSAND UNIT), 2019-2028
TABLE 189 UAE MOBILE AND WIRELESS BACKHAUL MARKET BY STRUCTURE (UAED MILLIONS), 2019-2028
TABLE 190 UAE MOBILE AND WIRELESS BACKHAUL MARKET BY STRUCTURE (THOUSAND UNIT), 2019-2028
TABLE 191 UAE MOBILE AND WIRELESS BACKHAUL MARKET BY REMOVAL (UAED MILLIONS), 2019-2028
TABLE 192 UAE MOBILE AND WIRELESS BACKHAUL MARKET BY REMOVAL (THOUSAND UNIT), 2019-2028
TABLE 193 SAUDI ARABIA MOBILE AND WIRELESS BACKHAUL MARKET BY SERVICE TYPE (USD MILLIONS), 2019-2028
TABLE 194 SAUDI ARABIA MOBILE AND WIRELESS BACKHAUL MARKET BY SERVICE TYPE (THOUSAND UNIT), 2019-2028
TABLE 195 SAUDI ARABIA MOBILE AND WIRELESS BACKHAUL MARKET BY DEPTH (USD MILLIONS), 2019-2028
TABLE 196 SAUDI ARABIA MOBILE AND WIRELESS BACKHAUL MARKET BY DEPTH (THOUSAND UNIT), 2019-2028
TABLE 197 SAUDI ARABIA MOBILE AND WIRELESS BACKHAUL MARKET BY STRUCTURE (USD MILLIONS), 2019-2028
TABLE 198 SAUDI ARABIA MOBILE AND WIRELESS BACKHAUL MARKET BY STRUCTURE (THOUSAND UNIT), 2019-2028
TABLE 199 SAUDI ARABIA MOBILE AND WIRELESS BACKHAUL MARKET BY REMOVAL (USD MILLIONS), 2019-2028
TABLE 200 SAUDI ARABIA MOBILE AND WIRELESS BACKHAUL MARKET BY REMOVAL (THOUSAND UNIT), 2019-2028
TABLE 201 SOUTH AFRICA MOBILE AND WIRELESS BACKHAUL MARKET BY SERVICE TYPE (USD MILLIONS), 2019-2028
TABLE 202 SOUTH AFRICA MOBILE AND WIRELESS BACKHAUL MARKET BY SERVICE TYPE (THOUSAND UNIT), 2019-2028
TABLE 203 SOUTH AFRICA MOBILE AND WIRELESS BACKHAUL MARKET BY DEPTH (USD MILLIONS), 2019-2028
TABLE 204 SOUTH AFRICA MOBILE AND WIRELESS BACKHAUL MARKET BY DEPTH (THOUSAND UNIT), 2019-2028
TABLE 205 SOUTH AFRICA MOBILE AND WIRELESS BACKHAUL MARKET BY STRUCTURE (USD MILLIONS), 2019-2028
TABLE 206 SOUTH AFRICA MOBILE AND WIRELESS BACKHAUL MARKET BY STRUCTURE (THOUSAND UNIT), 2019-2028
TABLE 207 SOUTH AFRICA MOBILE AND WIRELESS BACKHAUL MARKET BY REMOVAL (USD MILLIONS), 2019-2028
TABLE 208 SOUTH AFRICA MOBILE AND WIRELESS BACKHAUL MARKET BY REMOVAL (THOUSAND UNIT), 2019-2028
TABLE 209 REST OF MIDDLE EAST & AFRICA MOBILE AND WIRELESS BACKHAUL MARKET BY SERVICE TYPE (USD MILLIONS), 2019-2028
TABLE 210 REST OF MIDDLE EAST & AFRICA MOBILE AND WIRELESS BACKHAUL MARKET BY SERVICE TYPE (THOUSAND UNIT), 2019-2028
TABLE 211 REST OF MIDDLE EAST & AFRICA MOBILE AND WIRELESS BACKHAUL MARKET BY DEPTH (USD MILLIONS), 2019-2028
TABLE 212 REST OF MIDDLE EAST & AFRICA MOBILE AND WIRELESS BACKHAUL MARKET BY DEPTH (THOUSAND UNIT), 2019-2028
TABLE 213 REST OF MIDDLE EAST & AFRICA MOBILE AND WIRELESS BACKHAUL MARKET BY STRUCTURE (USD MILLIONS), 2019-2028
TABLE 214 REST OF MIDDLE EAST & AFRICA MOBILE AND WIRELESS BACKHAUL MARKET BY STRUCTURE (THOUSAND UNIT), 2019-2028
TABLE 215 REST OF MIDDLE EAST & AFRICA MOBILE AND WIRELESS BACKHAUL MARKET BY REMOVAL (USD MILLIONS), 2019-2028
TABLE 216 REST OF MIDDLE EAST & AFRICA MOBILE AND WIRELESS BACKHAUL MARKET BY REMOVAL (THOUSAND UNIT), 2019-2028
LIST OF FIGURES
FIGURE 1 MARKET DYNAMICS
FIGURE 2 MARKET SEGMENTATION
FIGURE 3 REPORT TIMELINES: YEARS CONSIDERED
FIGURE 4 DATA TRIANGULATION
FIGURE 5 BOTTOM-UP APPROACH
FIGURE 6 TOP-DOWN APPROACH
FIGURE 7 RESEARCH FLOW
FIGURE 8 GLOBAL MOBILE AND WIRELESS BACKHAUL MARKET BY SERVICE TYPE, USD MILLION, 2019-2028
FIGURE 9 GLOBAL MOBILE AND WIRELESS BACKHAUL MARKET BY REGION, USD MILLION, 2019-2028
FIGURE 10 PORTER’S FIVE FORCES MODEL
FIGURE 11 GLOBAL MOBILE AND WIRELESS BACKHAUL MARKET BY SERVICE TYPE, USD MILLION, 2019-2028
FIGURE 12 GLOBAL MOBILE AND WIRELESS BACKHAUL MARKET BY DEPTH, USD MILLION, 2019-2028
FIGURE 13 GLOBAL MOBILE AND WIRELESS BACKHAUL MARKET BY STRUCTURE, USD MILLION, 2019-2028
FIGURE 14 GLOBAL MOBILE AND WIRELESS BACKHAUL MARKET BY REMOVAL, USD MILLION, 2019-2028
FIGURE 15 GLOBAL MOBILE AND WIRELESS BACKHAUL MARKET BY REGION, USD MILLION, 2019-2028
FIGURE 16 MOBILE AND WIRELESS BACKHAUL MARKET BY REGION 2020
FIGURE 17 MARKET SHARE ANALYSIS
FIGURE 18 ERICSSOM: COMPANY SNAPSHOT
FIGURE 19 HUAWEI: COMPANY SNAPSHOT
FIGURE 20 NOKIA: COMPANY SNAPSHOT
FIGURE 21 NECCORPORATION: COMPANY SNAPSHOT
FIGURE 22 ZTE: COMPANY SNAPSHOT
FIGURE 23 FUJITSU: COMPANY SNAPSHOT
FIGURE 24 BROADCOM: COMPANY SNAPSHOT
FIGURE 25 CERAGON: COMPANY SNAPSHOT
FIGURE 26 AVIAT: COMPANY SNAPSHOT
FIGURE 27 SIAE: COMPANY SNAPSHOT
DOWNLOAD FREE SAMPLE REPORT
License Type
SPEAK WITH OUR ANALYST
Want to know more about the report or any specific requirement?
WANT TO CUSTOMIZE THE REPORT?
Our Clients Speak
We asked them to research ‘ Equipment market’ all over the world, and their whole arrangement was helpful to us. thehealthanalytics.com insightful analysis and reports contributed to our current analysis and in creating a future strategy. Besides, the te
Yosuke Mitsui
Senior Associate Construction Equipment Sales & Marketing
We asked them to research ‘Equipment market’ all over the world, and their whole arrangement was helpful to us. thehealthanalytics.com insightful analysis and reports contributed to our current analysis and in creating a future strategy. Besides, the te


