

Base Year Value ()
x.x %
x.x %
CAGR ()
x.x %
x.x %
Forecast Year Value ()
x.x %
x.x %
Historical Data Period
Largest Region
Forecast Period
High Dynamic Range Market By Product Type (Capturing Devices, Display Devices), Type (HDR10, HDR10+, Hybrid Log-Gamma, Dolby Vision, 4K), Application (Video Streaming, Entertainment, Security And Surveillance, Gaming) And Region, Global Trends And Forecast From 2022 To 2029
Instant access to hundreds of data points and trends
- Market estimates from 2014-2029
- Competitive analysis, industry segmentation, financial benchmarks
- Incorporates SWOT, Porter's Five Forces and risk management frameworks
- PDF report or online database with Word, Excel and PowerPoint export options
- 100% money back guarantee
High Dynamic Range Market Overview
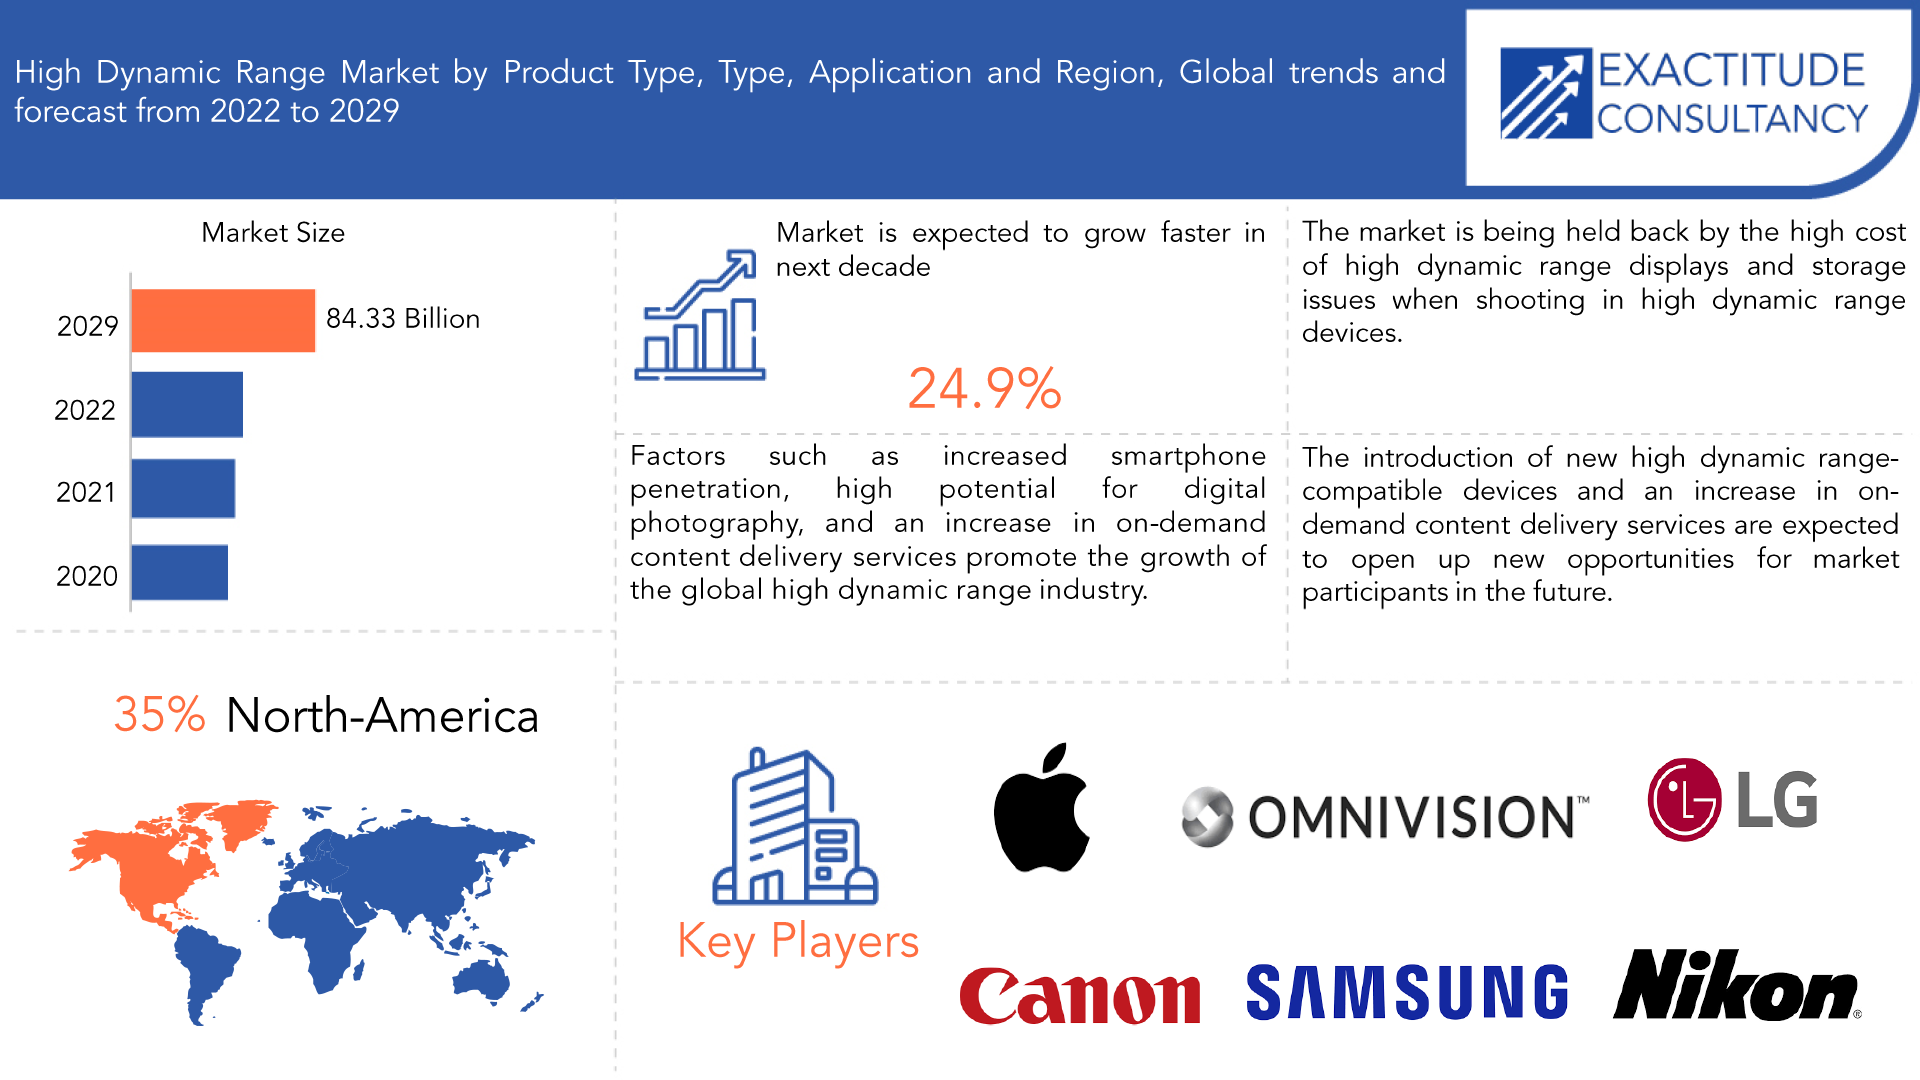
The high dynamic range market is expected to grow at 24.9% CAGR from 2022 to 2029. It is expected to reach above USD 84.33 billion by 2029 from USD 11.4 billion in 2020.
High dynamic range (HDR) is a post-processing technique used in imaging and photography to increase the "dynamic range" (ratio of light and dark) in a photograph to mimic what the human eye can see. The human eye can see details even when the scene contains both light and dark areas, whereas a camera will frequently have a high contrast between these areas, resulting in darker shadowy areas with less detail because they are primarily dark. By adding detail to dark areas, HDR mimics how our eyes perceive dynamic range. This is accomplished by combining photos of the same subject taken at various exposures.
An HDR image is typically created by taking three images of the same scene at three different shutter speeds. Based on the amount of light that passed through the lens, the image is bright, medium, or dark. The image sensor then stitches together all of the photos to create the final image. This contributes to the creation of an image similar to what the human eye would see. HDR images are created by taking either a single image or a series of images, combining them, and adjusting the contrast ratios with a single aperture and shutter speed.
| ATTRIBUTE | DETAILS |
| Study period | 2020-2029 |
| Base year | 2021 |
| Estimated year | 2022 |
| Forecasted year | 2022-2029 |
| Historical period | 2018-2020 |
| Unit | Value (USD Billion) |
| Segmentation | By product type, By type, By application, By Region |
|
By Product Type |
|
|
By Type |
|
| By Application |
|
|
By Region |
|
Factors such as increased smartphone penetration, high potential for digital photography, and an increase in on-demand content delivery services promote the growth of the global high dynamic range industry.
The rising traction in the entertainment sector, which has been at the forefront of incorporating HDR technology, is driving growth. From 2017 to 2021, the demand for high dynamic range equipment increased significantly, and this trend is expected to continue between 2022 and 2029. The market for high dynamic range video cameras is also expanding as there is a greater demand for powerful cameras for use in photography and media outlets. This pattern is a significant driver of market expansion.
The market is being held back by the high cost of high dynamic range displays and storage issues when shooting in high dynamic range devices. One of the major drawbacks of this technique is that high dynamic range photographs require a lot of storage space on devices. It is also extremely difficult to use HDR technology to capture images without the use of a tripod and bracketing. To create the final product of such high dynamic range images, a variety of software is frequently required. The requirement for additional processing and refinement has the potential to stifle market growth.
The HDR market is being shaped by HDR technology for 3D rendering. HDR can be used in a variety of applications thanks to 3D rendering. 3D rendering is the process of converting a 3D model into a 2D image for display on a screen. In addition, the introduction of new high dynamic range-compatible devices and an increase in on-demand content delivery services are expected to open up new opportunities for market participants in the future.
During the Covid-19 pandemic, there was an increase in demand for video streaming and entertainment, which boosted the demand for high dynamic range solutions. However, the pandemic had a negative impact on the market due to a disrupted supply chain and a drop in display production. Furthermore, the market was hampered by a lack of logistics support, quarantine procedures, and labor.
[caption id="attachment_21330" align="aligncenter" width="1920"]
Frequently Asked Questions
What is the expected CAGR in terms of revenue for the global high dynamic range market over the forecast period (2020–2029)?
The global high dynamic range market revenue is projected to expand at a CAGR of 24.9% during the forecast period.
What was the global high dynamic range market valued at in 2020?
The global high dynamic range market was valued at USD 11.4 billion in 2020.
Who are the key players in the high dynamic range market?
Some key players operating in the high dynamic range market include Apple, Inc., Canon, Nikon Corporation, Samsung Electronics Co., Ltd., LG Display Co., Ltd., Omnivision Technologies, Olympus Corp., Sony Corporation, Fujifilm Holding Corporation, Casio Computer Co., Ltd.
What are the factors driving the high dynamic range market?
Rising Adoption of Smartphones are driving the market in coming years, however, a shortage of stable contracts, storage and other problems while shooting in HDR growth of the market.
What are the different segments of the global high dynamic range market?
The global high dynamic range market is divided into product type, type, application, and region.
Which region will lead the global high dynamic range market?
North America region will lead the global high dynamic range Market during the forecast period 2022 to 2029.
High Dynamic Range Market Segment Analysis
The high dynamic range market is segmented based on platform, range, frequency band, and region, global trends and forecast. By product type the market is bifurcated into capturing devices, display devices; by type the market is bifurcated into HDR10, HDR10+, hybrid log-gamma, Dolby vision, 4K,; by application the market is bifurcated into video streaming, entertainment, security & surveillance, gaming.The display devices segment noticed the most growth in the market, owing to the high demand for advanced display systems that provide improved and immersive viewing experiences. These displays are intended to project a wider range of color levels and brightness, resulting in a more vivid experience.
With more than one-third of the global high dynamic range market, the HDR 10+ segment had the largest market share by type in 2020. This is so that the image appears more realistically because it uses dynamic metadata rather than static metadata. However, the Dolby Vision segment is expected to grow at the fastest rate of 28.2% during the forecast period, as it offers several advantages over HDR formats.
In terms of application, the entertainment segment dominated in 2020, accounting for nearly half of the global high dynamic range industry. However, the video streaming segment is expected to grow at the fastest rate of 24.9% between 2021 and 2029, owing to increased demand for high dynamic range video streaming, which provides higher contrast and precise & detailed shadows with greater clarity.
[caption id="attachment_21332" align="aligncenter" width="1920"]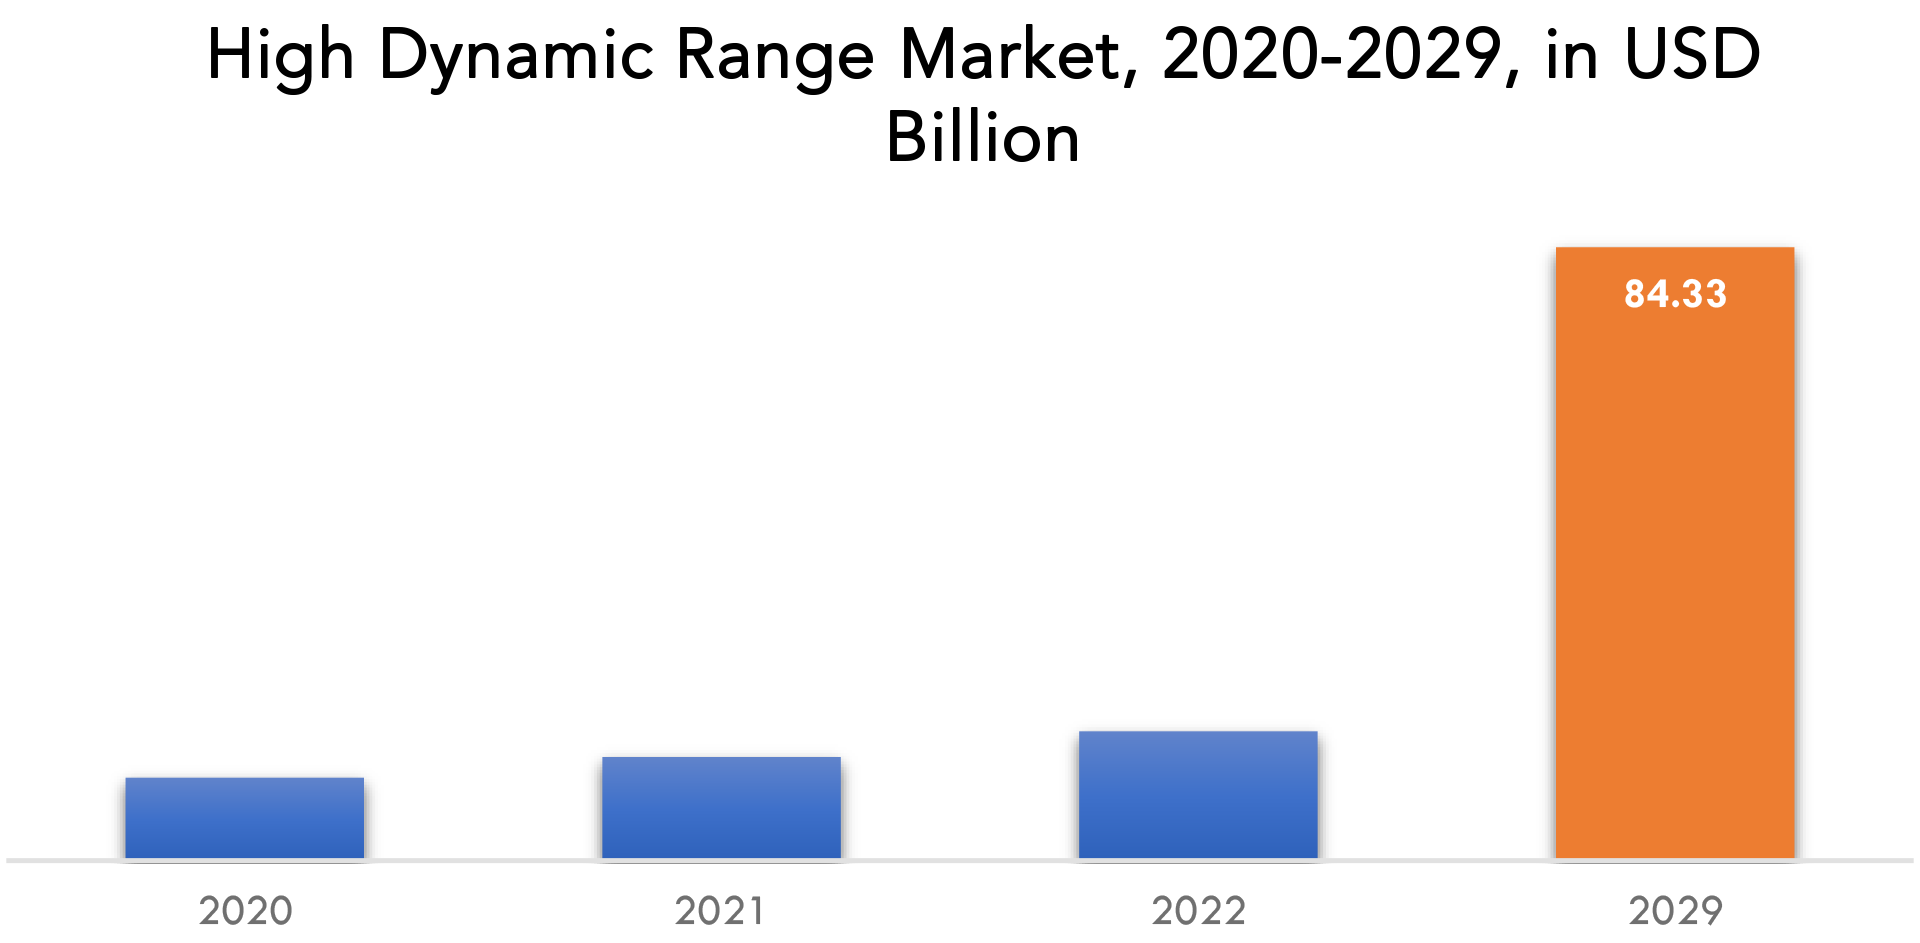
High Dynamic Range Market Key Players
The high dynamic range market key players include Apple, Inc., Canon, Nikon Corporation, Samsung Electronics Co., Ltd., LG Display Co., Ltd., Omnivision Technologies, Olympus Corp., Sony Corporation, Fujifilm Holding Corporation, Casio Computer Co., Ltd., and others. Recent Developments:- 14 March 2023: Apple launched Shop with a Specialist over Video, a new live shopping experience on apple.com for customers in the U.S. Shop with a Specialist over Video connects customers looking to purchase iPhone with a retail team member via a safe and secure, one-way video shopping session.
- 07 March 2023: Apple announced a new yellow iPhone 14 and iPhone 14 Plus, adding even more color choices to the lineup this spring
Who Should Buy? Or Key Stakeholders
- Scientific Research & Development
- End-users Companies
- Investors
- Government Organization
- Regulatory Authorities
- Others
High Dynamic Range Market Regional Analysis
The high dynamic range market by region includes North America, Asia-Pacific (APAC), Europe, South America, and Middle East & Africa (MEA).- North America: includes the US, Canada, Mexico, and Rest of North America
- Asia Pacific: includes China, Japan, South Korea, India, Australia, and Rest of APAC
- Europe: includes UK, Germany, France, Italy, Spain, Russia, and Rest of Europe
- South America: includes Brazil, Argentina, and Rest of South America
- Middle East & Africa: includes UAE, South Africa, Saudi Arabia and Rest of MEA
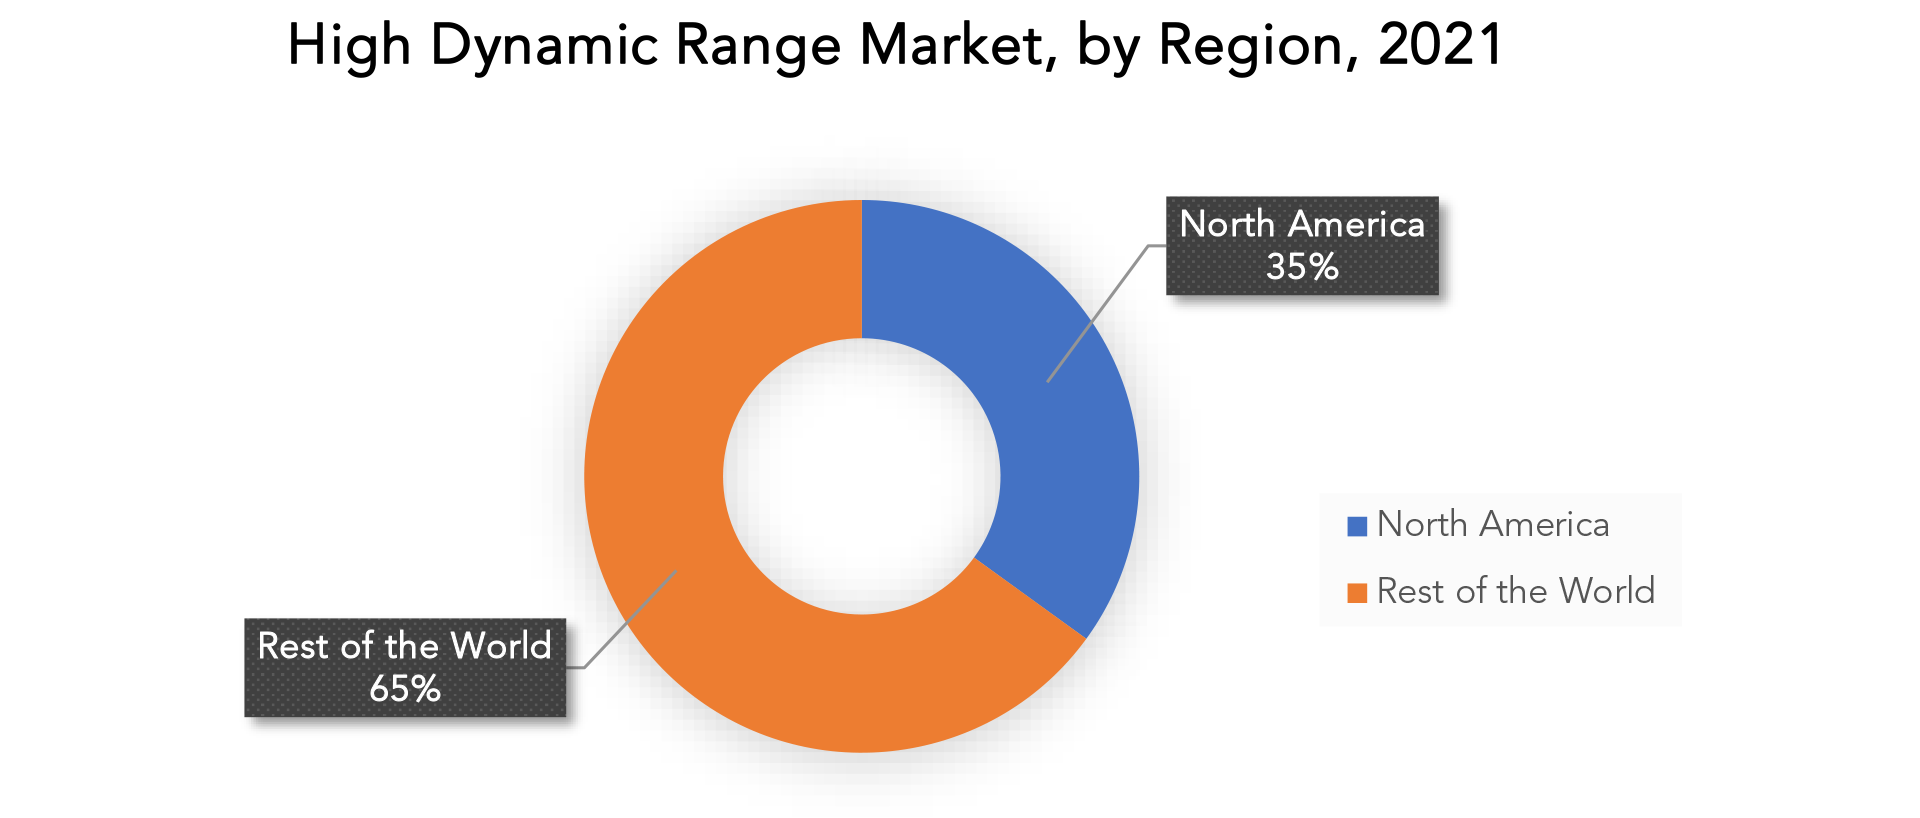
In 2021, North America will have the largest revenue share in the high dynamic range market. This is due to the availability of multiple video streaming software suppliers in the United States, as well as increased company awareness of the benefits of video streaming solutions. Furthermore, rising investments in a wide range of technologies such as IoT, AI, AR, big data, and VR, as well as an increase in the use of cloud services, are expected to drive the regional video streaming software market during the forecast period.
APAC is expected to grow at the fastest CAGR of 19.16% between 2021 and 2026, owing to a growing consumer base in the entertainment industry and rising disposable income. According to a recent report published in January 2021, the total number of ASIAN paid subscribers to Netflix reached 25.5 million, a 64% increase over the previous year, and the region became the second largest contributor in terms of subscribers.
Key Market Segments: High Dynamic Range Market
High Dynamic Range Market By Product Type, 2020-2029, (USD Billion)- Capturing Devices
- Display Devices
- HDR10
- HDR10+
- Hybrid Log-Gamma
- Dolby Vision
- 4k
- Video Streaming
- Entertainment
- Security And Surveillance
- Gaming
- North America
- Asia Pacific
- Europe
- South America
- Middle East And Africa
Exactitude Consultancy Services Key Objectives:
- Increasing sales and market share
- Developing new technology
- Improving profitability
- Entering new markets
- Enhancing brand reputation
Key Question Answered
- What is the expected growth rate of the high dynamic range market over the next 7 years?
- Who are the major players in the high dynamic range market and what is their market share?
- What are the end-user industries driving demand for market and what is their outlook?
- What are the opportunities for growth in emerging markets such as Asia-pacific, Middle East, and Africa?
- How is the economic environment affecting the high dynamic range market, including factors such as interest rates, inflation, and exchange rates?
- What is the expected impact of government policies and regulations on the high dynamic range market?
- What is the current and forecasted size and growth rate of the global high dynamic range market?
- What are the key drivers of growth in the high dynamic range market?
- Who are the major players in the market and what is their market share?
- What are the distribution channels and supply chain dynamics in the high dynamic range market?
- What are the technological advancements and innovations in the high dynamic range market and their impact on product development and growth?
- What are the regulatory considerations and their impact on the market?
- What are the challenges faced by players in the high dynamic range market and how are they addressing these challenges?
- What are the opportunities for growth and expansion in the high dynamic range market?
- What are the service offerings and specifications of leading players in the market?
- INTRODUCTION
- MARKET DEFINITION
- MARKET SEGMENTATION
- RESEARCH TIMELINES
- ASSUMPTIONS AND LIMITATIONS
- RESEARCH METHODOLOGY
- DATA MINING
- SECONDARY RESEARCH
- PRIMARY RESEARCH
- SUBJECT-MATTER EXPERTS’ ADVICE
- QUALITY CHECKS
- FINAL REVIEW
- DATA TRIANGULATION
- BOTTOM-UP APPROACH
- TOP-DOWN APPROACH
- RESEARCH FLOW
- DATA SOURCES
- DATA MINING
- EXECUTIVE SUMMARY
- MARKET OVERVIEW
- GLOBAL HIGH DYNAMIC RANGE MARKET OUTLOOK
- MARKET DRIVERS
- MARKET RESTRAINTS
- MARKET OPPORTUNITIES
- IMPACT OF COVID-19 ON HIGH DYNAMIC RANGE MARKET
- PORTER’S FIVE FORCES MODEL
- THREAT FROM NEW ENTRANTS
- THREAT FROM SUBSTITUTES
- BARGAINING POWER OF SUPPLIERS
- BARGAINING POWER OF CUSTOMERS
- DEGREE OF COMPETITION
- INDUSTRY VALUE CHAIN ANALYSIS
- GLOBAL HIGH DYNAMIC RANGE MARKET OUTLOOK
- GLOBAL HIGH DYNAMIC RANGE MARKET BY PRODUCT TYPE (USD BILLION), 2020-2029
- CAPTURING DEVICES
- DISPLAY DEVICES
- GLOBAL HIGH DYNAMIC RANGE MARKET BY TYPE (USD BILLION), 2020-2029
- HDR10
- HDR10+
- HYBRID LOG-GAMMA
- DOLBY VISION
- 4K
- GLOBAL HIGH DYNAMIC RANGE MARKET BY APPLICATION (USD BILLION), 2020-2029
- VIDEO STREAMING
- ENTERTAINMENT
- SECURITY & SURVEILLANCE
- GAMING
- GLOBAL HIGH DYNAMIC RANGE MARKET BY REGION (USD BILLION), 2020-2029
- NORTH AMERICA
- US
- CANADA
- MEXICO
- SOUTH AMERICA
- BRAZIL
- ARGENTINA
- COLOMBIA
- REST OF SOUTH AMERICA
- EUROPE
- GERMANY
- UK
- FRANCE
- ITALY
- SPAIN
- RUSSIA
- REST OF EUROPE
- ASIA PACIFIC
- INDIA
- CHINA
- JAPAN
- SOUTH KOREA
- AUSTRALIA
- REST OF ASIA PACIFIC
- MIDDLE EAST AND AFRICA
- UAE
- SAUDI ARABIA
- SOUTH AFRICA
- REST OF MIDDLE EAST AND AFRICA
- NORTH AMERICA
- COMPANY PROFILES* (BUSINESS OVERVIEW, COMPANY SNAPSHOT, PRODUCTS OFFERED, RECENT DEVELOPMENTS)
- APPLE, INC.
- CANON
- NIKON CORPORATION
- SAMSUNG ELECTRONICS CO., LTD.
- LG DISPLAY CO., LTD.
- OMNIVISION TECHNOLOGIES
- OLYMPUS CORP.
- SONY CORPORATION
- FUJIFILM HOLDING CORPORATION
- CASIO COMPUTER CO., LTD. *THE COMPANY LIST IS INDICATIVE
LIST OF TABLES
TABLE 1 GLOBAL HIGH DYNAMIC RANGE MARKET BY PRODUCT TYPE (USD BILLION), 2020-2029
TABLE 2 GLOBAL HIGH DYNAMIC RANGE MARKET BY TYPE (USD BILLION), 2020-2029
TABLE 3 GLOBAL HIGH DYNAMIC RANGE MARKET BY APPLICATION (USD BILLION), 2020-2029
TABLE 4 GLOBAL HIGH DYNAMIC RANGE MARKET BY REGION (USD BILLION), 2020-2029
TABLE 5 NORTH AMERICA HIGH DYNAMIC RANGE MARKET BY PRODUCT TYPE (USD BILLION), 2020-2029
TABLE 6 NORTH AMERICA HIGH DYNAMIC RANGE MARKET BY TYPE (USD BILLION), 2020-2029
TABLE 7 NORTH AMERICA HIGH DYNAMIC RANGE MARKET BY APPLICATION (USD BILLION), 2020-2029
TABLE 8 NORTH AMERICA HIGH DYNAMIC RANGE MARKET BY COUNTRY (USD BILLION), 2020-2029
TABLE 9 US HIGH DYNAMIC RANGE MARKET BY PRODUCT TYPE (USD BILLION), 2020-2029
TABLE 10 US HIGH DYNAMIC RANGE MARKET BY TYPE (USD BILLION), 2020-2029
TABLE 11 US HIGH DYNAMIC RANGE MARKET BY APPLICATION (USD BILLION), 2020-2029
TABLE 12 CANADA HIGH DYNAMIC RANGE MARKET BY PRODUCT TYPE (BILLION), 2020-2029
TABLE 13 CANADA HIGH DYNAMIC RANGE MARKET BY TYPE (USD BILLION), 2020-2029
TABLE 14 CANADA HIGH DYNAMIC RANGE MARKET BY APPLICATION (USD BILLION), 2020-2029
TABLE 15 MEXICO HIGH DYNAMIC RANGE MARKET BY PRODUCT TYPE (USD BILLION), 2020-2029
TABLE 16 MEXICO HIGH DYNAMIC RANGE MARKET BY TYPE (USD BILLION), 2020-2029
TABLE 17 MEXICO HIGH DYNAMIC RANGE MARKET BY APPLICATION (USD BILLION), 2020-2029
TABLE 18 REST OF NORTH AMERICA HIGH DYNAMIC RANGE MARKET BY PRODUCT TYPE (USD BILLION), 2020-2029
TABLE 19 REST OF NORTH AMERICA HIGH DYNAMIC RANGE MARKET BY TYPE (USD BILLION), 2020-2029
TABLE 20 REST OF NORTH AMERICA HIGH DYNAMIC RANGE MARKET BY APPLICATION (USD BILLION), 2020-2029
TABLE 21 SOUTH AMERICA HIGH DYNAMIC RANGE MARKET BY PRODUCT TYPE (USD BILLION), 2020-2029
TABLE 22 SOUTH AMERICA HIGH DYNAMIC RANGE MARKET BY TYPE (USD BILLION), 2020-2029
TABLE 23 SOUTH AMERICA HIGH DYNAMIC RANGE MARKET BY APPLICATION (USD BILLION), 2020-2029
TABLE 24 SOUTH AMERICA HIGH DYNAMIC RANGE MARKET BY COUNTRY (USD BILLION), 2020-2029
TABLE 25 BRAZIL HIGH DYNAMIC RANGE MARKET BY PRODUCT TYPE (USD BILLION), 2020-2029
TABLE 26 BRAZIL HIGH DYNAMIC RANGE MARKET BY TYPE (USD BILLION), 2020-2029
TABLE 27 BRAZIL HIGH DYNAMIC RANGE MARKET BY APPLICATION (USD BILLION), 2020-2029
TABLE 28 ARGENTINA HIGH DYNAMIC RANGE MARKET BY PRODUCT TYPE (USD BILLION), 2020-2029
TABLE 29 ARGENTINA HIGH DYNAMIC RANGE MARKET BY TYPE (USD BILLION), 2020-2029
TABLE 30 ARGENTINA HIGH DYNAMIC RANGE MARKET BY APPLICATION (USD BILLION), 2020-2029
TABLE 31 COLOMBIA HIGH DYNAMIC RANGE MARKET BY PRODUCT TYPE (USD BILLION), 2020-2029
TABLE 32 COLOMBIA HIGH DYNAMIC RANGE MARKET BY TYPE (USD BILLION), 2020-2029
TABLE 33 COLOMBIA HIGH DYNAMIC RANGE MARKET BY APPLICATION (USD BILLION), 2020-2029
TABLE 34 REST OF SOUTH AMERICA HIGH DYNAMIC RANGE MARKET BY PRODUCT TYPE (USD BILLION), 2020-2029
TABLE 35 REST OF SOUTH AMERICA HIGH DYNAMIC RANGE MARKET BY TYPE (USD BILLION), 2020-2029
TABLE 36 REST OF SOUTH AMERICA HIGH DYNAMIC RANGE MARKET BY APPLICATION (USD BILLION), 2020-2029
TABLE 37 ASIA-PACIFIC HIGH DYNAMIC RANGE MARKET BY PRODUCT TYPE (USD BILLION), 2020-2029
TABLE 38 ASIA-PACIFIC HIGH DYNAMIC RANGE MARKET BY TYPE (USD BILLION), 2020-2029
TABLE 39 ASIA-PACIFIC HIGH DYNAMIC RANGE MARKET BY APPLICATION (USD BILLION), 2020-2029
TABLE 40 ASIA-PACIFIC HIGH DYNAMIC RANGE MARKET BY COUNTRY (USD BILLION), 2020-2029
TABLE 41 INDIA HIGH DYNAMIC RANGE MARKET BY PRODUCT TYPE (USD BILLION), 2020-2029
TABLE 42 INDIA HIGH DYNAMIC RANGE MARKET BY TYPE (USD BILLION), 2020-2029
TABLE 43 INDIA HIGH DYNAMIC RANGE MARKET BY APPLICATION (USD BILLION), 2020-2029
TABLE 44 CHINA HIGH DYNAMIC RANGE MARKET BY PRODUCT TYPE (USD BILLION), 2020-2029
TABLE 45 CHINA HIGH DYNAMIC RANGE MARKET BY TYPE (USD BILLION), 2020-2029
TABLE 46 CHINA HIGH DYNAMIC RANGE MARKET BY APPLICATION (USD BILLION), 2020-2029
TABLE 47 JAPAN HIGH DYNAMIC RANGE MARKET BY PRODUCT TYPE (USD BILLION), 2020-2029
TABLE 48 JAPAN HIGH DYNAMIC RANGE MARKET BY TYPE (USD BILLION), 2020-2029
TABLE 49 JAPAN HIGH DYNAMIC RANGE MARKET BY APPLICATION (USD BILLION), 2020-2029
TABLE 50 SOUTH KOREA HIGH DYNAMIC RANGE MARKET BY PRODUCT TYPE (USD BILLION), 2020-2029
TABLE 51 SOUTH KOREA HIGH DYNAMIC RANGE MARKET BY TYPE (USD BILLION), 2020-2029
TABLE 52 SOUTH KOREA HIGH DYNAMIC RANGE MARKET BY APPLICATION (USD BILLION), 2020-2029
TABLE 53 AUSTRALIA HIGH DYNAMIC RANGE MARKET BY PRODUCT TYPE (USD BILLION), 2020-2029
TABLE 54 AUSTRALIA HIGH DYNAMIC RANGE MARKET BY TYPE (USD BILLION), 2020-2029
TABLE 55 AUSTRALIA HIGH DYNAMIC RANGE MARKET BY APPLICATION (USD BILLION), 2020-2029
TABLE 56 REST OF ASIA PACIFIC HIGH DYNAMIC RANGE MARKET BY PRODUCT TYPE (USD BILLION), 2020-2029
TABLE 57 REST OF ASIA PACIFIC HIGH DYNAMIC RANGE MARKET BY TYPE (USD BILLION), 2020-2029
TABLE 58 REST OF ASIA PACIFIC HIGH DYNAMIC RANGE MARKET BY APPLICATION (USD BILLION), 2020-2029
TABLE 59 EUROPE HIGH DYNAMIC RANGE MARKET BY PRODUCT TYPE (USD BILLION), 2020-2029
TABLE 60 EUROPE HIGH DYNAMIC RANGE MARKET BY TYPE (USD BILLION), 2020-2029
TABLE 61 EUROPE HIGH DYNAMIC RANGE MARKET BY APPLICATION (USD BILLION), 2020-2029
TABLE 62 EUROPE HIGH DYNAMIC RANGE MARKET BY COUNTRY (USD BILLION), 2020-2029
TABLE 63 GERMANY HIGH DYNAMIC RANGE MARKET BY PRODUCT TYPE (USD BILLION), 2020-2029
TABLE 64 GERMANY HIGH DYNAMIC RANGE MARKET BY TYPE (USD BILLION), 2020-2029
TABLE 65 GERMANY HIGH DYNAMIC RANGE MARKET BY APPLICATION (USD BILLION), 2020-2029
TABLE 66 UK HIGH DYNAMIC RANGE MARKET BY PRODUCT TYPE (USD BILLION), 2020-2029
TABLE 67 UK HIGH DYNAMIC RANGE MARKET BY TYPE (USD BILLION), 2020-2029
TABLE 68 UK HIGH DYNAMIC RANGE MARKET BY APPLICATION (USD BILLION), 2020-2029
TABLE 69 FRANCE HIGH DYNAMIC RANGE MARKET BY PRODUCT TYPE (USD BILLION), 2020-2029
TABLE 70 FRANCE HIGH DYNAMIC RANGE MARKET BY TYPE (USD BILLION), 2020-2029
TABLE 71 FRANCE HIGH DYNAMIC RANGE MARKET BY APPLICATION (USD BILLION), 2020-2029
TABLE 72 ITALY HIGH DYNAMIC RANGE MARKET BY PRODUCT TYPE (USD BILLION), 2020-2029
TABLE 73 ITALY HIGH DYNAMIC RANGE MARKET BY TYPE (USD BILLION), 2020-2029
TABLE 74 ITALY HIGH DYNAMIC RANGE MARKET BY APPLICATION (USD BILLION), 2020-2029
TABLE 75 SPAIN HIGH DYNAMIC RANGE MARKET BY PRODUCT TYPE (USD BILLION), 2020-2029
TABLE 76 SPAIN HIGH DYNAMIC RANGE MARKET BY TYPE (USD BILLION), 2020-2029
TABLE 77 SPAIN HIGH DYNAMIC RANGE MARKET BY APPLICATION (USD BILLION), 2020-2029
TABLE 78 RUSSIA HIGH DYNAMIC RANGE MARKET BY PRODUCT TYPE (USD BILLION), 2020-2029
TABLE 79 RUSSIA HIGH DYNAMIC RANGE MARKET BY TYPE (USD BILLION), 2020-2029
TABLE 80 RUSSIA HIGH DYNAMIC RANGE MARKET BY APPLICATION (USD BILLION), 2020-2029
TABLE 81 REST OF EUROPE HIGH DYNAMIC RANGE MARKET BY PRODUCT TYPE (USD BILLION), 2020-2029
TABLE 82 REST OF EUROPE HIGH DYNAMIC RANGE MARKET BY TYPE (USD BILLION), 2020-2029
TABLE 83 REST OF EUROPE HIGH DYNAMIC RANGE MARKET BY APPLICATION (USD BILLION), 2020-2029
TABLE 84 MIDDLE EAST AND AFRICA HIGH DYNAMIC RANGE MARKET BY PRODUCT TYPE (USD BILLION), 2020-2029
TABLE 85 MIDDLE EAST AND AFRICA HIGH DYNAMIC RANGE MARKET BY TYPE (USD BILLION), 2020-2029
TABLE 86 MIDDLE EAST AND AFRICA HIGH DYNAMIC RANGE MARKET BY APPLICATION (USD BILLION), 2020-2029
TABLE 87 MIDDLE EAST AND AFRICA HIGH DYNAMIC RANGE MARKET BY COUNTRY (USD BILLION), 2020-2029
TABLE 88 UAE HIGH DYNAMIC RANGE MARKET BY PRODUCT TYPE (USD BILLION), 2020-2029
TABLE 89 UAE HIGH DYNAMIC RANGE MARKET BY TYPE (USD BILLION), 2020-2029
TABLE 90 UAE HIGH DYNAMIC RANGE MARKET BY APPLICATION (USD BILLION), 2020-2029
TABLE 91 SAUDI ARABIA HIGH DYNAMIC RANGE MARKET BY PRODUCT TYPE (USD BILLION), 2020-2029
TABLE 92 SAUDI ARABIA HIGH DYNAMIC RANGE MARKET BY TYPE (USD BILLION), 2020-2029
TABLE 93 SAUDI ARABIA HIGH DYNAMIC RANGE MARKET BY APPLICATION (USD BILLION), 2020-2029
TABLE 94 SOUTH AFRICA HIGH DYNAMIC RANGE MARKET BY PRODUCT TYPE (USD BILLION), 2020-2029
TABLE 95 SOUTH AFRICA HIGH DYNAMIC RANGE MARKET BY TYPE (USD BILLION), 2020-2029
TABLE 96 SOUTH AFRICA HIGH DYNAMIC RANGE MARKET BY APPLICATION (USD BILLION), 2020-2029
TABLE 97 REST OF MIDDLE EAST AND AFRICA HIGH DYNAMIC RANGE MARKET BY PRODUCT TYPE (USD BILLION), 2020-2029
TABLE 98 REST OF MIDDLE EAST AND AFRICA HIGH DYNAMIC RANGE MARKET BY TYPE (USD BILLION), 2020-2029
TABLE 99 REST OF MIDDLE EAST AND AFRICA HIGH DYNAMIC RANGE MARKET BY APPLICATION (USD BILLION), 2020-2029
LIST OF FIGURES
FIGURE 1 MARKET DYNAMICS
FIGURE 2 MARKET SEGMENTATION
FIGURE 3 REPORT TIMELINES: YEARS CONSIDERED
FIGURE 4 DATA TRIANGULATION
FIGURE 5 BOTTOM-UP APPROACH
FIGURE 6 TOP-DOWN APPROACH
FIGURE 7 RESEARCH FLOW
FIGURE 8 GLOBAL HIGH DYNAMIC RANGE MARKET BY PRODUCT TYPE, USD BILLION, 2020-2029
FIGURE 9 GLOBAL HIGH DYNAMIC RANGE MARKET BY TYPE, USD BILLION, 2020-2029
FIGURE 10 GLOBAL HIGH DYNAMIC RANGE MARKET BY APPLICATION, USD BILLION, 2020-2029
FIGURE 11 GLOBAL HIGH DYNAMIC RANGE MARKET BY REGION, USD BILLION, 2020-2029
FIGURE 12 PORTER’S FIVE FORCES MODEL
FIGURE 13 HIGH DYNAMIC RANGE MARKET BY REGION, USD BILLION, 2021
FIGURE 14 HIGH DYNAMIC RANGE MARKET BY PRODUCT TYPE, USD BILLION, 2021
FIGURE 15 HIGH DYNAMIC RANGE MARKET BY TYPE, USD BILLION, 2021
FIGURE 16 HIGH DYNAMIC RANGE MARKET BY APPLICATION, USD BILLION, 2021
FIGURE 17 MARKET SHARE ANALYSIS
FIGURE 18 APPLE, INC.: COMPANY SNAPSHOT
FIGURE 19 CANON: COMPANY SNAPSHOT
FIGURE 20 NIKON CORPORATION: COMPANY SNAPSHOT
FIGURE 21 SAMSUNG ELECTRONICS CO., LTD.: COMPANY SNAPSHOT
FIGURE 22 LG DISPLAY CO., LTD.: COMPANY SNAPSHOT
FIGURE 23 OMNIVISION TECHNOLOGIES: COMPANY SNAPSHOT
FIGURE 24 OLYMPUS CORP.: COMPANY SNAPSHOT
FIGURE 25 SONY CORPORATION: COMPANY SNAPSHOT
FIGURE 26 FUJIFILM HOLDING CORPORATION: COMPANY SNAPSHOT
FIGURE 27 CASIO COMPUTER CO., LTD.: COMPANY SNAPSHOT
DOWNLOAD FREE SAMPLE REPORT
License Type
SPEAK WITH OUR ANALYST
Want to know more about the report or any specific requirement?
WANT TO CUSTOMIZE THE REPORT?
Our Clients Speak
We asked them to research ‘ Equipment market’ all over the world, and their whole arrangement was helpful to us. thehealthanalytics.com insightful analysis and reports contributed to our current analysis and in creating a future strategy. Besides, the te
Yosuke Mitsui
Senior Associate Construction Equipment Sales & Marketing
We asked them to research ‘Equipment market’ all over the world, and their whole arrangement was helpful to us. thehealthanalytics.com insightful analysis and reports contributed to our current analysis and in creating a future strategy. Besides, the te


